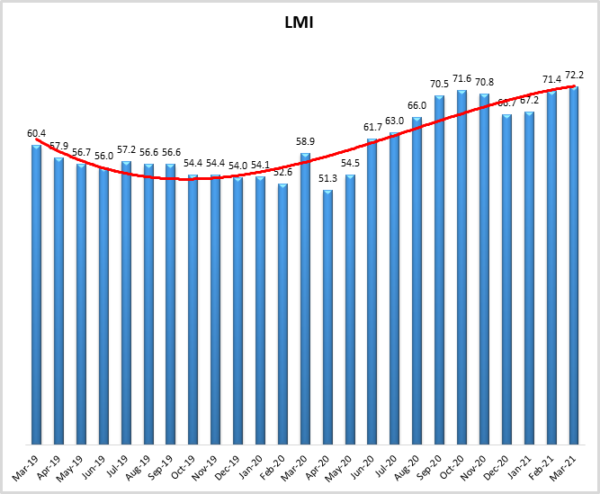
- LMI® at 72.2
- Growth is INCREASING AT AN INCREASING RATE for Inventory Costs, Warehousing Utilization, Warehousing Prices, Transportation Prices
- Growth is INCREASING AT A DECREASING RATE for Inventory Levels and Transportation Utilization
- Warehousing Capacity and Transportation Capacity are CONTRACTING
A recent Wall Street Journal article, citing idled factories, shipping backlogs, and a lack of raw materials ran with the headline: “Everywhere You Look, the Global Supply Chain Is a Mess”[1]. The March 2021 reading of the LMI might support that conclusion, as we observe high prices, including record-high Warehousing Prices, tight capacity, and an overall LMI of 72.2, up (+0.8) which is the third-highest reading in the history of the index. This overall score is up significantly from March 2020’s reading of 58.9, and well above the all-time average of 62.9.
There are a number of reasons for this growth, both internationally and domestically. The major logistics disruption, and story, over the last month, has of course been the 6-day blockage of the Suez Canal. The ramifications of the Ever Given blocking the Suez canal will continue to unfold over the next few months as carriers scramble to make up for lost time and shippers deal with delays. This is projected to cause major congestion at European ports, delaying the loading and unloading of ships as they come into port[2]. One method to do this will be to use “blank sailings” as empty containers head back to Asia so they can be refilled quickly[3]. Doing so will save time, but will also hurt European exporters. Something similar has been happening with American exports to Asia, as carriers are hurrying back to Asia and skipping a stop at Oakland to fill up with relatively low-margin goods like U.S. agricultural products[4]. The disruption in the Suez only exacerbates the continued slowness in west coast U.S. ports, where container volumes moving through the port of Los Angeles continue to increase, with an expected 130,000 and 150,000 TEU’s expected in the first two weeks of April[5]. The continued congestion in California may be a factor in Maersk to adding new routes connecting Asia and the east coast of the U.S.[6]. The result of all of this is that container rates are up 195% year over year for U.S./Asia routes and up 418% for some Asia/Europe routes[7].
The transportation capacity issues are not only limited to sea freight. According to FreightWaves, tender rejection rates have been over 25% since February 18th. This has led to increased spot-market rates and dwindling compliance[8]. Class 8 truck orders are at record highs, with just over 40,000 units ordered in March. Unfortunately, the backlog of ordered yet unproduced trucks is likely to remain high due in part to the shortage in semiconductors[9]. Ironically, the lack of capacity in the logistics market is hurting semiconductor production, which in turn is hurting the ability to bring new capacity into the logistics market, creating a negative feedback look that, in the short term, will be tough to break.
On top of all of this, the U.S. economy is widely expected to boom over the next year. Millions of Americans are being vaccinated every day, and many have received stimulus checks over the last month. This could create a “two-speed recovery” in which more advanced economies come back relatively quickly, while third-world nations are restored at a much slower rate (due to lack of vaccine availability, and the movement of capital outflows to places where there is a vaccine), leading to uneven logistics demand. This is expected to put even further strain on supply chains as the burgeoning – some would even say pent-up – U.S. consumer demand is unleashed throughout the year[10]. Evidence of the U.S. waking from its recent economic malaise is observed in the 916,00 jobs in March. This growth is likely to continue as the labor market is still down by 8.4 million jobs from February 2020[11] and there is still a long way to go towards full recovery.
The combination of increasing demand, and increasingly restricted supply will likely continue to be an issue going forward, as respondents are not optimistic about rapid increases in available capacity.
Researchers at Arizona State University, Colorado State University, Rochester Institute of Technology, Rutgers University, and the University of Nevada, Reno, and in conjunction with the Council of Supply Chain Management Professionals (CSCMP) issued this report today.
Results Overview
The LMI score is a combination of eight unique components that make up the logistics industry, including inventory levels and costs, warehousing capacity, utilization, and prices, and transportation capacity, utilization, and prices. The LMI is calculated using a diffusion index, in which any reading above 50 percent indicates that logistics is expanding; a reading below 50 percent is indicative of a shrinking logistics industry. The latest results of the LMI summarize the responses of supply chain professionals collected in March 2021. As we have seen for most of the last year, March’s LMI displays continued, expansion in the logistics industry. Overall, the LMI is up (+0.8) from February’s reading of 71.4. March’s score is the third-highest in the history of the index. This high score is largely fueled by increasing costs and tightening capacities across the board.
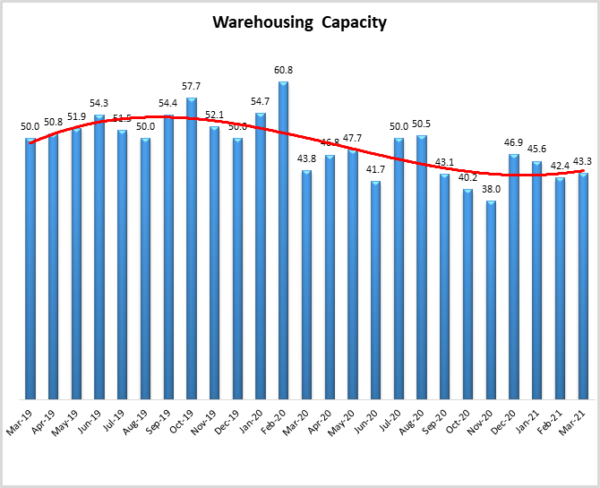
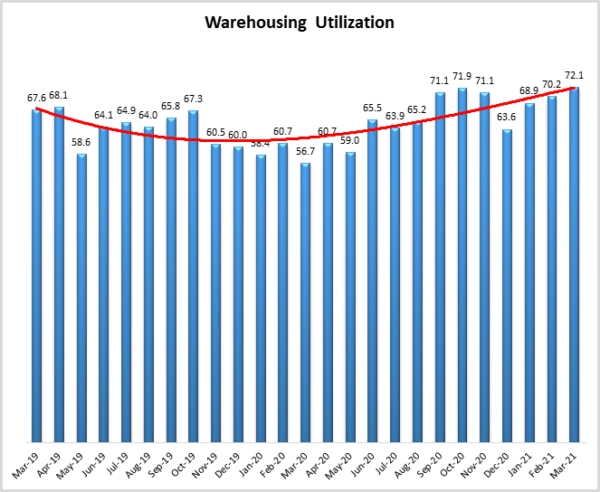
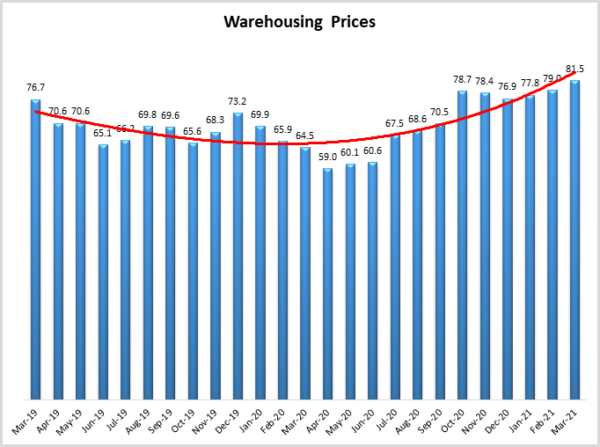
Warehouse Prices are up (+2.5) to 81.5, the highest level they have reached in the history of the index. This is notable as, of the price metrics we measure, Warehousing Prices have been the most steady and least prone to high-high’s and low-low’s. This is at least partially due to the fact that many warehouse contracts are multiyear agreements, and do not shift as dynamically as inventory or transportation costs. This high reading indicates two things: 1) Warehouse capacity has been steadily constrained for most of the last year, and the lack of supply is catching up to pricing; 2) Because of increased demand for last-mile delivery and similar services, firms are continually seeking more warehouse space and may be forced to pursue space at higher, spot-market prices. Warehousing Capacity continues to contract, although at a slightly slower (+0.9) rate of 43.4. Warehousing Utilization also remains high, up (+2.5) to a rate of 72.1.
Inventory Costs are also rising, up (3.2) to a reading of 76.8. These increased costs are likely more driven by restricted capacity and expensive storage costs than they are by a massive uptick in inventory levels. Inventory levels grew in March, but at 61.5, a lower rate (-2.5) than what has been observed over the last two months. Taken together, these metrics suggest a continuation of an observation from the February report that due to the constrained space, smaller increases in the amount of inventory being held are leading to price increases of a greater magnitude due to the marginal increasing cost of holding additional inventory.
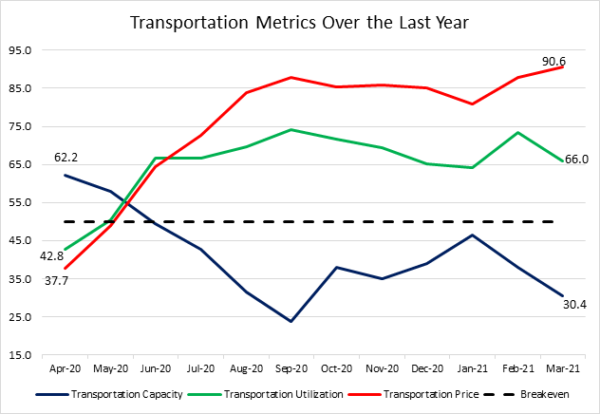
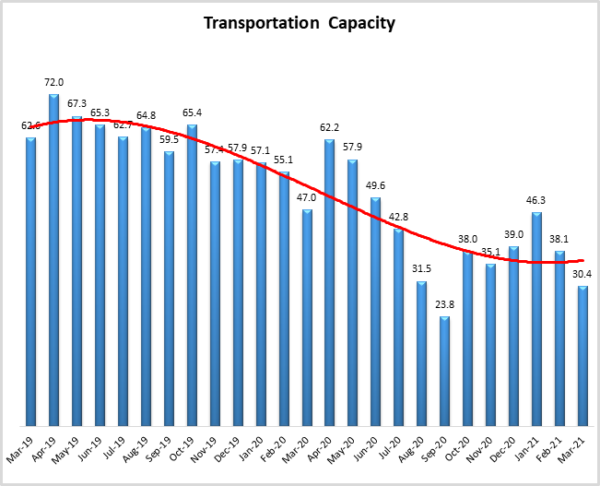
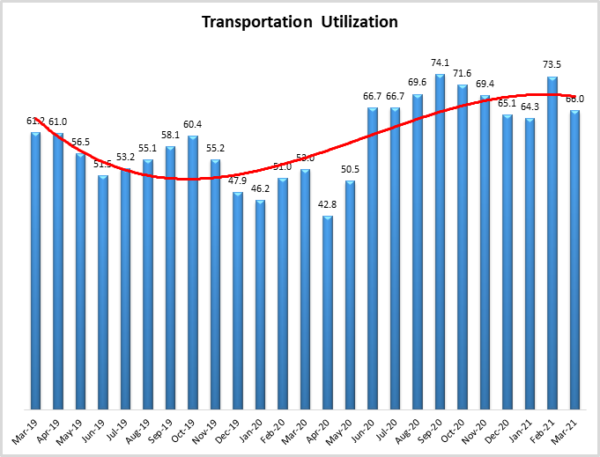
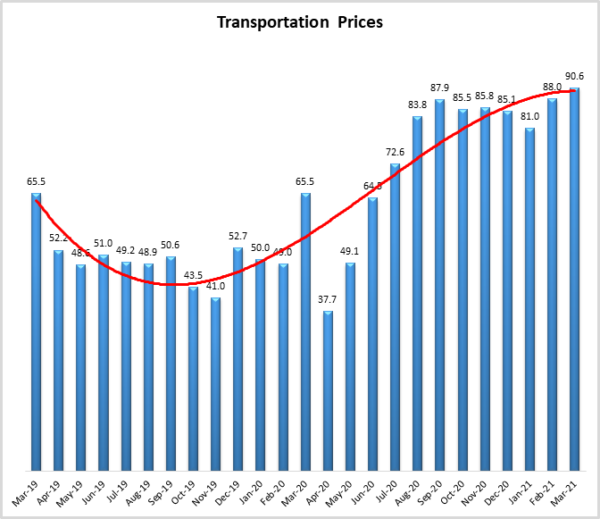
Transportation metrics continue to fluctuate. Transportation Prices are up (+2.6) to 90.6, the first reading in the ’90s since May/June 2018 and the fifth-highest reading in the history of the index. This is driven largely by the continued restriction of Transportation Capacity, down (-7.7) to 30.4, the lowest reading since last September and the third-lowest reading in the history of the index. Finally, Transportation Utilization is down (-7.5) to 66.0. This still indicates significant levels of growth but is also somewhat out of step with expectations and what we see elsewhere regarding transportation.
To dig into this further, the figure below presents the movements in our three transportation metrics over the last year. We chose to observe these metrics starting last April, when they were at the nadir at the height of the lockdown, to demonstrate the total movements in the last 12 months. The cumulative weight of the increase in eCommerce, the backlog in the ports, the lack of containers, and the backlog in fleet construction largely due to the lack of semiconductors and other supply shortages is evident in the 31.8-point drop in the change rate in Transportation Capacity. This lack of capacity has led directly to the 52.9-point uptick in Transportation Prices. The rate of change in Transportation Utilization is also up significantly with a 23.2-point jump from last April. It is interesting though that Transportation Utilization has grown so much more slowly than prices, particularly given the lack of capacity. It is possible that the recent slowdown in growth for this metric is due to some firms being “scared away” by the high prices, and choosing to delay shipments or look for an alternative.
The index scores for each of the eight components of the Logistics Managers’ Index, as well as the overall index score, are presented in the table below. Six of the eight metrics show signs of growth, with both capacity metrics continuing their run of contraction. Inventory and warehouse metrics are up, and transportation is slightly down, but still growing at significant rates. Overall, we have observed significant growth and no relief from the trying times of the holiday season through the first quarter of 2021.
| LOGISTICS AT A GLANCE | |||||
| Index | March 2021 Index | February 2021 Index | Month-Over-Month Change | Projected Direction | Rate of Change |
| LMI® | 72.2 | 71.4 | +0.9 | Growing | Increasing |
| Inventory Levels | 61.5 | 64.0 | -2.5 | Growing | Increasing |
| Inventory Costs | 80.0 | 76.8 | +3.2 | Growing | Increasing |
| Warehousing Capacity | 43.3 | 42.4 | +0.9 | Contracting | Increasing |
| Warehousing Utilization | 72.1 | 70.2 | +1.9 | Growing | Increasing |
| Warehousing Prices | 81.5 | 79.0 | +2.5 | Growing | Increasing |
| Transportation Capacity | 30.4 | 38.1 | -7.7 | Contracting | Increasing |
| Transportation Utilization | 66.0 | 73.5 | -7.5 | Growing | Increasing |
| Transportation Prices | 90.6 | 88.0 | +2.6 | Growing | Increasing |
This month, both upstream and downstream firms reported significant continued growth in the utilization of logistics services. Unlike in past months, they largely tracked together. The only major difference we observe is the 10-point difference in Transportation Utilization, albeit in somewhat different ways. Upstream firms such as 3PLs or carriers (represented by the blue bars) reported a significantly higher rate of Transportation Utilization than downstream firms (represented by the orange bars). This difference is likely due to the continued game of catch-up being played by upstream firms, contrasted with the increased use of LTL shipments by their downstream counterparts.
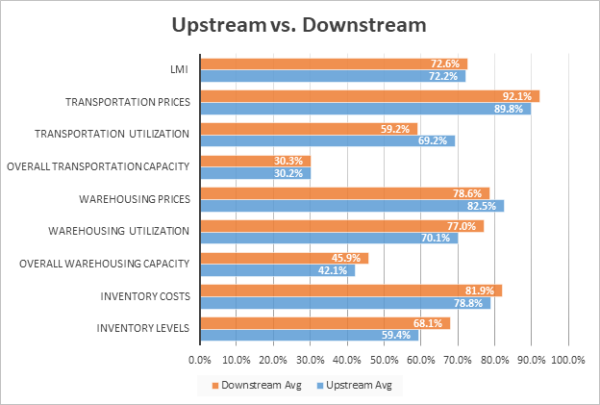
T-tests demonstrate that upstream firms are reporting marginally higher Transportation Utilization than downstream firms. Interestingly, this does not seem to have a material difference on the price growth the two groups are experiencing.
| March ‘21 | Inv. Lev. | Inv. Costs | WH Cap. | WH Util. | WH Price | Trans Cap | Trans Util. | Trans Price |
| Downstream | 68.1 | 81.9 | 45.9 | 77.0 | 78.6 | 30.3 | 59.2 | 92.1 |
| Upstream | 59.4 | 78.8 | 42.1 | 70.1 | 82.5 | 30.2 | 69.2 | 89.4 |
| Delta (abs) | 8.7 | 3.1 | 3.9 | 6.9 | 4.0 | 0.0 | 10.0 | 2.3 |
| Significant? | No | No | No | No | No | No | Marginal | No |
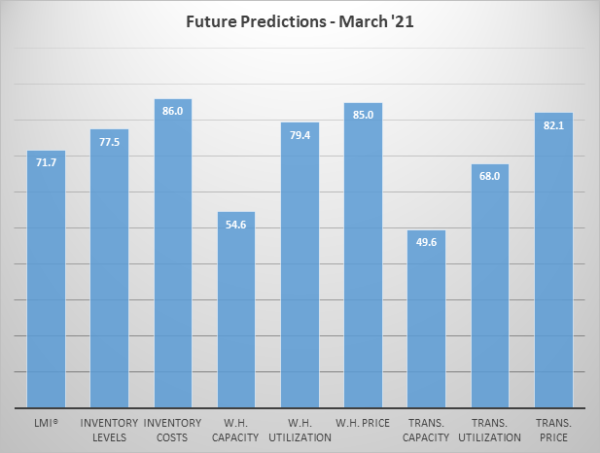
Respondents were asked to predict movement in the overall LMI and individual metrics 12 months from now. Their predictions for future ratings are presented below. Despite the continued need for more capacity, respondents do not expect much to come online, predicting moderate growth for warehousing capacity at 54.6, and essentially no movement for Transportation Capacity at 49.6. Both of these readings are down from last week when respondents were slightly more optimistic about the potential for increased supply. They in turn predict continued high rates of growth for costs in inventory, warehousing, and transportation. Demand for logistics services jumped forward by 2-3 years in 2020, and it is currently taking longer than usual to produce new capital equipment. At this point, it seems likely that it will take more than a year of building up additional capacity to catch up.
Interestingly, we see some divergence from our upstream and downstream respondents when asked to predict future movements, as can be seen in the figure below:
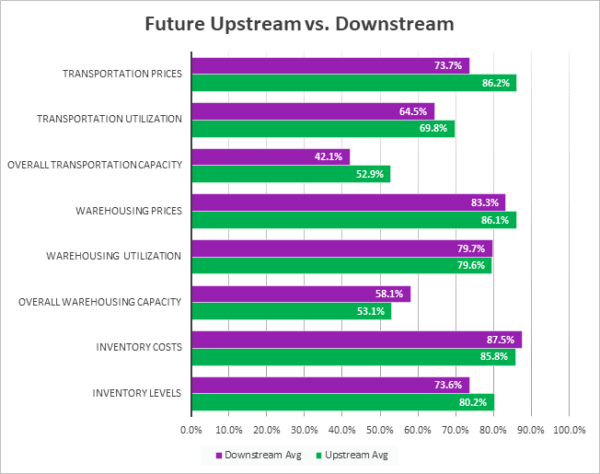
Statistical analysis confirms that upstream firms (green bars) are expecting marginally more growth in Transportation Capacity, as well as significantly more growth in Transportation Prices than their downstream counterparts (purple bars). This may be reflective of the high costs of containers, which upstream firms may be more likely to use. Whether this difference in price and capacity changes holds true over the next 12 months remains to be seen.
| Future Readings | Inv. Lev. | Inv. Costs | WH Cap. | WH Util. | WH Price | Trans Cap | Trans Util. | Trans Price |
| Downstream | 73.6 | 87.5 | 58.1 | 79.7 | 83.3 | 42.1 | 64.5 | 73.7 |
| Upstream | 80.2 | 85.8 | 53.1 | 79.6 | 86.1 | 52.9 | 69.8 | 86.2 |
| Delta (abs) | 6.6 | 1.7 | 5.0 | 0.1 | 2.8 | 10.8 | 5.3 | 12.5 |
| Significant? | No | No | No | No | No | Marginal | No | Yes |
Historic Logistics Managers’ Index Scores
This period’s along with prior readings from the last two years of the LMI are presented table below. The values have been updated to reflect the method for calculating the overall LMI:
| Month | LMI | Average for previous readings – 62.9
High – 75.7 Low – 51.3 Std. Dev – 6.53
|
| Mar ‘21 | 72.2 | |
| Feb ‘21 | 71.4 | |
| Jan ‘21 | 67.2 | |
| Dec ‘20 | 66.7 | |
| Nov ‘20 | 70.8 | |
| Oct ‘20 | 71.6 | |
| Sep ‘20 | 70.5 | |
| Aug ‘20 | 66.0 | |
| July ‘20 | 63.0 | |
| June ‘20 | 61.7 | |
| May ‘20 | 54.5 | |
| Apr ‘20 | 51.3 | |
| Mar ‘20 | 58.9 | |
| Feb ‘20 | 52.6 | |
| Jan ‘20 | 54.1 | |
| Dec ‘19 | 54.0 | |
| Nov ‘19 | 54.4 | |
| Oct ‘19 | 54.4 | |
| Sep ‘19 | 56.6 | |
| August ‘19 | 56.6 | |
| July ‘19 | 57.2 | |
| June ‘19 | 56.0 | |
| May’19 | 56.7 | |
| April ‘19 | 57.9 | |
| March ‘19 | 60.41 |
LMI®
The overall LMI index is 72.2, up (+0.8) from February’s reading of 67.2. This is the highest score for the overall index in the last two years and the third-highest overall score in the history of the index. This increase is driven by continued expansion across the cost metrics and continued contractions in available logistics capacity. March’s reading is significantly higher than the index-average LMI score of 62.9.
Respondents expect some loosening of capacity constraints but continuous growth in prices over the next 12 months, leading to a future LMI prediction of 71.7, up marginally (+0.6) from February’s future prediction of 71.1. This suggests that the logistics industry will continue to experience significant levels of growth over the next 12 months.
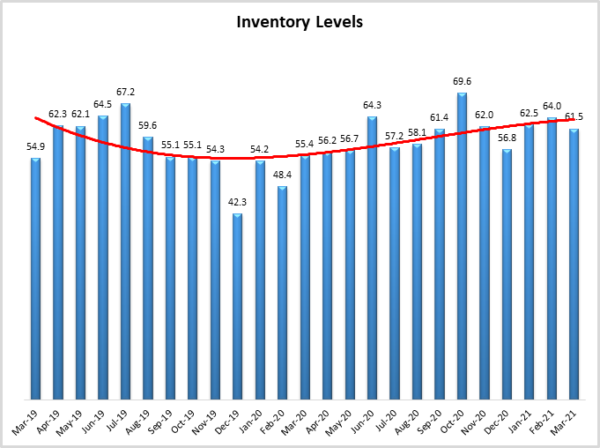
Inventory Levels
The Inventory Level value is 61.5, down (-2.5) from February’s reading of 64.0. While they are moving slowly relative to other metrics, they are still up 6.1 points higher than the same time last year, and 6.6 points higher than two years ago. This growth rate is likely depressed somewhat by the congestion seen at ports and the subsequent delay of consumer goods deliveries all around the world.
When asked to predict what conditions will be like 12 months from now, the average value is 77.5, similar to last month’s value of 79.1. This is also above the current inventory index value of 61.5. Respondents expect inventory values to continue increasing significantly over the next year. Upstream (80.2) and downstream (73.6) respondents were similar in their responses.
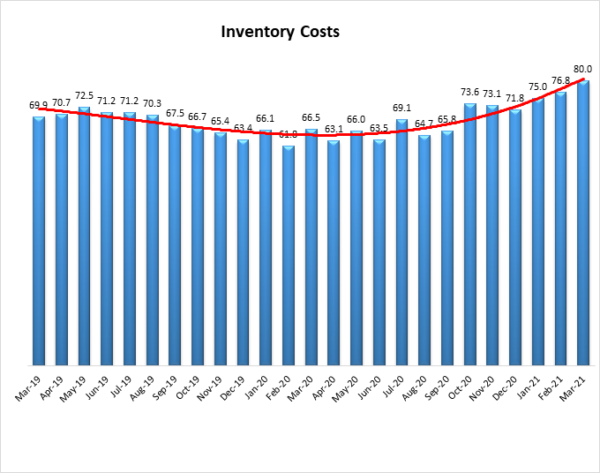
Inventory Costs
Given the continued increases in inventory levels, it is not surprising that inventory costs have continued to increase. The current value is 80.0, up (+3.2) from the previous reading of 76.8. The current value is 13.5 points above the value last year at this time and 10.1 above the value from two years ago. Inventory cost values have never fallen below 50 over the life of the index and so have always grown and never contracted. Taking this graph and the previous graph of inventory values together, inventory levels and costs are growing, at higher rates. This continued growth in costs could be related to the fact that warehousing prices and utilization are still continuing to increase.
Responses from participants seem consistent with this hypothesis. When asked about what they expect inventory costs to be like 12 months from now, the index value is 86.0, up from last month’s value of 81.1. Upstream (85.8) and downstream (87.5) gave similar responses.
Warehousing Capacity
The Warehousing Capacity Index registered 43.3 percent in March 2021, which means that warehouse capacity is still below the 50 percent mark, now for the 7th month in a row, indicating a continued contraction in this space. This result is slightly up (< 1 percentage point). In addition, this reading is relatively unchanged (approximately .5 percentage points lower) from the reading one year ago (March 2020 registered in at 43.8). Previous predictions from the LMI reports indicated a sea change of sorts, from the pre-COVID days to the present. Continued data support the idea that the consumer demand for eCommerce appears only to be growing.
Looking forward to the next 12 months, the predicted Warehousing Capacity index is predicted to increase at a rate of 54.6, down (-4.5) from February’s more optimistic reading of 59.1. This indicates that respondents are not particularly hopeful regarding new storage facilities coming online.
Warehousing Utilization
The Warehousing Utilization Index registered 72.1 percent in March 2021. This represents a rather modest 2.1 percentage point increase from last month and is up dramatically by over 16 percentage points from the March 2021 reading of 56.7. The continued increase, alongside the continued contraction in the warehousing capacity, should put continued pressure on prices.
Looking forward to the next 12 months, the predicted Warehousing Utilization index is 79.4, marginally lower (-0.5) from February’s future prediction of 79.9. Respondents expect to utilize increasingly greater amounts of available warehouse space throughout the year as supply struggles to keep up with demand.
Warehousing Prices
Warehousing Prices Index registered 81.5 percent in March 2021. This reading represents a rather an increase of 2.5 percentage point from last month, which continues the trend in the increased growth rate in warehousing prices amid the COVID-19 disruption(s). This reading is also up by a staggering 17 percentage points from the reading one year ago. Previous predictions focused on the increase in utilization, and decrease in capacity to suggest that there would continue to be upward pressure on pricing, and it seems that the pressure is unrelenting. The growth of pricing is not explicitly focused on (or as a result of) COVID, as prices have been expanding for over 24 months. There has been a shift to online buying, and omnichannel fulfillment which has been operating in the background. Previously, our team suggested that capacity would need to increase in order for pricing to come down. Given that capacity has not increased, and utilization of warehousing has continued to grow, it seems that there will be no relief in pricing anytime soon.
Future predictions suggest that respondents are expecting prices to continue to grow at a rate of 85.0, up (+4.0) from February’s future prediction of 81.0. Respondents are not expecting much capacity to come online in 2021 and therefore not seem to be anticipating much relief from March’s all-time high rates of growth in this metric.
Transportation Capacity
The Transportation Capacity Index registered 30.4 percent in Mach 2021. This constitutes a decrease of 7.7 percentage points from the February reading of 38.1. This sharp decrease continues the downward trend in transportation capacity and constitutes the second-lowest data point registered in the last 2 years. The only other lower point was in September 2020, when companies were at the height of their pre-Christmas activity. It will be interesting to see if this metric ticks back towards expansion, as respondents believe more capacity will be coming online at some point over the next year.
The future Transportation Capacity Index also dropped from the previous reading, indicating 49.6 for the next year. While this denotes a drop of 9.4 points, bringing the index below the critical threshold of 50 and indicating expectations of a slight contraction in capacity for the next 12 months.
Transportation Utilization
The Transportation Utilization Index registered 66.0 percent in Mach 2021. This number denotes a drop of 7.5 points from the February reading of 73.5. While transportation utilization is off from its recent high, the index remains elevated indicating continued expansion in transportation utilization. Generally, Transportation Prices and Utilization move together, the slower growth of the utilization metric may indicate that prices have become so high that some shippers are choosing to delay shipments or find other alternatives.
It should be noted that the future Transportation Utilization Index is also down 10 points from the previous month indicating a 68 percent level for the next 12 months. As such, expectations of continued growth in transportation utilization remain rather strong.
Transportation Prices
The Transportation Prices Index registered 90.6 percent in March 2021. This corresponds to an increase of 2.6 percent from the February transportation prices reading of 88.0, and constitutes a new 2-year record high and is the first time this metric has been in the ’90s since May/June 2018. The upward pressure on transportation prices that gained momentum in late 2020 has continued throughout the first quarter of 2021 and seems to only be getting stronger and stronger.
It looks like the upward pressure on transportation prices is here to stay, with the future index for transportation prices indicating a value of 82.1, which is slightly down from the previous month’s expectations of 86.8, but still historically quite high.
About This Report
The data presented herein are obtained from a survey of logistics supply executives based on information they have collected within their respective organizations. LMI® makes no representation, other than that stated within this release, regarding the individual company data collection procedures. The data should be compared to all other economic data sources when used in decision-making.
Data and Method of Presentation
Data for the Logistics Manager’s Index is collected in a monthly survey of leading logistics professionals. The respondents are CSCMP members working at the director level or above. Upper-level managers are preferable as they are more likely to have macro-level information on trends in Inventory, Warehousing and Transportation trends within their firm. Data is also collected from subscribers to both DC Velocity and Supply Chain Quarterly as well. Respondents hail from firms working on all six continents, with the majority of them working at firms with annual revenues of over a billion dollars. The industries represented in this respondent pool include, but are not limited to Apparel, Automotive, Consumer Goods, Electronics, Food & Drug, Home Furnishings, Logistics, Shipping & Transportation, and Warehousing.
Respondents are asked to identify the monthly change across each of the eight metrics collected in this survey (Inventory Levels, Inventory Costs, Warehousing Capacity, Warehousing Utilization, Warehousing Prices, Transportation Capacity, Transportation Utilization, and Transportation Prices). In addition, they also forecast future trends for each metric ranging over the next 12 months. The raw data is then analyzed using a diffusion index. Diffusion Indexes measure how widely something is diffused, or spread across a group. The Bureau of Labor Statistics has been using a diffusion index for the Current Employment Statics program since 1974, and the Institute for Supply Management (ISM) has been using a diffusion index to compute the Purchasing Managers Index since 1948. The ISM Index of New Orders is considered a Leading Economic Indicator.
We compute the Diffusion Index as follows:
PD = Percentage of respondents saying the category is Declining,
PU = Percentage of respondents saying the category is Unchanged,
PI = Percentage of respondents saying the category is Increasing,
Diffusion Index = 0.0 * PD + 0.5 * PU + 1.0 * PI
For example, if 25% say the category is declining, 38% say it is unchanged, and 37% say it is increasing, we would calculate an index value of 0*0.25 + 0.5*0.38 + 1.0*0.37 = 0 + 0.19 + 0.37 = 0.56, and the index is increasing overall. For an index value above 0.5 indicates the category is increasing, a value below 0.5 indicates it is decreasing, and a value of 0.5 means the category is unchanged. When a full year’s worth of data has been collected, adjustments will be made for seasonal factors as well.
Logistics Managers Index
Requests for permission to reproduce or distribute Logistics Managers Index Content can be made by contacting in writing at Dale S. Rogers, WP Carey School of Business, Tempe, Arizona 85287, or by emailing [email protected] Subject: Content Request.
The authors of the Logistics Managers Index shall not have any liability, duty, or obligation for or relating to the Logistics Managers Index Content or other information contained herein, any errors, inaccuracies, omissions, or delays in providing any Logistics Managers Index Content, or for any actions taken in reliance thereon. In no event shall the authors of the Logistics Managers Index be liable for any special, incidental, or consequential damages, arising out of the use of the Logistics Managers Index. Logistics Managers Index and LMI® are registered trademarks.
About The Logistics Manager’s Index®
The Logistics Manager’s Index (LMI) is a joint project between researchers from Arizona State University, Colorado State University, University of Nevada, Reno, Rochester Institute of Technology and Rutgers University, supported by CSCMP. It is authored by Zac Rogers Ph.D., Steven Carnovale Ph.D., Shen Yeniyurt Ph.D., Ron Lembke Ph.D., and Dale Rogers Ph.D.