LMI® at 54.4%, Growth is INCREASING AT AN INCREASING RATE for: Warehousing Capacity, Warehousing Utilization, Transportation Utilization, and Transportation Capacity.
Growth is INCREASING AT A DECREASING RATE for: Inventory Costs and Warehousing Prices. Inventory Levels are STEADY. Transportation Prices are DECREASING
The LMI score is a combination eight unique components that make up the logistics industry, including: inventory levels and costs, warehousing capacity, utilization, and prices, and transportation capacity, utilization, and prices. The LMI is calculated using a diffusion index, in which any reading above 50 percent indicates that logistics is expanding; a reading below 50 percent is indicative of a shrinking logistics industry. The latest results of the LMI summarize the responses of supply chain professionals collected in October 2019. Seven of the eight metrics read in below their historical average. Only Transportation Capacity reads in above average.
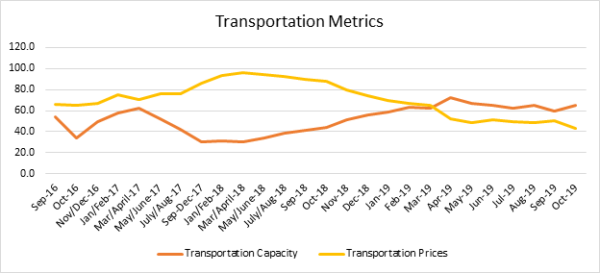
Transportation metrics continue to be the most dynamic measures in the LMI®. Transportation Prices dropped dramatically (-7.16) to 43.5. This indicates significant contraction in prices and has been more than cut in half (-44.5) from this time a year ago. Transportation Capacity is up (+5.94) (-5.34) from August, suggesting that there is slightly less slack in the transportation market than a month ago. These findings are corroborated by recent reports that volume is up, but prices are still down. The dramatic shift in Transportation Prices and Capacity can be seen in the chart below.
We see very little movement in the inventory metrics this month. Inventory Levels (+0.0) maintained their slow growth at 55.1 which is consistent with September’s reading. Unsurprisingly, the subsequent change in Inventory Costs (-0.87) was very minor. Inventory Levels fell significantly (-4.42). Continuing the interesting trend from last month, inventory seems to be growing more slowly than we would normally anticipate for this time of the year as firms prepare for the holiday shopping season.
Warehouse Capacity is up (+3.3) to 57.7, which is the highest rate recorded since May/June 2017. This suggests that either demand is down (which might line up with the slow growth in Inventory Levels), or that additional capacity continues to come online after the long shortage. Warehouse Prices are down very slightly (-4.0), but are still growing at a rate of 65.6. While there is still growth, it should be noted that is down 14.6 points from this time a year ago).
The index scores for each of the eight components of the Logistics Managers’ Index, as well as the overall index score, are presented in the table above. All eight metrics show signs of growth, but many of them are moving at low or considerably decreased rates. The overall LMI® index score is equal to last month, tied for the second lowest point in the history of the index. Our reading indicates a continued trend of slow yet steady growth in the logistics industry.
| LOGISTICS AT A GLANCE | |||||
| Index | October 2019 Index | August 2019 Index | Month-Over-Month Change | Projected Direction | Rate of Change |
| LMI® | 54.4 | 56.6 | -2.19 | Growing | Decreasing |
| Inventory Levels | 55.1 | 55.1 | 0.00 | No Movement | Steady |
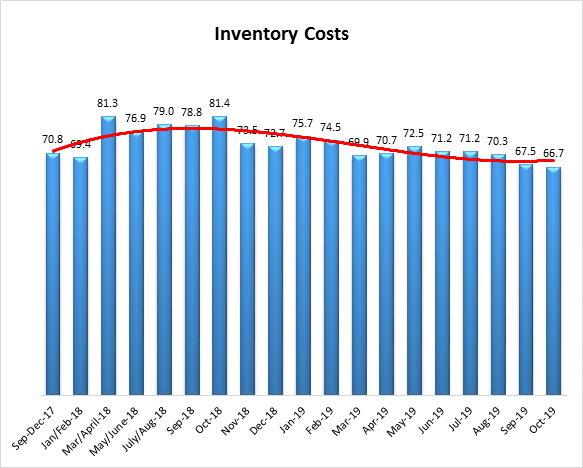
| Inventory Costs | 66.7 | 67.5 | -0.87 | Growing | Decreasing |
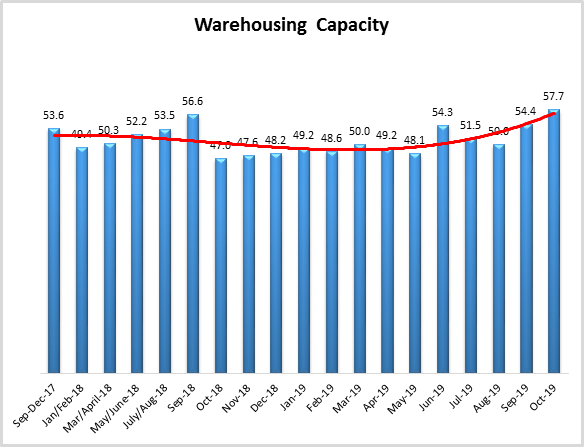
| Warehousing Capacity | 57.7 | 54.4 | 3.26 | Growing | From No Movement |
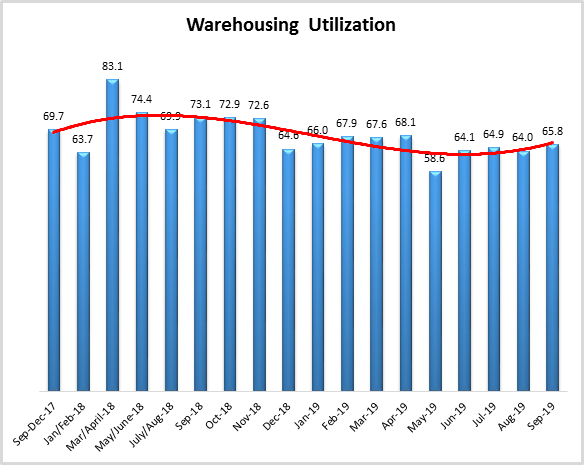
| Warehousing Utilization | 67.3 | 65.8 | 1.48 | Growing | Increasing |
| Warehousing Prices | 65.6 | 69.6 | -4.01 | Growing | Decreasing |
| Transportation Capacity | 65.4 | 59.5 | 5.94 | Growing | Increasing |
| Transportation Utilization | 60.4 | 58.1 | 2.24 | Growing | Increasing |
| Transportation Prices | 43.5 | 50.6 | -7.16 | Contracting | From Increasing |
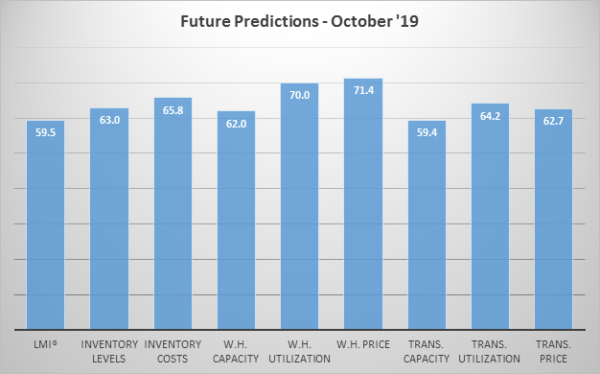
Respondents were asked to predict movement in the overall LMI and individual metrics 12 months from now. Their predictions for future ratings (which up to this point have been fairly accurate) are presented below.
Historic Logistics Managers’ Index Scores
This period’s along with all prior readings of the LMI are presented table below. The values have been updated to reflect the method for calculating the overall LMI:
| Month | LMI | Average for previous readings – 63.2
High – 75.7 Low – 54.4 Std. Dev – 5.8
|
| Oct ‘19 | 54.4 | |
| Sep ‘19 | 56.6 | |
| August ‘19 | 56.6 | |
| July ‘19 | 57.2 | |
| June ‘19 | 56.0 | |
| May’19 | 56.7 | |
| April ‘19 | 57.9 | |
| March ‘19 | 60.41 | |
| February ‘19 | 61.95 | |
| January ‘19 | 63.33 | |
| December ‘18 | 63.54 | |
| November ‘18 | 66.98 | |
| October ‘18 | 71.20 | |
| September ‘18 | 70.80 | |
| July/August ‘18 | 70.80 | |
| May/June ‘18 | 72.55 | |
| March/April ‘18 | 75.71 | |
| January/February‘18 | 68.89 | |
| September-December ‘17 | 70.09 | |
| July/August ‘17 | 63.64 | |
| May/June ‘17 | 62.02 | |
| Mar/April ‘17 | 60.76 | |
| Jan/Feb ‘17 | 61.69 | |
| Nov/Dec ‘16 | 61.79 | |
| Oct ‘16 | 60.36 | |
| Sep ‘16 | 60.70 |
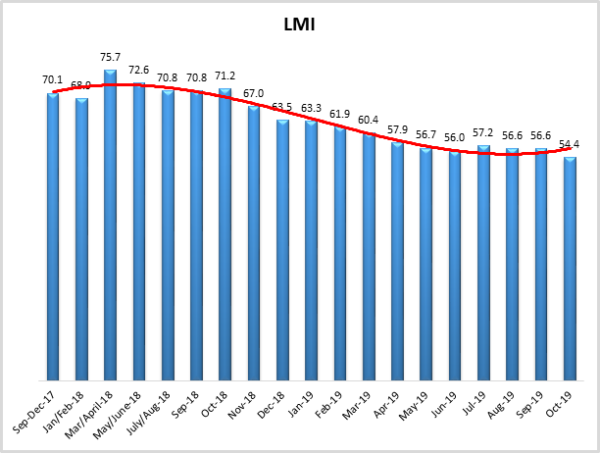
LMI®
The overall LMI index is 54.4 in the October 2019 reading, down (-2.2) from the reading of 56.6 in September 2019. As mentioned above, this is the lowest reading for the overall index in the three-year history of the LMI. This is down significantly (-16.8) from this time a year ago, when it read in at 71.2. We have seen low scores for the LMI throughout the Summer and Fall, with the lowest seven scores in the history of the index coming in the last seven months.
Respondents predict the LMI will be at 59.5 12 months in the future, down 4.2 points from September’s future prediction of 63.7.
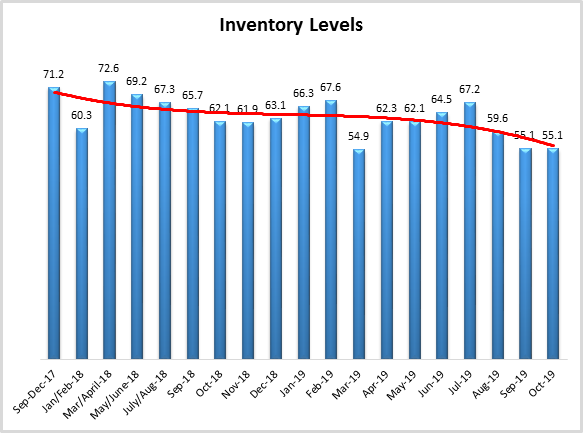
Inventory Levels
The Inventory Level index is 55.1, which is exactly the same as the previous level, indicating no change in the amount of increase. This value is 7.0 points below the value one year ago and 16.1 points down from two years ago at this time. In this time of year, increasing inventory values might be expected, as companies build up inventories in preparation for the upcoming holiday shopping season. In the previous two years, this was the case. The recent lower growth numbers could indicate that inventory growth is slowing, which could indicate a lower sales expectations than previous years.
When asked to predict what will conditions will be like 12 months from now, the average value is 63.0, indicating inventory levels are expected to continue to grow. This value is lower than last month’s year-ahead prediction of 66.2, and still consistent with a prediction of increasing levels next year, but another indicator of reducing growth.
Inventory Costs
Given the continued string of inventory growth numbers, it is not surprising that inventory costs continue to increase. The current value is 66.7 which is almost 1 point below the previous reading of 67.5. These continued high levels indicate strong continued growth in inventory costs, and are below the long-term average of 71.8. Additionally, the current value is 14.7 points lower than the 81.4 value last year at this time, and below the 70.8 value of two years ago at this time. Because Inventory Levels are increasing, and Warehousing Capacity is decreasing, it seems quite likely costs will continue to rise.
Responses seem consistent with this hypothesis. When asked about what they expect inventory costs to be like 12 months from now, the index value is 65.8, much lower than last month’s value of 74.0. This value reflects expected continued inventory cost growth, but at a lower level. Respondents clearly expect inventory costs to continue to be high for the next 12 months.
Warehousing Capacity
The Warehousing Capacity Index registered 57.7 percent in October 2019. This represents an increase of 3.3 points from the October 2019 reading and large increase of over 10 points from the reading one year ago. Also of note, is that this reflects a continuation of the change seen in September, which represented a break in a three month declining growth rate of capacity. This shift could indicate an expansion in continued preparation for the holiday season. It may also be related to the slower-than-expected growth of Inventory Levels.
Looking forward at the next 12 months, the predicted Warehousing Capacity index 62.0, up (+7.5) from September’s future prediction.
Warehousing Utilization
The Warehousing Utilization Index registered 67.3 percent in October 2019. This represents a slight increase of 1.5 percentage points, and 5.6 points down from the October 2018 reading of 72.9. This reading, also in conjunction with the increased growth rate in capacity, accentuates previous indications that there may be a shift in the market, perhaps related to the forthcoming holiday season. That is, the continued rate of growth in the utilization rate may be the signal to increase capacity.
Looking forward at the next 12 months, the predicted Warehousing Utilization index is 70.0, down slightly (-3.7) from September’s future prediction, firms believe that there will be steady growth as they utilize more existing warehouse capacity consistently over the next year.
Warehousing Prices
Warehousing Prices Index registered 65.6 percent in October 2019. This is down 4 points from the September 2019 reading of 69.6. This reading is sharply down nearly 15 points from one year ago. Taken together, given the increased warehousing capacity, the increased rate in utilization, this continued rebound in the rate of price growth suggests that the market is continuing to respond to previous pressure in the Warehousing Utilization rates through price augmentation. Stated differently, the market may be responding by increasing capacity and utilization given the slight price decrease.
Looking forward at the next 12 months, the predicted Warehousing Prices index is 71.4 consistent (-0.8) with September’s future prediction. While down slightly, this still indicates that firms are expecting an increase growth in Warehouse Prices over the next 12 months.