LMI® at 54.4%, Growth is INCREASING AT AN INCREASING RATE for: Warehousing Prices. Growth is INCREASING AT A DECREASING RATE for: Inventory Levels, Inventory Costs, Warehousing Capacity, Warehousing Utilization, Transportation Capacity and Transportation Utilization. Transportation Prices are DECREASING.
The LMI score is a combination eight unique components that make up the logistics industry, including: inventory levels and costs, warehousing capacity, utilization, and prices, and transportation capacity, utilization, and prices. The LMI is calculated using a diffusion index, in which any reading above 50 percent indicates that logistics is expanding; a reading below 50 percent is indicative of a shrinking logistics industry. The latest results of the LMI summarize the responses of supply chain professionals collected in November 2019. Similar to October, seven of the eight metrics read in below their historical average. Only Transportation Capacity reads in above average.
Transportation metrics continue to be the most dynamic measures in the LMI®. Transportation Prices are down 2.5 points to 41.0, their lowest point in the history of the index, and down nearly 40 points (-39.8) from this time a year ago when they sat at 79.8. This indicates a continuation in the significant contraction in prices which began approximately a year ago. Capacity and Price generally exhibit an inverse relationship, so it is somewhat surprising that the growth in Transportation Capacity is down (-8.0) from October. That being said, the score of 57.4 indicates that capacity is still growing, but at a decreasing rate.
We see very little movement in the inventory metrics this month. Inventory Levels (-0.9) maintained their slow growth at 54.3. Unsurprisingly, the subsequent change in Inventory Costs (-1.3) was very minor. Both inventory metrics are growing, but at a slower pace than we would normally anticipate for this time of the year as firms prepare for the holiday shopping season. Interestingly, Black Friday sales were still up dramatically this year[1], so perhaps the decreasing inventory growth is due to more efficient management of goods than an anticipated slowdown in consumer spending?
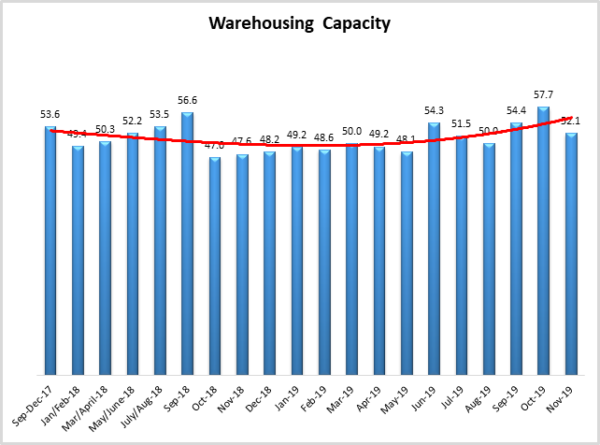
Warehouse Capacity is down dramatically (-5.6) to 52.1, indicating that capacity is just barely keeping up with demand. We observe the associated jump in Warehouse Prices (+2.8) to 68.3. While this is a robust rate of growth, it should be noted that is down 8.7 points from this time a year ago.
The index scores for each of the eight components of the Logistics Managers’ Index, as well as the overall index score, are presented in the table above. Seven of the eight metrics show signs of growth, but many of them are moving at low or considerably decreased rates. The overall LMI® index score is equal to last month, tied for the lowest point in the history of the index. Our reading indicates a continued trend of slow yet steady growth in the logistics industry.
| LOGISTICS AT A GLANCE | |||||
| Index | November 2019 Index | October 2019 Index | Month-Over-Month Change | Projected Direction | Rate of Change |
| LMI® | 54.5 | 54.4 | -0.04 | Growing | Decreasing |
| Inventory Levels | 54.3 | 55.1 | -0.87 | Growing | Decreasing |
| Inventory Costs | 65.4 | 66.7 | -1.28 | Growing | Decreasing |
| Warehousing Capacity | 52.1 | 57.7 | -5.56 | Growing | Decreasing |
| Warehousing Utilization | 60.5 | 67.3 | -6.78 | Growing | Decreasing |
| Warehousing Prices | 68.3 | 65.6 | +2.75 | Growing | Increasing |
| Transportation Capacity | 57.4 | 65.4 | -7.99 | Growing | Decreasing |
| Transportation Utilization | 55.2 | 60.4 | -5.16 | Growing | Decreasing |
| Transportation Prices | 41.0 | 43.5 | -2.49 | Contracting | Decreasing |
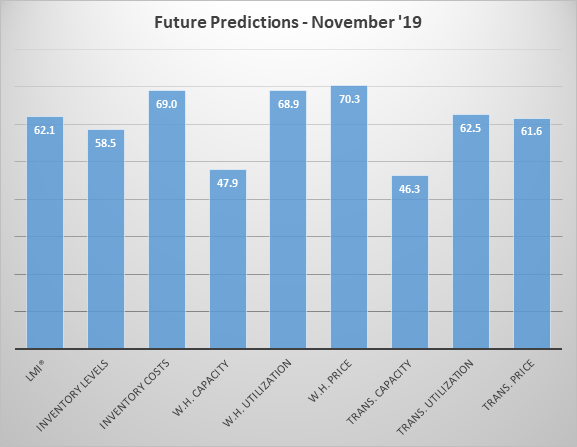
Respondents were asked to predict movement in the overall LMI and individual metrics 12 months from now. Their predictions for future ratings are presented below and seem to be somewhat more optimistic than our current readings.
Historic Logistics Managers’ Index Scores
This period’s along with all prior readings of the LMI are presented table below. The values have been updated to reflect the method for calculating the overall LMI:
| Month | LMI | Average for previous readings – 62.9
High – 75.7 Low – 54.4 Std. Dev – 5.9
|
| Nov ‘19 | 54.4 | |
| Oct ‘19 | 54.4 | |
| Sep ‘19 | 56.6 | |
| August ‘19 | 56.6 | |
| July ‘19 | 57.2 | |
| June ‘19 | 56.0 | |
| May’19 | 56.7 | |
| April ‘19 | 57.9 | |
| March ‘19 | 60.41 | |
| February ‘19 | 61.95 | |
| January ‘19 | 63.33 | |
| December ‘18 | 63.54 | |
| November ‘18 | 66.98 | |
| October ‘18 | 71.20 | |
| September ‘18 | 70.80 | |
| July/August ‘18 | 70.80 | |
| May/June ‘18 | 72.55 | |
| March/April ‘18 | 75.71 | |
| January/February‘18 | 68.89 | |
| September-December ‘17 | 70.09 | |
| July/August ‘17 | 63.64 | |
| May/June ‘17 | 62.02 | |
| Mar/April ‘17 | 60.76 | |
| Jan/Feb ‘17 | 61.69 | |
| Nov/Dec ‘16 | 61.79 | |
| Oct ‘16 | 60.36 | |
| Sep ‘16 | 60.70 |
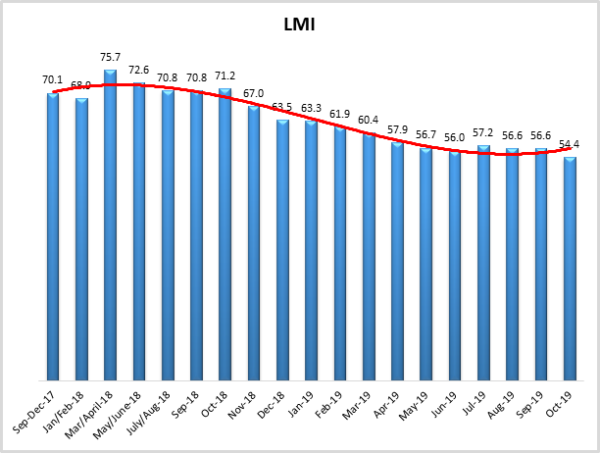
LMI®
The overall LMI index is 54.4 in the November 2019 reading, essentially equal (though down very slightly at -0.4) from October 2019. As mentioned above, this is the lowest reading for the overall index in the three-year history of the LMI. This is down significantly (-12.6) from this time a year ago, when it read in at 67.0. We have seen low scores for the LMI throughout the Summer and Fall, with the lowest eight scores in the history of the index coming in the last eight months.
Respondents predict the LMI will be at 62.1 12 months in the future, up 2.6 points from October’s future prediction of 59.5.
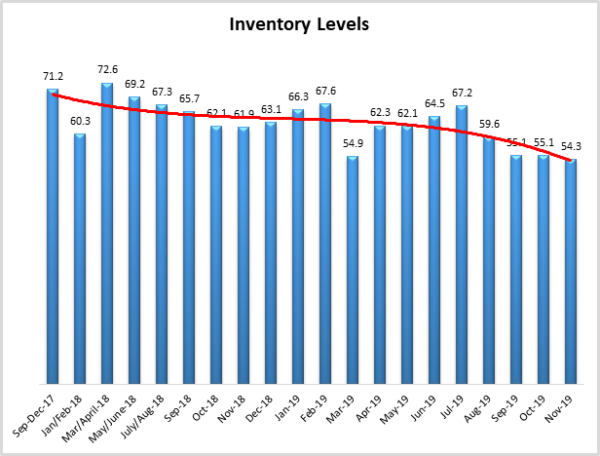
Inventory Levels
The Inventory Level index is 54.3, down slightly (-0.9) from October’s reading. This value is 7.6 points below the value one year ago and 16.9 points down from two years ago at this time. In this time of year, increasing inventory values might be expected, as companies build up inventories in preparation for the holiday shopping season. In the previous two years, this was the case.
When asked to predict what will conditions will be like 12 months from now, the average value is 58.5, down slightly (-4.5) from October’s future prediction of 63.0.
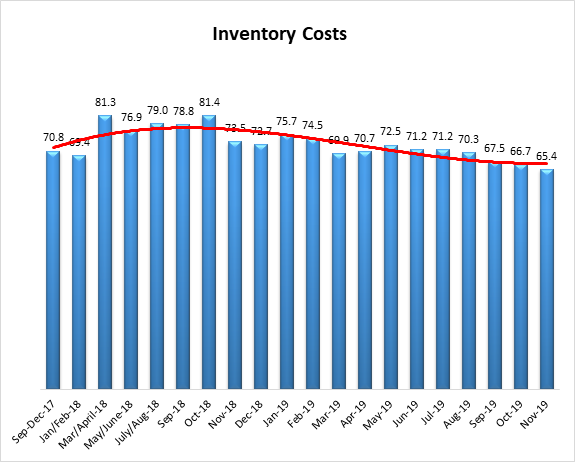
Inventory Costs
Given the continued string of inventory growth numbers, it is not surprising that inventory costs continue to increase. The current value is 65.4, down slightly (-1.3) from October’s reading of 66.7. These continued high levels indicate strong continued growth in inventory costs, but are below the long-term average of 71.6.
When asked about what they expect inventory costs to be like 12 months from now, the index value is 69.0, up slightly (+3.2) from October’s future prediction of 65.8. This value reflects expected continued inventory cost growth over the next 12 months.
Warehousing Capacity
The Warehousing Capacity Index registered 52.1 percent in November 2019. This represents a decrease of 5.6 points from the October 2019 reading and modest increase of over 5 points from the reading one year ago. Also of note, is that this reflects a break in the previous three month trend of increasing values (since August 2019) which, at that time, represented a break in a three month declining growth rate of capacity. This shift could indicate a seasonal trend in the capacity, as the increases seen previously could have been in preparation for the impending holiday season. This pattern too, could indicate a seasonal pattern.
Looking forward at the next 12 months, the predicted Warehousing Capacity index 47.9, down dramatically (-14.1) from October’s future prediction of 62.0. This may indicate that respondents expect a sizable increase in the demand for warehousing space going forward.
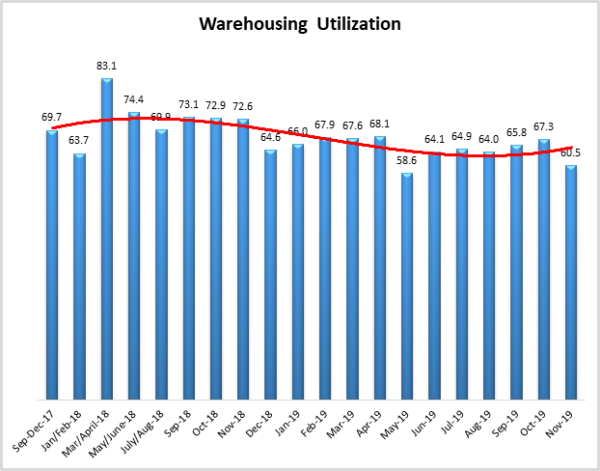
Warehousing Utilization
The Warehousing Utilization Index registered 60.5 percent in November 2019. This represents a decrease of nearly 7 percentage points, and sharply down by 12.1 points from the October 2018 reading of 72.6. This reading, also in conjunction with the decreased growth rate in capacity, accentuates previous indications that there may be a shift in the market. That is, the decreased rate of growth in the utilization rate may be the signal to decrease capacity.
Looking forward at the next 12 months, the predicted Warehousing Utilization index is 68.9, down slightly (-1.1) from October’s future prediction of 70.0. Essentially, firms believe that there will be steady growth as they utilize more existing warehouse capacity consistently over the next year.
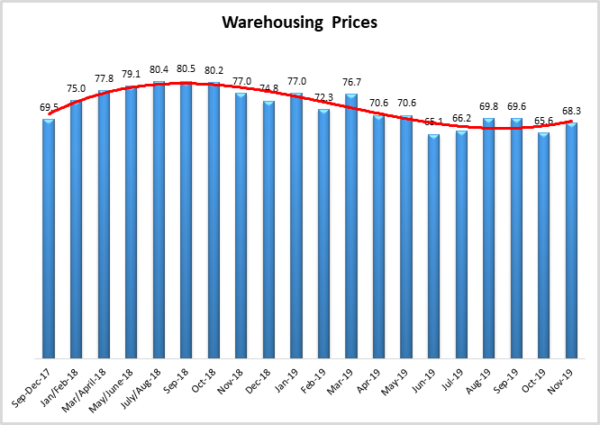
Warehousing Prices
Warehousing Prices Index registered 68.3 percent in October 2019. This is slightly up by nearly 3 points from the October 2019 reading of 65.6. This reading is sharply down nearly 9 points from one year ago. Taken together, given the decreased warehousing capacity, the decreased rate in utilization, this continued rebound in the rate of price growth suggests that the market is continuing to respond to previous pressure in the warehousing utilization rates through price augmentation. Stated differently, the market may be responding by decreasing the rate of increase in capacity and utilization given the slight price increase.
Looking forward at the next 12 months, the predicted Warehousing Prices index is 70.3, down slightly (-1.1) from October’s future prediction. While down slightly, this still indicates that firms are expecting an increase growth in Warehouse Prices over the next 12 months.
Transportation Capacity
The Transportation Capacity Index registered 57.4 percent in November 2019. This is a decrease (-8.0) from the October reading of 65.4. Available capacity has fluctuated wildly over the last few months, with this being the fourth consecutive movement of more than 5 points.
Looking forward at the next 12 months, the predicted Transportation Capacity index is 46.3, down significantly (-24.0) from October’s future prediction of 40.3. This is similar to the drop we saw in Warehouse Capacity, and may reflect a similar sentiment that transportation demand will also increase significantly over the next 12 months.
![]()
Transportation Utilization
decrease of 5.2 percentage points from the October reading of 60.4, indicating a break from the increasing trend seen in the Transportation Utilization Index over the last 4 months. However, this is still down 14.5 points from the same period last year.
Looking forward at the next 12 months, the predicted Transportation Utilization index is 62.5, down slightly (-1.7) from October’s future prediction of 64.2.
![]()
Transportation Prices
The Transportation Prices Index registered 41.0 percent in November 2019. This is a 2.5 percent decrease from the October 2019 transportation prices reading of 43.5. The 41.0 reading is lower than the critical 50 percent and indicates declining transportation prices. Also, 41.0 is the new lowest level ever recorded by the Transportation Prices Index and down 38.8 points from this time one year ago.
Looking forward at the next 12 months, the predicted Transportation Prices index is 61.6, down slightly (-1.1) from October’s future prediction of 62.7. Respondents are predicting steady increases in price a year from now, a far cry from what we currently observe.
![]()
About This Report
The data presented herein are obtained from a survey of logistics supply executives based on information they have collected within their respective organizations. LMI® makes no representation, other than that stated within this release, regarding the individual company data collection procedures. The data should be compared to all other economic data sources when used in decision-making.
Data and Method of Presentation
Data for the Logistics Manager’s Index is collected in a monthly survey of leading logistics professionals. The respondents are CSCMP members working at the director-level or above. Upper-level managers are preferable as they are more likely to have macro-level information on trends in Inventory, Warehousing and Transportation trends within their firm. Data is also collected from subscribers to both DC Velocity and Supply Chain Quarterly as well. Respondents hail from firms working on all six continents, with the majority of them working at firms with annual revenues over a billion dollars. The industries represented in this respondent pool include, but are not limited to: Apparel, Automotive, Consumer Goods, Electronics, Food & Drug, Home Furnishings, Logistics, Shipping & Transportation, and Warehousing.
Respondents are asked to identify the monthly change across each of the eight metrics collected in this survey (Inventory Levels, Inventory Costs, Warehousing Capacity, Warehousing Utilization, Warehousing Prices, Transportation Capacity, Transportation Utilization, and Transportation Prices). In addition, they also forecast future trends for each metric ranging over the next 12 months. The raw data is then analyzed using a diffusion index. Diffusion Indexes measure how widely something is diffused, or spread across a group. The Bureau of Labor Statistics has been using a diffusion index for the Current Employment Statics program since 1974, and the Institute for Supply Management (ISM) has been using a diffusion index to compute the Purchasing Managers Index since 1948. The ISM Index of New Orders is considered a Leading Economic Indicator.
We compute the Diffusion Index as follows:
PD = Percentage of respondents saying the category is Declining,
PU = Percentage of respondents saying the category is Unchanged,
PI = Percentage of respondents saying the category is Increasing,
Diffusion Index = 0.5 * PD + 0.5 * PU + 1.0 * PI
For example, if 25% say the category is declining, 38% say it is unchanged, and 37% say it is increasing, we would calculate an index value of 0*0.25 + 0.5*0.38 + 1.0*0.37 = 0 + 0.19 + 0.37 = 0.56, and the index is increasing overall. For an index value above 0.5 indicates the category is increasing, a value below 0.5 indicates it is decreasing, and a value of 0.5 means the category is unchanged. When a full year’s worth of data has been collected, adjustments will be made for seasonal factors as well.