LMI® at 56.6%. Growth is INCREASING AT AN INCREASING RATE for: Warehousing Prices, Transportation Capacity and Transportation Utilization. Growth is INCREASING AT ADECREASING RATE for: Inventory Levels Inventory Costs, Warehousing Capacity and Warehousing Utilization. Warehousing Capacity is STEADY. Transportation Prices are DECREASING.
According to a sample of North American logistics executives, growth continued (although at a decreasing rate) across the logistics sector in August 2019. Six of the eight metrics are increasing, although only two of those are at an increasing rate. Warehouse Capacity is holding steady, and Transportation Prices, which have been the LMI metric most predictive of the economy, is DECREASING for the third time in four readings.
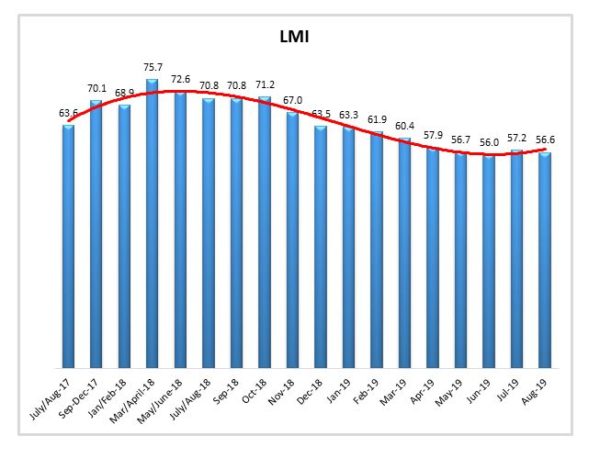
The overall LMI is down (-0.32), reaching a score of 56.6, which is the second lowest score in the history of the index. This is also down significantly from this time a year ago, when it registered at 70.8. With that being said, August’s score of 56.6 is still above 50.0, which indicates (slowing) growth in the logistics industry.
Researchers at Arizona State University, Colorado State University, Rochester Institute of Technology, Rutgers University, and the University of Nevada, Reno, and in conjunction with the Council of Supply Chain Management Professionals (CSCMP) issued this report today.
Results Overview
The LMI score is a combination eight unique components that make up the logistics industry, including: inventory levels and costs, warehousing capacity, utilization, and prices, and transportation capacity, utilization, and prices. The LMI is calculated using a diffusion index, in which any reading above 50 percent indicates that logistics is expanding; a reading below 50 percent is indicative of a shrinking logistics industry. The latest results of the LMI summarize the responses of supply chain professionals collected in August 2019. Seven of the eight metrics read in below their historical average. Only Transportation Capacity reads in above average.
Transportation metrics have been the most dynamic over the history of the LMI®. Transportation Prices are detracting for the third time in four months, down slightly (-0.32) to 48.9, which suggests a marginal decrease in freight price. This is a vast difference from a year ago. In August 2018 Transportation Prices were growing at a rate of 92.7, making for a 43.8 point drop over the course of the year. The change index used by the LMI® ranges from 0-100, so to go from growing at close to the fastest rate possible to contracting in the span of 12 months suggests a significant shift in the market. This lack of growth, with the continued growth of Transportation Capacity (64.8, up 26.4 points from 38.4 at this time a year ago). These findings corroborate recent reports of cratering freight markets, with trucking companies closing at a significantly increasing rate[1].
Warehouse Prices are up once again (+3.6), likely due to the stagnation (-1.5) in Warehouse Capacity which has held at a steady state of 50.0. Although Warehouse Prices are up month-over-month, they are still down sharply from a year ago when they were at 80.4. Finally, Inventory Levels are down significantly (-7.6) from the last reading to 59.6. While firms are still adding inventory, it is at a slower pace than last month as well as the historical average.
| LOGISTICS AT A GLANCE | |||||
| Index | August 2019 Index | July 2019 Index | Month-Over-Month Change | Projected Direction | Rate of Change |
| LMI® | 56.6 | 57.2 | -0.60 | Growing | Decreasing |
| Inventory Levels | 59.6 | 67.2 | -7.61 | Growing | Decreasing |
| Inventory Costs | 70.3 | 71.2 | -0.86 | Growing | Decreasing |
| Warehousing Capacity | 50.0 | 51.5 | -1.49 | Steady | From Increasing |
| Warehousing Utilization | 64.0 | 64.9 | -0.88 | Growing | Decreasing |
| Warehousing Prices | 69.8 | 66.2 | +3.61 | Growing | Increasing |
| Transportation Capacity | 64.8 | 62.7 | +2.14 | Growing | Increasing |
| Transportation Utilization | 55.1 | 53.2 | +1.94 | Growing | Increasing |
| Transportation Prices | 48.9 | 49.2 | -0.32 | Contracting | Decreasing |
The index scores for each of the eight components of the Logistics Managers’ Index, as well as the overall index score, are presented in the table below. All seven of eight metrics are up, but many are moving at low or considerably decreased rates. The overall LMI® index score is down to its lowest point in the history of the index, but still indicates growth in the logistics industry.
Historic Logistics Managers’ Index Scores
This period’s along with all prior readings of the LMI are presented table below. The values have been updated to reflect the method for calculating the overall LMI:
| Month | LMI | Average for previous readings – 63.8
High – 75.71 Low – 56.0 Std. Dev – 5.57 |
| August ‘19 | 56.6 | |
| July ‘19 | 57.2 | |
| June ‘19 | 56.0 | |
| May’19 | 56.7 | |
| April ‘19 | 57.9 | |
| March ‘19 | 60.41 | |
| February ‘19 | 61.95 | |
| January ‘19 | 63.33 | |
| December ‘18 | 63.54 | |
| November ‘18 | 66.98 | |
| October ‘18 | 71.20 | |
| September ‘18 | 70.80 | |
| July/August ‘18 | 70.80 | |
| May/June ‘18 | 72.55 | |
| March/April ‘18 | 75.71 | |
| January/February‘18 | 68.89 | |
| September-December ‘17 | 70.09 | |
| July/August ‘17 | 63.64 | |
| May/June ‘17 | 62.02 | |
| Mar/April ‘17 | 60.76 | |
| Jan/Feb ‘17 | 61.69 | |
| Nov/Dec ‘16 | 61.79 |
LMI®
The overall LMI index is 56.6 in the August 2019 reading, which is down very slightly from July’s index score of 57.2, and the second-lowest score in the history of the index. Before April of this year, the overall LMI had never dipped below 60.0, it has been below 60.0 in every reading since. The variance in the LMI index has been minimal over the last five readings, with a total range of 1.9. This may indicate that the logistics industry has settled into a state of low, but steady growth.
Interestingly, respondents expect the LMI will be up significantly in the next 12 months, estimating it at 62.7. This indicates that our panel is optimistic that the logistics industry will be on firmer footing and growing at a faster rate a year into the future.
Inventory Levels
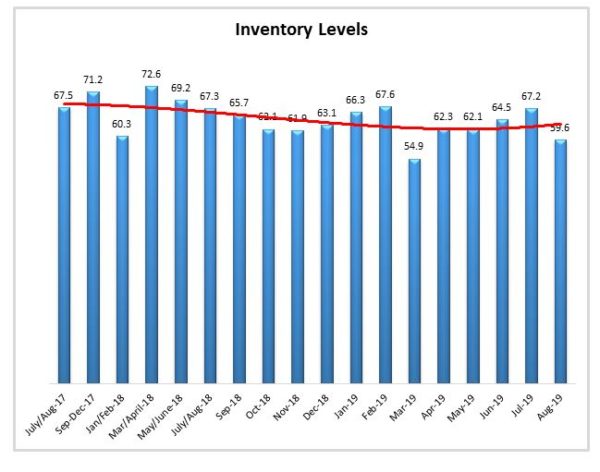
The Inventory Level index is 59.6, 6.6 points down from last month’s reading, indicating that that inventory levels are rising but at a decreasing rate. This value is approximately 8 points below the value both one and two years ago at this time. This is the second time in a year that the value has dropped below 60.0 and is below the average score of 63.5 for this metric. However, as all values above 50 indicate growing inventory levels, the string of uninterrupted growth that started in November/December of 2016 continues. With the exception of March, 2019, every value in the past two years has been above 60, so growth seems to remain low, but consistent. If values continue to drop in future months, values could easily drop below 50.
When asked to predict what will conditions will be like 12 months from now, the average value is 63.3, indicating inventory levels are expected to continue to grow. This value is above (+2.9) last month’s year-ahead prediction of 60.4
Inventory Costs
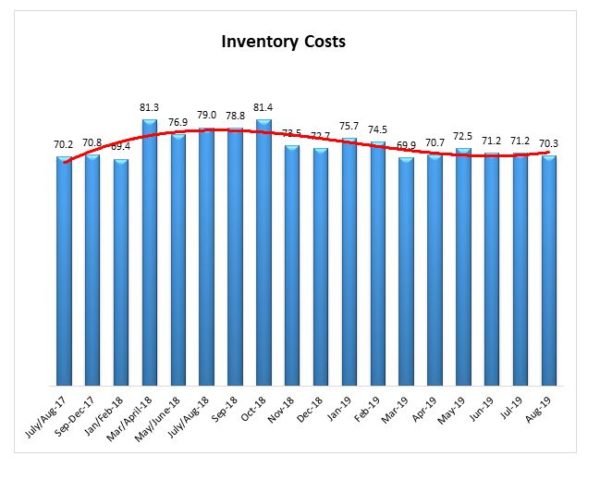
Given the continued levels of inventory growth, it is not surprising that inventory costs continue to increase. The current value is 70.3, which is slightly below the previous reading of 71.2 but still well above 50.0. The current value is 8.7 points lower than the 79.0 value last year at this time, meaning Inventory Cost growth has fallen somewhat in the past year
Inventory Levels and Inventory Costs continue to grow, and inventory costs continue to grow. This could be related to the fact that warehousing capacity has decreased slightly or not grown significantly in recent periods. Because inventory levels are continuing to increase, and warehousing capacity is decreasing, it seems quite likely costs will continue to rise.
Respondents expect inventory costs will be 75.9 one year from now, up significantly (+10.0) from July’s future prediction. Respondents clearly expect inventory costs to continue to be high for the next 12 months.
Warehousing Capacity
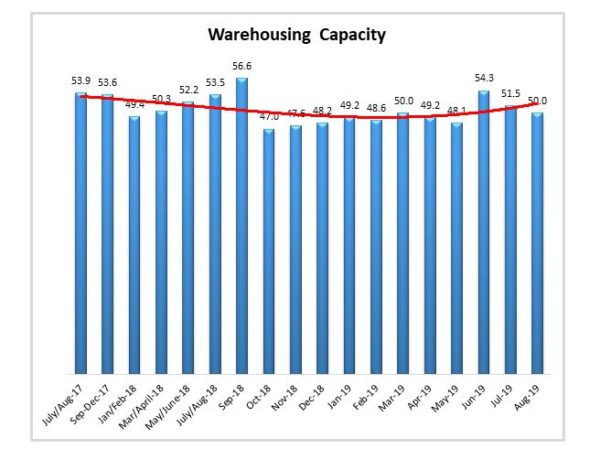
The Warehousing Capacity Index registered 50 percent in August 2019. This represents a modest decline of 1.5 points from the July 2019 reading and a 3.5 point decrease from the reading one year ago. Also of note, is that this reflects a third month in a row where there is a decline in the growth rate of capacity. Further to this point, the value of 50 indicates that this measure is neither growing nor contracting.
Looking forward at the next 12 months, the predicted Warehousing Capacity index is 58.2, which is up slightly (+2.0) from July’s future prediction.
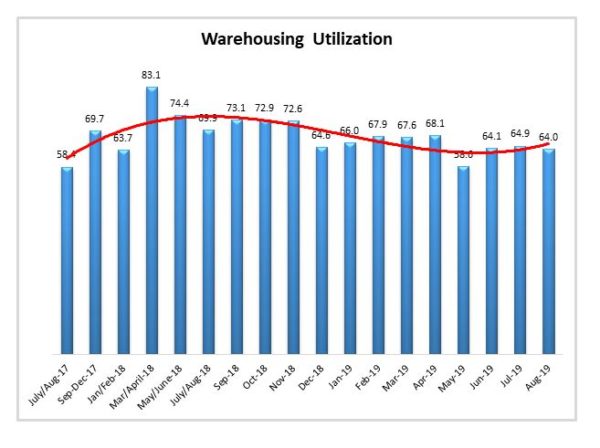
Warehousing Utilization
The Warehousing Utilization Index registered 64.0 percent in August 2019. This represents a slight decrease of .9 percentage points, and 5.9 points down from the July/Aug 2018 reading of 69.9. This reading accentuates previous indications that there may be a shift in the market, particularly when viewed in light of the warehousing capacity reading above. Though it is increasing, the slight contraction in the utilization of warehousing, may suggest a tightening in the warehousing space.
Looking forward at the next 12 months, the predicted Warehousing Utilization index is 71.1, up slightly (+1.7) from June’s future prediction, indicating that firms anticipate utilizing existing warehouse capacity consistently over the next year.
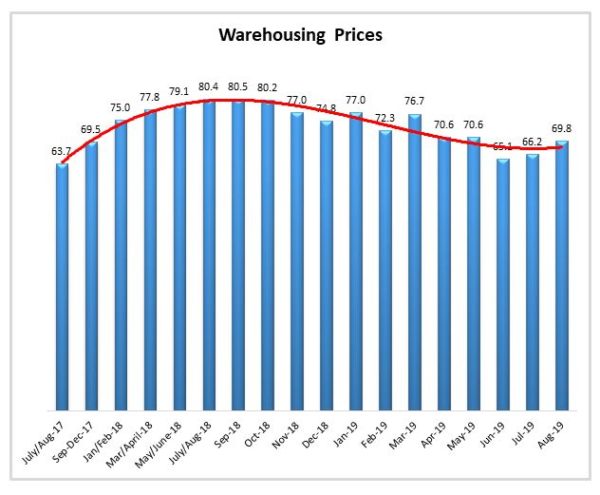
Warehousing Prices
Warehousing Prices Index registered 69.8 percent in August 2019. This is up 3.6 points from the July reading of 66.2. This reading is sharply down over 10.6 points from one year ago. Taken together, given the flat warehousing capacity, the increased rate in utilization, this continued rebound in the rate of price growth suggests that the market is continuing to respond to previous pressure in the warehousing utilization rates through price augmentation.
Looking forward at the next 12 months, the predicted Warehousing Prices index is 73.8, down (-1.2) from July’s future prediction. This indicates that firms are expecting an increase growth in Warehouse Prices over the next 12 months.
Transportation Capacity
The Transportation Capacity Index registered 64.8 percent in August 2019. This is an increase of 2.1 percentage points from the July reading of 62.7. This is the first increase in the Transportation Capacity Index since the historical high registered in April 2019. This month’s index score is up significantly from a year ago when it was contracting at a rate of 38.4.
It should also be noted the data indicates a score of 57.1 percent for the next year. This is consistent with the current reading and is up slightly (0.8) relative to June’s future expectations.
![]()
Transportation Utilization
The Transportation Utilization Index registered 55.1 percent in August 2019. This is an increase of 1.9 percentage points from the July reading of 53.2 and constitutes the second consecutive increase from the record low registered in June 2019. This is down 15.9 points from the same period I 2018 and is close to the benchmark level of 50 that denotes the inflection point from growth to decline.
Our future Transportation Utilization Index indicates a 64.3 percent level for the next 12 months. which is up significantly (+5.6) from future expectations from July.
![]()
Transportation Prices
The Transportation Prices Index registered 48.9 percent in August 2019. This is a .3 percent decrease from the July 2019 transportation prices reading of 49.2. The 48.9 reading is slightly below the critical 50 percent that separates growth and decline. This is down 48.9 points from last August’s reading of 92.7.
The future expectations for transportation prices are at 66.7 indicating modest growth over the next 12 months. This is up (+5.2) from July’s prediction.
![]()
About This Report
The data presented herein are obtained from a survey of logistics supply executives based on information they have collected within their respective organizations. LMI® makes no representation, other than that stated within this release, regarding the individual company data collection procedures. The data should be compared to all other economic data sources when used in decision-making.