- Growth is INCREASING AT AN INCREASING RATE for: Warehousing Capacity, Warehousing Prices, Transportation Utilization, and Transportation Prices
- Growth is INCREASING AT A DECREASING RATE for: Inventory Costs
- Inventory Levels, Warehousing Utilization, and Transportation Capacity are CONTRACTING
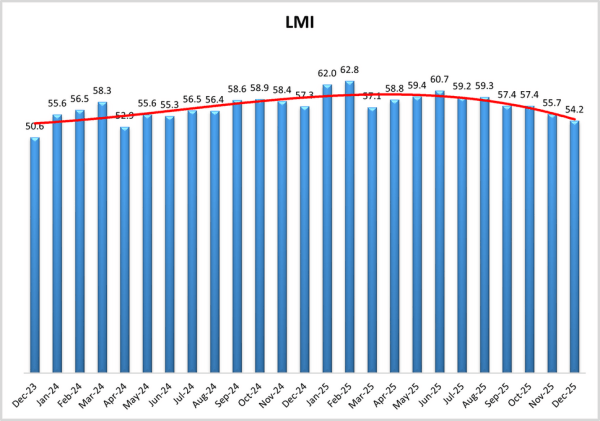
The December Logistics Manager’s Index reads in at 54.2, down (-1.5) from November’s reading of 55.7. This is the lowest rate of expansion since April of 2024. As was the case last month, the majority of the downward pressure comes from inventory and warehousing markets. This was led by a downward shift (-17.4) into extreme contraction at 35.1 for Inventory Levels. This led to Inventory Cost expansion slowing (-8.1) to 62.9. At the same time, Warehousing Capacity increased (+6.4) to 61.2, and Warehousing Utilization hit a second consecutive all-time low, decreasing (-4.7) to 42.9.
All of these downward movements are due to firms continuing to move inventory downstream towards consumers, providing a final wave of relief to those who had been holding unprecedented levels of inventory throughout 2025. This downstream push catalyzed transportation metrics, with Transportation Capacity (-13.1) moving back to contraction at 36.9 in a move that carriers have been waiting on for nearly three years. The contraction in available capacity pushed Transportation Prices up (+1.8) to 66.7, which is the highest reading for this metric since January and the initial inventory pull-forward that started the year
Researchers at Arizona State University, Colorado State University, Florida Atlantic University, Rutgers University, and the University of Nevada, Reno, in conjunction with the Council of Supply Chain Management Professionals (CSCMP), issued this report today.
Results Overview
The LMI score is a combination of eight unique components that make up the logistics industry, including: Inventory Levels and Costs, Warehousing Capacity, Utilization, and Prices, and Transportation Capacity, Utilization, and Prices. The LMI is calculated using a diffusion index: readings above 50.0 indicate that logistics is expanding; readings below 50.0 indicate a shrinking logistics industry. The latest LMI results summarize responses from supply chain professionals collected in December 2025.
The December LMI read at 54.2, down (-1.5) from November’s 55.7. This is the lowest reading since April 2024 and the tenth consecutive reading below the all-time overall average of 61.4. In a repeat of what we saw in October, the rate of expansion was faster in the second half of the month, rising from contraction at 48.2 in the first half of December to 54.9 in the second half. The contraction in the first half of December was not indicative of slowness in the logistics industry. Instead, it was likely a product of the rapid holiday rundown of excess inventory. Evidence of this lies in the expansion of transportation metrics, which suggest that firms were pushing inventories to consumers as quickly as possible.
The reason for this push was strong consumer spending throughout the holiday season. Card companies Mastercard and Visa both report increases in U.S. holiday spending, with 3.9% and 4.2%, respectively [1]. Consumers went for value throughout the holiday shopping season, with more secondhand goods purchased in 2025 than in previous years[2]. Analysts warn that, as in 2024, a significant volume of spending may have been subsidized by “buy now, pay later” loans.
Analysts at KBV estimate that new private-credit funding deals can now cover $140 billion in consumer lending, up significantly from $10 billion a year ago[3]. LendingTree reports that 37% of Americans used debt for holiday shopping this year, taking an average of $1,223 per person, up from $1,181 in 2024 [4]. Despite increased holiday shopping, seasonal retail hiring was down in 2025. The 365,000 seasonal workers hired in 2025, down 80,000 from 2024 and the lowest number in several years[5].
The strong spending came despite the Conference Board’s Consumer Confidence Index dipping 3.8 points in December to 89.1. This was driven by declines in four of the five component metrics; one of these, “Family Expected Financial Situation,” turned negative for the first time since July of 2022, at the height of inflation. At the same time, the University of Michigan reported a slight uptick (+1.9) to 52.9 in December. This came on the back of a decrease in expectations for future inflation to 4.2%, the lowest in 11 months. While this does show improvement over November, the overall reading is down 28.5% from the same time a year ago[6].
The dissonance between consumer spending and consumer sentiment has been a running theme through 2025. For instance, U.S. GDP rose 4.3% in Q3, the fastest rate of expansion since Q3 2023. The expansion came on the back of stronger-than-expected consumer spending. However, there is evidence that a disproportionate level of spending came from top earners, partially explaining the divergence in sentiment and spending, as some consumers benefit more in the ongoing “K-shaped” economy[7]. GDP was also pushed up by a discrepancy between imports and exports, which was partially driven by the unseasonal slowdown in imports we observed in September[8].
The confusion is being reflected at the policy level. The U.S. Federal Reserve reduced the key interest rate by a quarter point at its mid-December meeting. This cut brings the key rate down to 3.6%, the lowest in three years. Afterwards, Chairman Powell stated that after this cut, the Fed will wait to see how things play out before making another move. However, this sentiment may not be shared by the board. According to minutes released by the Fed, “many participants judged that further downward adjustments… would likely be appropriate”[9].
Even this latest cut was a closer call than usual as three governors – the most in six years – dissented on the cut. Two of these voted to keep the rate steady, while another voted for a more extreme half-point cut[10]. The final direction of this decision will be at least partially determined by changes in the job market. Initial unemployment claims fell to 199,000 in the last week of December, down from 215,000 the week before. While unemployment claims can be distorted by shorter holiday weeks, this is a move in the right direction [11]. We will learn more about overall employment trends when the December jobs report is released later this week.
There continues to be cross pressures in the manufacturing and global trade that provide the volumes that feed the logistics industry. The Purchasing Managers’ Index read in at 51.8 in December, down slightly (-0.4) from November and marking the slowest rate of growth in the ongoing five-month expansion[12]. Despite the U.S. import volume contracting 8% in 2025, global container volumes are up 2.1% due to the expansion of imports into Africa, the Middle East, India, and Latin America – some of which is driven by redirected Chinese products no longer moving to the U.S.[13].
In November, Chinese exports to the U.S. were down 29% year-over-year, reflecting this new world order and leading to Chinese Premier Li Qiang to declare that higher tariffs have dealt a “severe blow” to the global economy[14]. Interestingly, on January 1st, the White House walked back the tariffs set to take effect that day on items like cabinets, couches, and other furniture [15]. Despite the ongoing tariffs, Chinese factory activity expanded very slightly to 50.1 in December. This is the first expansion in eight months and likely reflects some rushed holiday orders.
Despite this increase in orders, Chinese credit research firm RatingDog states that new exports and manufacturing industry hiring contracted slightly, citing only “marginal” improvement in the manufacturing sector that they do not expect to be sustainable, particularly as many smaller factories are currently reporting contraction[16]. The “k-shaped” economy that the U.S. has been dealing with may be manifesting in China as well. In addition to contraction among smaller manufacturers, Chinese consumers have reported low disposable income[17] – something that could make China’s transition to a consumption- and services-based economy more difficult.
Whatever the cross-signals in the global economy, it cannot be argued that U.S. consumer spending was robust in Q4. Movements in inventories partially demonstrated this. Inventory Levels read 35.1 in December, the lowest in the index’s history. The 17.4-point reduction from November’s reading of 52.5 to December’s 35.1 is the most significant month-to-month movement in the history of this metric. The contraction in Inventory Levels was most pronounced early in December, reading in at 28.2, before the rate of contraction slowed to 42.9.
Even with the contraction in inventory volumes, Inventory Costs continued their run of price increases in December, albeit at a slower rate (-8.0) to 62.9. Inventory Costs also saw a significant shift over the month, moving from a slight expansion at 54.3 early in December to a much more robust 71.4 later in the month. It is another signal that the inventory rundown in December was due to high consumer sales (much of which included expensive last-mile delivery), and that Inventory Costs continued to expand so robustly even as we saw Inventory Levels drop at their fastest rate ever.
Beyond the Q4 sales, we have observed that Inventory Costs outpacing Inventory levels has been a trend throughout the year. This is partly due to higher tariffs. The Customs and Border Protection (CBP) agency estimates that the U.S. has collected over $200 billion in tariffs newly deployed in 2025[18]. We also see that since the removal of the de minimis exception in August, U.S. imports valued at less than the $800 threshold have decreased by 54% according to the Universal Postal Union[19].
Respondents expect the Inventory Levels/Inventory Costs dynamic to continue in 2026, predicting mild expansion (59.0) for Inventory Levels and robust expansion (72.1) for Inventory Costs. This is particularly pronounced at the retail level as Downstream respondents predict keeping Inventory Levels very lean at 50.0, while still paying high Inventory Costs at 73.8. At the same time, their Upstream counterparts predict that Inventory Levels will be slightly higher at 63.0, with associated expansion in Inventory Costs at 71.4.
The discrepancy in predictions for Upstream and Downstream Inventory Levels likely reflects larger retailers looking to keep inventories low – potentially by pushing them upstream – to improve cash flow and avoid tariff-related costs for as long as possible. It is unclear if smaller Upstream firms will be able to absorb the same proportion of the expenses in 2026. Many smaller firms have had to take additional loans to cover the combination of increased tariffs and lower demand.
Due to the cash flow problems these issues have caused, many firms have reported taking high-interest loans to keep their businesses afloat [20]. Despite this, analysts believe that some retailers are well-positioned for 2026, specifically citing discount stores like Ross and large retailers like Amazon and Walmart, who can leverage their size to keep prices low for what is likely to be a cost-conscious consumer base. It is also possible that higher spenders will make up an even larger share of retail spending next year, as they will benefit proportionally more from additional tax refunds [21]. Although it is worth noting that retailers may face challenges as we advance, the increased debt used for 2025 holiday shopping may take longer than usual to pay down, potentially slowing consumer spending early in 2026[22].
The inventory drawdown is reflected in our warehousing metrics. This is led by Warehousing Utilization, which dropped (-4.7) to 42.9 – marking the second consecutive month this metric has reached an all-time low. This new nadir was driven mainly by movements early in December, when it contracted at a 37.5% rate. Utilization contracted later in the month as well, but at the more moderate rate of 48.6. The drop in utilization is reflected in the uptick (+6.3) in available Warehousing Capacity, which rose to 61.2 and is the fastest rate of expansion for this metric since July 2023, the height of the previous freight recession and inventory drawdown. However, whereas slow, static inventories drove that prior peak, this one was driven by dynamic downstream inventory movements. Looking at broader statistics, U.S. warehousing vacancy was up to 7.6% in Q3. This exceeds the pre-pandemic average of 7.1% and provides further evidence that the construction cycle that kicked off at the start of the decade is slowing down.
There is still ongoing construction; however, 3PLs in particular are shifting towards larger facilities optimized for automation. The softness in the warehousing market is due to a combination of retailers and wholesalers clearing inventory backlogs, as well as the ongoing slowdown in manufacturing [23]. This trend could continue as U.S. manufacturers reported a pullback on orders for components and raw materials in November, with purchasing activity hitting its lowest level since May[24]. Analysts (and LMI respondents) predict that vacancy will decline in 2026 as tariff normalization provides supply chains with greater certainty regarding infrastructure decisions [25].
Despite the softness in the other warehousing metrics, Warehousing Prices continued to expand (+3.3) at a rate of 66.2. This was driven more by Upstream (68.8) than by Downstream (59.5) respondents – likely reflecting mass destocking at the retail level. Warehousing Price is the one metric that has never contracted in the history of the LMI. Whether inventories are up or down, the cost of storing them continues to grow. This appears to be the case in the near future as well, with respondents predicting a 74.7% expansion over the next 12 months. This suggests that, even with softening capacity, we will continue to see rising costs in warehousing markets.
As was the case in November, softness in inventories and warehousing is countered by increased activity in the transportation sector. Transportation Capacity is down (-13.1) to 36.9, which is its lowest level since October 2021. This is also the first time this metric has contracted since March of 2022, which was the start of the previous prolonged freight recession. This contraction is consistent across every respondent group. There is some conjecture that the decline in capacity is due to English-language crackdowns. Transportation Secretary Sean Duffy stated that 9,500 truck drivers have been pulled off the road due to failing English-language proficiency tests[26]. While that is a significant impact, it is worth noting that the Bureau of Labor Statistics estimates that there are just over 2 million heavy and tractor-trailer truck drivers in the U.S.[27] So it is more likely that the decrease in capacity is due to the proliferation of holiday-season deliveries.
Transportation metrics had been stunted by the static buildup of inventories throughout most of 2025. However, from the second half of October through the end of the year, they picked up significantly, consistent with seasonality. Holiday shopping drove FreightWaves’ truckload rejection index to almost 9.5% in mid-December, up from the same time last year[28]. The tightening of available capacity led to higher prices as well, with truckload spot rates rising 8% from November 19th to December 4th[29]. U.S. consumers spent $187.3 billion online between November 1st and December 12th, up 6.1% year-over-year and likely accounting for at least some of the positive momentum in the freight market. It is also worth noting that e-commerce purchases often slow sharply in the week before Christmas, which may have taken some of the pressure off last-mile delivery later in the month [30].
This is reflected in expansion in both Transportation Utilization (+6.7) at 58.2 and Transportation Prices (+1.7) at 66.7. There is an interesting divergence in Transportation Utilization, which contracted slightly (47.6) Downstream but expanded robustly (62.1) Upstream. This is likely due to retailers having largely replenished their holiday inventories from October to early December and then more or less “standing pat” (except for last-mile delivery).
The higher Transportation Prices come despite U.S. diesel prices averaging $3.50 per gallon in the last reading of 2025. This is down 4.4 cents per gallon from a week earlier and 0.3 cents from the same time a year ago [31]. After 10 consecutive weeks of decline, during which prices dropped 36.4 cents per gallon, diesel prices essentially ended the year where they started[32]. It is not clear how the late-breaking U.S. military action in Venezuela, which sits on one of the world’s largest reserves of petroleum, will impact this. Beyond the fact that Transportation Prices are now expanding at their fastest rate since January, it is also notable that this metric is 29.8 points above Transportation Capacity, the most significant positive freight inversion since March of 2022, suggesting that December’s freight market was the strongest in over three years. It will be interesting to see whether the upswing continues into 2026.
Respondents were asked to predict movement in the overall LMI and individual metrics 12 months from now. Respondent predictions for the overall index are 65.3, which is up (+2.4) from November’s future prediction of 62.9, and would represent a slightly faster rate of growth than the all-time average of 61.3. Respondents are once again predicting more moderate expansion in Inventory Levels at 59.0 (+2.3) with much higher expected increases in associate Inventory Costs at 72.1 (+0.4). We see similar dynamics in warehousing, with Warehousing Capacity expected to expand moderately to 55.9 (-2.3), while Warehousing Prices are expected to continue growing significantly to 74.7 (-0.3).
This is consistent with recent predictions that inventories and storage will be relatively expensive in 2026, leading firms to keep inventories lean to improve cash flow. This is particularly true for Downstream respondents who predict “no movement” in Inventory Levels at 50.0. To facilitate this, respondents (particularly those Upstream) anticipate a significant uptick in transportation metrics, predicting a tightening of Transportation Capacity to 40.5 (-6.5) and associated increases in the expansion rates of Transportation Utilization to 70.3 (+3.9) and Transportation Prices to 76.8 (-1.6). If these predictions hold, it would mark a significant shift in transportation markets. The key to this prediction will be consumer demand holding steady despite potential price increases. Consumer demand was more substantial than anticipated throughout 2025, so there is a chance that this – and the associated turnaround in the freight market – could prove to be true.

We observe differences in feedback from Upstream (blue bars) and Downstream (orange bars) respondents in December. Upstream firms reported significantly more expansion in the overall index at 53.1, while Downstream reported contraction at 47.2. Upstream is essentially unchanged (-0.4) from November, but Downstream reported a significant drop off (-11.9). This is due to the massive shift in Downstream Inventory Levels, which dropped an astounding -31.7 points from 65.8 to 34.1. Unlike Upstream firms, Downstream respondents let inventories run lean most of the year, then build them up quickly in October and November and sell through most of it in December. While it was tough on smaller Upstream firms, this speaks to the effectiveness of Downstream inventory strategies in 2025.


We observe a few notable differences in responses collected in early (gold bars) versus late (green bars) December. Inventory Levels read in at 28.2 in the first half of the month – the lowest reading ever for this metric – before rising to 42.9 later in December. The shift in volumes translated to costs, with Inventory Costs going from 54.3 early to 71.4 later. We also saw an impact on Warehousing Utilization, which contracted at 37.5 (the fastest rate ever), then slowed to 48.6 and showed close to no movement in late December. Taken together, this suggests an unprecedented inventory drawdown over the nine years of the LMI. This is likely due to a combination of record inventory levels early this year and record holiday sales in Q4. We also often see holiday sales shift from more ecommerce to more in-person the week before Christmas (which is our early/late cutoff), which might explain some of the shifts in logistics activity.


The index scores for each of the eight components of the Logistics Managers’ Index, as well as the overall index score, are presented in the table below. The rate of expansion for the overall index is 54.2, which is down (-1.4) from November’s reading. As was the case last month, the majority of the downward pressure comes from inventory and warehousing markets. This was led by a downward shift (-17.4) into extreme contraction at 35.1 for Inventory Levels.

This period, along with prior readings from the last two years of the LMI, is presented tin the table below:

The December Logistics Manager’s Index reads in at 54.2, which is down (-1.4) from November’s reading of 55.7 and represents the lowest reading for the overall index since April of 2024. However, this reading does mark two consecutive years of expansion in the overall index. This decline was driven by the sharp contraction in Inventory Levels (35.1) and continued pullback in Warehousing Utilization (42.9). It is balanced by contraction in Transportation Capacity (36.9) and expansion in Transportation Prices (66.7). The 29.8-point gap between these two metrics is the most significant positive freight inversion since March 2022. The overall index came in significantly higher in Upstream (53.1) than in Downstream (47.2), indicating a state of mild contraction. There was also a pickup in the overall index as December went on, moving from mild contraction at 48.2 to expansion at 54.9. It is worth noting that the contraction in early December was not indicative of slowness per se; it was most likely a function of a historic inventory drawdown.
When asked to predict what conditions will be over the next 12 months, respondents foresee a rate of expansion of 65.3, which is up (+2.4) from November’s future prediction of 62.9, and would be just above the all-time average of 61.3. Respondent expectations vary across the supply chain, with Upstream respondents predicting an overall expansion of 65.1, and Downstream respondents predicting a slower (though still notable) rate of expansion of 57.8.

Inventory Levels
The Inventory Level index is 35.1, down (-17.4) from November’s 52.5. This is the lowest value ever for this index, by a significant margin. Previously, the lowest value was 41.9 in July 2023. Inventory Levels are 14.9 points lower than a year ago, and 9.2 points lower than two years ago at this time. Declining values in December are not uncommon, however, as firms work through the inventories they accumulated for the holiday sales season.
We saw decreasing inventory levels in December of 2019 and 2023. The years between 2020 and 2022 were all affected, to a greater or lesser extent, by the COVID pandemic. Upstream and downstream were relatively consistent. Upstream returned 35.6 and downstream returned 34.1. This is a marked difference from last month, when upstream returned a slight decrease at 46.3, while downstream returned 65.8, a difference of 19.4 points.
Predictions for future Inventory Level growth are 59.0, up (+2.3) from November’s prediction of 56.7, still suggesting an expectation for leaner inventories in 2025. Upstream respondents predict robust expansion at 63.0 while their Downstream counterparts look to keep things lean at 50.0. This is likely an attempt by retailers to replicate the success they had with delaying middle-mile inventory deliveries in 2025.

Inventory Costs
Inventory Costs are 62.9, down (-7.9) from November’s reading of 70.8. As seen above, Inventory Levels are 14.9 points lower than a year ago. And yet, the Inventory Cost index is 1.3 points higher than a year ago. Inventory Levels are 9.2 points lower than two years ago, and yet Inventory Costs are 7.1 points higher than two years ago. This gap is likely due to the increased costs of goods levied by tariffs and storage fees.
Upstream returned a value of 63.5, and Downstream returned a similar value, at 61.4. Both Upstream and Downstream are reporting higher inventory costs. The interesting thing is that Upstream reported significantly higher inventory costs (63.5), despite reporting lower inventory levels (35.6). The Inventory Cost index is 27.9 points higher than the Inventory Level index. For Downstream, the story is very similar. The Inventory Cost (61.4) index is much higher than the Inventory Level (34.1) index, a difference of 27.3. Early respondents reported a small increase in Inventory Costs (54.3), while later respondents reported a larger increase (71.4). This is even though early respondents reported an Inventory Level of 28.2, and later respondents reported 42.9.
Predictions for future Inventory Cost growth is 72.1, up (+0.4) from November’s future prediction of 71.7, suggesting that costs will continue to increase significantly over the next 12 months. Upstream respondents predict growth of 71.4, and Downstream respondents predict expansion of 73.8. Respondents clearly expect Inventory Costs to continue outpacing Inventory Levels, particularly Downstream, where they predict Inventory Levels to hold steady at 50.0.

Warehousing Capacity
The reading for Warehousing Capacity for December 2025 was 61.2 points, up 6.4 points from the month prior. This reading is up 4.2 points from one year ago and 6.1 points from two years ago. In addition, there was a 5.2-point split between Upstream (59.8) and Downstream (65.0), which was not statistically significant (p>.1), but notable as the Upstream value remained in expansionary territory from its previous retreat into contraction. Comparing small (<999 employees) and large (>999 employees), we see that these values are nearly identical at 60.5 and 60.9. This .5-point split was not statistically significant (p >.1).
Finally, exploring the future predictions for Warehousing Capacity, respondents predict mild expansion of 55.9, down (-2.3) from November’s prediction of 58.2. Downstream is expected to sustain expansionary growth with a value of 64.3, with Upstream’s growth also expected to continue expanding, with the predicted value one year out registering at 52.7 (though with decreased intensity from last month’s registered values). This 11.6-point difference was not statistically significant (p>.1).

Warehousing Utilization
Continuing its rather precipitous decline, the Warehousing Utilization index registered 42.9 points in December 2025, a 4.6-point decline from the prior month and the third month in a row of declining capacity levels, with two months in contraction. This reading is down a dramatic 18.8 points from the reading one year ago and 17.9 points from the reading two years ago. In addition, there was a 6.5-point split between Upstream (44.6) and Downstream (38.1), where both values are now squarely in contractionary territory. Still, this difference was also not statistically significant (p>.1). Comparing the differences between small (<999 employees) and large (>999) firms, we see that these values are 38.4 and 47.0, with both small and large firms clearly retreating into contraction. This 8.6-point split was not statistically significant (p >.1).
Finally, regarding future predictions for Warehousing Utilization, respondents predict expansion at 65.6, up (+4.9) from November’s 60.7. Expectations for growth are consistent across the supply chain, with future Upstream expectations (68.8) being predicted to grow slowly than Downstream expectations (57.1). While the 11.6-point difference is notable, it is not statistically significant (p>.1).

Warehousing Prices
The warehousing pricing index is exhibiting a recurring “see-saw” pattern, with pricing increasing by 3.3 points to 66.2 for December 2025. This reading is down 1.8 points from one year ago and 7 points from two years ago. In addition, there was a 9.2 -point split between Upstream (68.8) and Downstream (59.5) which was marginally statistically significant (p<.1). Comparing the differences between small (<999 employees) and large (>999) employees we see that these values are63.6 and 68.8 reflecting a 5.1 -point difference between the two which was not statistically significant (p >.1).
Finally, looking ahead to Warehouse Price, respondents predict robust expansion at 74.7, down slightly (-0.3) from November’s 75.0. Expectations across the supply chain are elevated, with future Upstream expectations (76.8) expected to increase faster than Downstream expectations (69.0). This month’s 7.7-point difference was not statistically significant (p>.1).

The Transportation Capacity Index collapsed 13.1 points to 36.9 percent in December 2025. With this fourth consecutive drop, the Transportation Capacity index moved decisively into contraction territory. Last time the Transportation Capacity was at this level was in the fall of 2021. While the Upstream Transportation Capacity index is at 34.7, the Downstream index is slightly higher at 42.9, but the difference is not statistically significant. Hence, it can be concluded that the contraction in Transportation Capacity is spread across both Upstream and Downstream supply chains. The future Transportation Capacity index also decreased by 6.5 points, to 40.5, indicating contraction over the next 12 months. While the future Upstream index is at 36.2, the Downstream Transportation Capacity index is at 52.4, and the difference is statistically significant. As such, the expectations of future contraction are prevalent in Upstream supply chains, while Downstream supply chains expect slightly expanding Transportation Capacity.

The Transportation Utilization Index jumped 6.7 points, indicating 58.2 in December 2025. The Downstream Transportation Utilization Index is now at 47.6, while the Upstream index indicates 62.1, and the difference is statistically significant. As Downstream utilization decreases, respondents indicate increased Upstream utilization.
The future Transportation Utilization Index decreased by 3.9 points from last month, indicating 70.3 points for the next 12 months. The future Upstream Transportation Utilization index is at 75.9. The Downstream index is at 54.8; the difference is statistically significant, indicating that expectations of increased utilization are stronger Upstream than Downstream.

The Transportation Prices Index increased another 1.8 points from the previous reading and recorded 66.7 in December 2025. With this increase, the index is now only 0.1 points below the level indicated one year ago. While the Upstream Transportation Prices Index is at 69.5, the Downstream index is at 59.1, but the difference is not statistically significant. As such, it can be concluded that inflationary pressure on Transportation Prices is being felt across both Upstream and Downstream supply chains. The future index for Transportation Prices decreased slightly from last month, dropping 1.6 points and not indicating a 76.8 level for the following year. The Upstream future Transportation Prices index is at 80.,8 while the Downstream Transportation Prices index is at 65.9, and the difference is statistically significant. Therefore, the predicted inflation in Transportation Prices is greater Upstream than Downstream.

The data presented herein are obtained from a survey of logistics supply executives based on information they have collected within their respective organizations. LMI® makes no representation, other than that stated within this release, regarding the individual company data collection procedures. The data should be compared to all other economic data sources when used in decision-making.
Data for the Logistics Manager’s Index is collected in a monthly survey of leading logistics professionals. The respondents are CSCMP members at the director level or above. Upper-level managers are preferable as they are more likely to have macro-level information on trends in Inventory, Warehousing, and Transportation within their firm. Data is also collected from subscribers to both DC Velocity and Supply Chain Exchange. Respondents hail from firms operating on all six continents, with the majority working at firms with annual revenues over a billion dollars. The industries represented in this respondent pool include, but are not limited to: Apparel, Automotive, Consumer Goods, Electronics, Food & Drug, Home Furnishings, Logistics, Shipping & Transportation, and Warehousing.
Respondents are asked to identify the monthly change across each of the eight metrics collected in this survey (Inventory Levels, Inventory Costs, Warehousing Capacity, Warehousing Utilization, Warehousing Prices, Transportation Capacity, Transportation Utilization, and Transportation Prices). In addition, they also forecast future trends for each metric over the next 12 months. The raw data is then analyzed using a diffusion index. Diffusion Indexes measure how widely something is distributed within a group. The Bureau of Labor Statistics has been using a diffusion index for the Current Employment Statistics program since 1974, and the Institute for Supply Management (ISM) has been using a diffusion index to compute the Purchasing Managers Index since 1948. The ISM Index of New Orders is considered a Leading Economic Indicator.We compute the Diffusion Index as follows:
PD = Percentage of respondents saying the category is Declining,
PU = Percentage of respondents saying the category is Unchanged,
PI = Percentage of respondents saying the category is increasing,
Diffusion Index = 0.0 * PD + 0.5 * PU + 1.0 * PI
For example, if 25 say the category is declining, 38 say it is unchanged, and 37 say it is increasing, we would calculate an index value of 0*0.25 + 0.5*0.38 + 1.0*0.37 = 0 + 0.19 + 0.37 = 0.56, and the index is growing overall. An index value above 0.5 indicates the category is increasing, a value below 0.5 indicates it is decreasing, and a value of 0.5 means the category is unchanged. When a full year’s worth of data has been collected, adjustments will be made for seasonal factors as well.