Growth is INCREASING AT AN INCREASING RATE for: Warehousing Capacity, Warehousing Prices, Transportation Capacity, Transportation Utilization, and Transportation Prices.
Growth is INCREASING AT A DECREASING RATE for: Inventory Levels, Inventory Costs, and Warehousing Utilization,
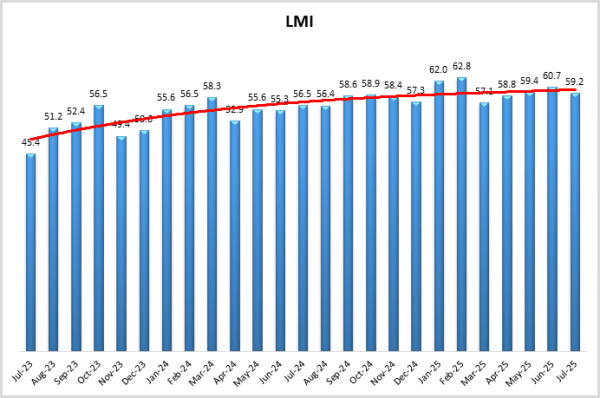
The July Logistics Manager’s Index reads in at 59.2, down (-1.5) from June’s reading of 60.7, and very close to May’s reading of 59.4. The movement back above 60.0 marks only the third time since July of 2022. The increase in the overall slowdown in expansion is driven by a decreased rate of expansion for Inventory Costs, which are down (-9.0) to 71.9. While this is notably slower than June’s rate of expansion of 80.9, it still represents a significant rate of expansion Inventory Costs. Cost growth has likely slowed due to the dip (-4.2) in the expansion of Inventory Levels which came in at a more modes 55.2 in July. This led directly to Warehousing Capacity moving (+3.3) back into expansion territory at 51.1. It is worth noting that all of these shifts are primarily driven by either our Upstream or smaller (<999 employees) respondents. Larger firms and Downstream retailers are actually reporting contracting inventories, more capacity, and lower price expansion as they attempt to maintain JIT inventory management strategies to avoid higher costs. Transportation Utilization was up (+6.6) to 59.5, but Transportation Capacity (+0.2 to 52.6) and Transportation Prices (+1.0 to 63.0) remained fairly consistent with readings from June, as what had been a slow freight recovery remains in the holding pattern that we have observed through much of 2025.
Researchers at Arizona State University, Colorado State University, Florida Atlantic University, Rutgers University, and the University of Nevada, Reno, and in conjunction with the Council of Supply Chain Management Professionals (CSCMP) issued this report today.
Results Overview
The LMI score is a combination of eight unique components that make up the logistics industry, including: Inventory Levels and Costs, Warehousing Capacity, Utilization, and Prices, and Transportation Capacity, Utilization, and Prices. The LMI is calculated using a diffusion index, in which any reading above 50.0 indicates that logistics is expanding; a reading below 50.0 is indicative of a shrinking logistics industry. The latest results of the LMI summarize the responses of supply chain professionals collected in July 2025.
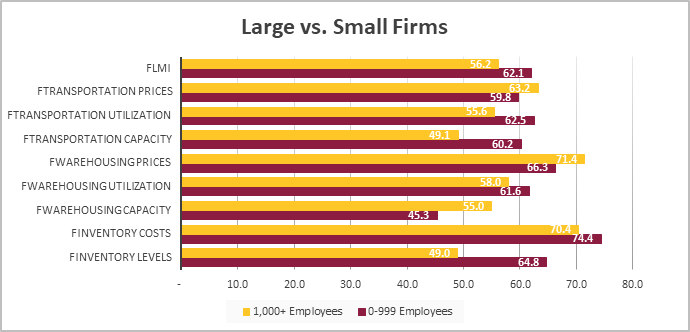
The LMI read in at 59.2 in July, down (-1.5) from June’s reading of 60.7. This is just below the all-time average of 61.5 for the overall index and represents a moderate rate of expansion. Continuing the trend we have observed over the last three months, logistics expansion is being disproportionately driven by smaller firms, who reported an overall index of 62.1, which is statistically significantly higher than the 56.2 that was reported by our larger respondents. This continued disparity is largely driven by higher inventories and tighter capacity for smaller firms. Many of these smaller firms represent the “middle-mile” of supply chains, sitting between ports and manufacturers upstream and retail customers downstream. They are largely distributors, wholesalers, and logistics service providers. This is corroborated by a statement from Eric Hoplin, president and CEO of the National Association of Wholesaler-Distributors that the middle-mile entities like wholesalers and distributors will be hit the hardest by tariffs – with some analysts estimating they will carry up to 50% of the cost[1]. Essentially, they are holding the high levels of inventory that were brought into the U.S. to avoid tariffs but have not been moved down to retailers yet. The expense of these inventories is high, but the idea is that they will act as buffers to the current uncertainty.
Unfortunately, uncertainty is still high as the tariff situation continues to be a fluid one. U.S. President Trump signed an order imposing new tariffs on 66 countries starting August 8th. This is a week later than had been announced on July y 9th (which itself was an announcement of a pushback), to give time for more countries to strike deals with the U.S. As of this writing, tariffs stand at 15% for the EU, 25% for India and Mexico (with a new 90-day negotiating period for the latter), 35% for Canada, 30% for China, 50% on Brazil, and 15% for Japan and South Korea[2]. There are also 40% tariffs on transshipments of Chinese goods passing through another country if they did not undergo “substantial transformation”. The exact threshold of “substantial transformation” has yet to be specified[3]. This is in addition to the flat tariffs on commodities such as steel, aluminum, and copper. Taken altogether, these announcements mean that the average U.S. tariffs is now 18.3%. This is a significant shift from their average of 2.3% before Trump re-took office[4]. This is the highest tariff rate U.S. consumers have faced since 1934[5]. The assertion of these tariffs is currently under review in Federal Courts, where litigants are asserting that the administration may have exceeded its authority to address emergency situations through trade regulations[6].
Markets were down sharply on August 1st as a result of the tariff announcements. The dip may have been somewhat tempered however by the weaker-than-expected job report, which investors are hoping may lead to interest rate cuts from the Federal Reserve[7]. The U.S. added 73,000 jobs in July, which was lower than anticipated. The previous two job reports were also revised down significantly, with May being revised down 125,000 positions to 19,000 jobs added, and June being revised down 133,000 positions to 14,000 added. That means that over the last three months, an average of 35,300 jobs have been added. For reference, the U.S. added an average of 186,000 jobs per month in 2024[8].
Digging more deeply into the jobs report and revisions, we see that when adjusting for seasonality, we lost 11,000 manufacturing positions in July. This comes after losing 15,000 in June and another 11,000 in May, meaning that the U.S. is down 37,000 seasonally-adjusted manufacturing jobs in the last three months[9]. Corroborating this is the reading of 48% in July’s manufacturing PMI. This is down (-1.0%) from June’s reading and the fifth straight month of contraction[10]. The struggle that U.S. manufacturing is currently having with the tariffs is two-fold:
1) Building up capacity takes time and resources. Since we keep going back and forth on the cost and implementation of tariffs, companies aren’t sure what is permanent and what is not. As such, they may be unwilling to make the capital expenditures that would be needed to set up domestic manufacturing. The International Chamber of Commerce (ICC) supports this, noting that the lack of detail in the tariff announcements have made it difficult for firms and their supply partners to quickly formulate the strategies need to deal with them effectively[11].
2) As they stand at the moment, tariffs disproportionately impact inputs, not finished goods. Ford Motor is an example of this, with company officials stating that they are actually at a disadvantage relative to competitors because they assemble 80% of their vehicles in the U.S. Their current structure means that they will pay more for the components (and likely for U.S. labor as well) needed to build vehicles themselves than they would if they were importing finished goods[12]. Finance chief Sherry Hourse noted that Ford paid more than $800 million in tariffs in Q2 due to tariffs[13]. Meanwhile, General Motors, who imports approximately half of their vehicles, reported a $1.1 billion decrease in net income – shaving 35% off of their profits – due to the increased cost of components from the tariffs. This loss comes despite their industry-leading expansion of a 12% sales gain to dealerships through the first half of the year[14].
The other major economic announcement in the last week of June was U.S. Q2 GDP. U.S. GDP increased by 3% in Q2, a shift away from the 0.5% decline in Q1. Nearly all of this shift can be explained by trade dynamics. In Q2 the U.S. had a positive trade balance – partly due to the “air pocket” in May when tariffs were elevated. net exports added 5.0% to GDP, while inventories – including the goods left over from the Q1 stock-up, subtracted 3.2%. Meanwhile, consumption was soft, adding less than 1%[15]. No matter how you slice it, it is a good thing when GDP goes up instead of down, but it will be important to keep an eye on inventories and trade movements in Q3 – particularly if they dip due to increased tariffs. One of the most important aspects of this – particularly for firms in the logistics industry looking to make capital expenditures – is how it will impact interest rates. The Federal Reserve voted to hold rates steady at their July meeting, citing uncertainty regarding tariffs. Two of the nine governors dissented, signaling that if some certainty were to be established regarding tariffs, that the board would be open to decreasing rates[16].
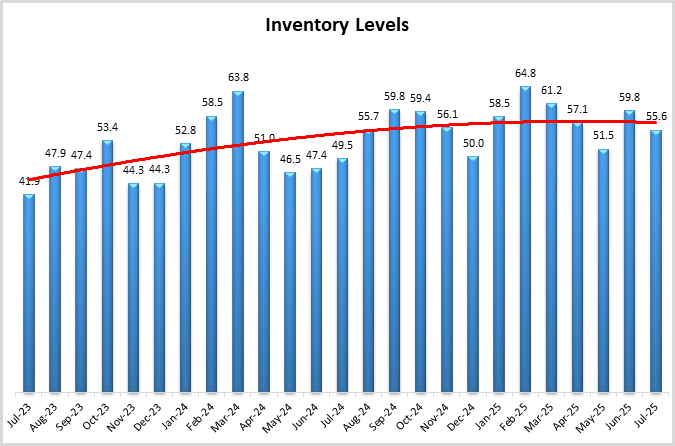
As mentioned above, inventories often act as a buffer, helping firms to deal with the swings associated with economic uncertainty. Inventory Levels expanded more slowly (-4.2) in July at a rate of 55.6. This moderated rate of expansion hides significant differences in inventory strategies at the different levels of the supply chain. The most drastic of these is that smaller (<999 employees) respondents reported rapidly expanding inventories at 64.8, while larger (1,000+ employees) reported mild contraction at 47.6. We observe similar dynamics with Upstream firms, who reported Inventory Level expansion at 58.5, contrasting with the contraction of 47.6 reported by Downstream firms. Despite the differences in rates of expansion, all of these groups report significant expansion above 70.0 in Inventory Costs.
Much of the Upstream inventory being held by smaller firms are recent imports. Shippers clearly took advantage of the extension of the tariff pause. Pre-extension, The Port of LA had been expecting a drop of 27.2% year-over-year at the end of July but instead saw an increase of 35.2% – a 62.4% increase. This comes on the heels of the busiest June ever at the Port of LA, which processed 892,340 TEUs in the month[17]. Interestingly, container volumes are expected to drop off again following the first week of August and the re-implementation of tariffs[18]. The is corroborated by the slowdown of East-West container rates (Shanghai to LA down 2% to $2,632 per 40 ft), at a time of the year when generally seasonality would be driving container prices up[19]. South East Asian manufacturers also reported their lowest level of sentiment since the pandemic five years ago, citing a lack of demand for their goods[20]. Conversely, traffic at smaller ports was down significantly over the same period. For instance, the Port of Oakland saw a 10.1% month-over-month, and 13% year-over-year decrease in June. The Port of Oakland has traditionally been a strong exporting port. Beyond ships not wanting to make the extra stop, this could bely a slowdown in some exports as well. Other “secondary” ports such as Jacksonville and New Orleans experienced similar slowdowns over the last few months[21]. There is some evidence of this in CMA CGM, the world’s third-largest container carrier, reported a 19.9% drop in EBITDA in the second quarter, with their revenue per container dropping by 1.2% year-over-year[22].
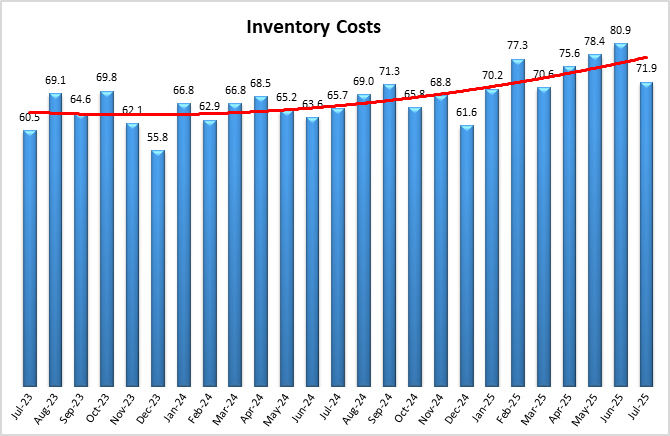
The flow of inventories going forward largely depends on the associated cost. The rate of expansion for Inventory Costs slowed (-9.0), but at 71.9 are still growing at a significant rate. Higher costs for inventories often eventually lead to higher prices for consumers. The University of Michigan’s Consumer Sentiment Index was up (+1.6) to 61.7 in July on the strength of increased consumer perceptions of current economic conditions (+4.9) and in spite of slightly lower (-0.70) expectations for future economic expansion. The reading of 61.7 is up from earlier in the Spring, but is still 7.1% down from the same time a year ago, reflecting uncertainty regarding both tariffs and potential inflation[23]. KPMG reported that consumer spending only rose by 0.1% in June[24], corroborating the notion of a cautious consumer. Proctor & Gamble corroborates this anecdotally, reported that consumers are buying smaller sizes and delaying purchases of their products to wait for potential sales, indicating they are “looking for value”[25].
That being said, consumers are still spending. Amazon Prime Day (which is now four days), drove $24.1 billion in spend (up 30.3%)[26]. It should be noted that the 30.3% increase came over 100% more time as the event went from two to four days. Prime Day has been a bellwether for holiday spending in the past. That being said, CEO Andy Jassy did warn that Amazon has burned through a significant amount of the inventory that was brought in pre-tariffs, and increased costs could lead to lower consumer demand and/or higher potential for stockouts[27]. So far spending in 2025 has been against the backdrop of moderate inflation. The PCE was up 2.6% in June (up 2.8% when stripping away food and energy)[28]. This is higher than the Fed’s preference of 2% inflation but is still lower rate of inflation than we saw through much of 2022. However, as firms work through their stores of inventory there is a strong possibility that prices could go up. The NRF reports that retailers are likely to increase prices in the coming months as tariffs increase. Smaller firms in particular are likely to have a more difficult time absorbing these costs without increasing prices[29].
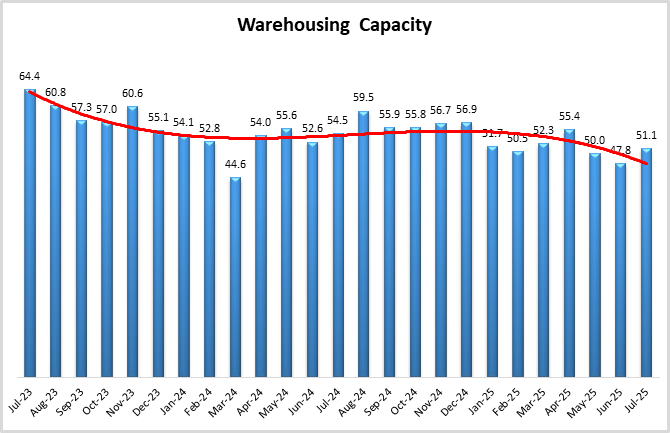
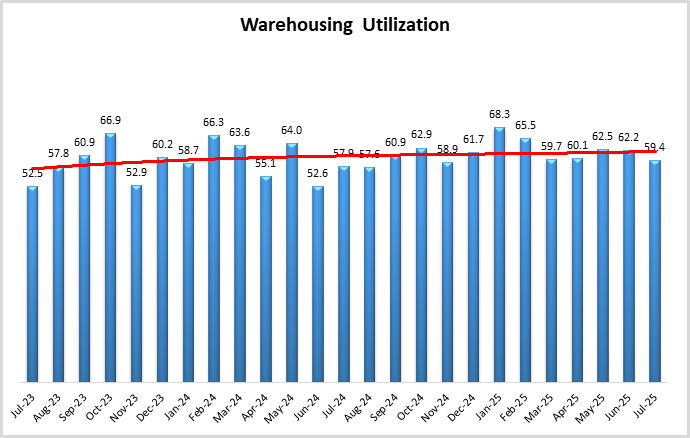
The warehousing space that firms have to hold these inventories continues to be tight, although there was some loosening (+3.3) in July as Warehousing Capacity went from slight contraction at 47.8 to mild expansion at 51.1. Unsurprisingly given what we saw with Inventory Levels, Warehousing Capacity is much tighter for smaller respondents (45.3) than larger respondents (55.0), and for Upstream respondents (48.6) than Downstream respondents (52.4). A similar split exits for Warehousing Utilization. The overall metric slowed (-2.8) to 59.4. However, Upstream firms that are tight on available capacity reported robust expansion at 62.0, which Downstream firms that are keeping inventories low reported contraction in their utilization of available space at 47.6. This juxtaposition may partially explain some of the contradictions that are currently characterizing the warehousing market. According to Cushman & Wakefield, average warehouse vacancy was up to 7.1% in the second quarter, which is the first time their measure has been above 7% since 2014. Their head of logistics and real estate Jason Tolliver believes that it is due to retailers paring back inventories due to the start-stop nature of tariffs impacting the normal flow of goods. This slowdown has impacted overall construction, which at 72 million new square feet of space is down 45% year-over-year[30]. Some of this is due to trade regulations. For instance, DSV announced that they would be “hitting pause” on investments in infrastructure along the U.S.-Mexico border. The international logistics giant had invested heavily in warehouses, rail yards, and truck terminals near the border over the last few years, citing the lack of growth potential given the current trade environment[31]. At the same time, Prologis put in over $900 million in new development starts in Q2. An additional explanation for this divide is that facilities built on spec are moving slowly, but demand for custom-built storage is high. We also see that some are renewing existing leases to “kick the can down the road” until more is known about the current economic situation[32].
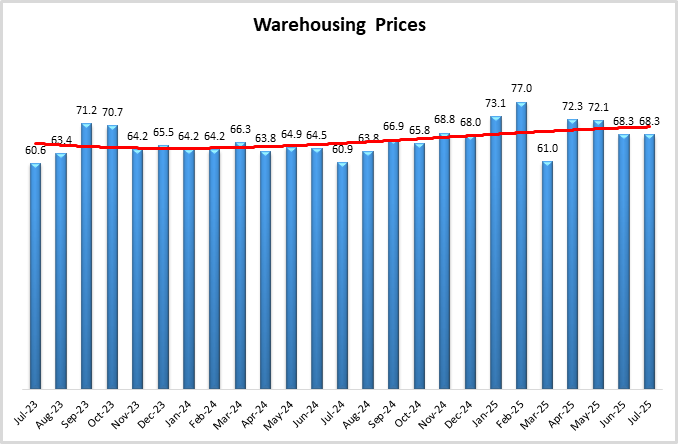
Regardless of the shifting rates of warehousing construction, we observe that prices continue to expand, holding steady at 68.3 which is a robust rate of expansion. This is fairly consistent across the board, with no major differences existing between Upstream and Downstream, or small and large firms. At a national level, Warehousing rents are up but the rate of change has softened. The average price for industrial space was up to $10.06 in Q2, only slightly up from the average of $9.99 in Q1 and $10.03 year-over-year.
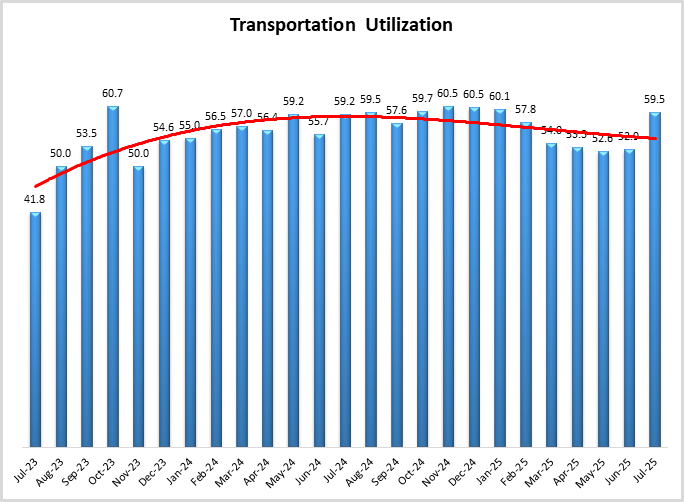
Transportation Utilization was the most significant mover in July, with its rate of expansion increasing (+6.6) to 59.5. This was primarily driven by Upstream firms, who reported robust expansion of 60.7, while Downstream reported no change at 50.0. There was little change overall for Transportation Capacity (+0.2) as it came in at 52.6. This metric has now registered soft rates of expansion, with every reading over the last 12 months coming in between 50.0 and 55.2. So long as this metric comes in above 50.0, it is unlikely that we will have a truly robust expansion in the freight market. It should be pointed out that Transportation Capacity actually did contract very slightly for larger firms at 49.1, while expanding for smaller firms at 60.2. This likely ties into the differences we saw with inventories. Essentially, larger firms are pursuing more JIT oriented strategies and are therefore more consistently utilizing transportation. Some evidence of the focus on middle-mile rather than last-mile activity was seen in J.B. Hunt’s recent financial reporting. J.B. Hunt saw revenue from their intermodal business increase by 2%, and over-the-road revenue increase by 5%. However, final-mile service fell 10%[33]. These dynamics potentially echo the stratification we have been seeing between Upstream and Downstream firms.
Transportation was one of the winners of the latest jobs report, as unadjusted for seasonality, truck transportation added just under 8,000 jobs in July. Air, water, and rail jobs essentially held steady over the same period[34]. Of course, the big news in rail is the merger of Union Pacific and Norfolk Southern creates the first coast-to-coast rail line in U.S. history[35]. One potential benefit of this merger is that there will now be direct rail connections from the busy West Coast ports to the populous East Coast, without needing to transfer from one carrier to another[36].
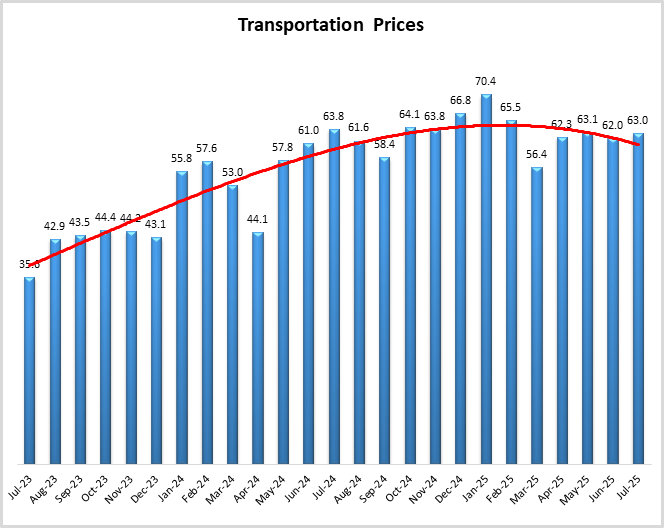
Transportation Price expansion was up slightly (+1.0) to 63.0. Prices have expanded steadily throughout 2025, with every reading in the last four months coming in between 62.0 and 63.1. The increase is at least in part to fuel costs. U.S. diesel fuel came in at $3.805 per gallon in the last week of July. This is down very slightly (-0.007 – which is a bit James Bond-ian), and up 0.037 per gallon from a year ago. This is a sharp rise from the $3.451 per gallon from the first week of June – which was the low for the past 12-months – suggesting that increased demand has put some pressure on prices[37]. The increase is likely welcome news for oil produces, as both Exxon Mobil and Chevron reported their lowest profits in four years during Q2. The price of a barrel of crude has been below $70 for most of 2025 and was below $60 in May during the “air pocket” of slowed U.S. imports[38].
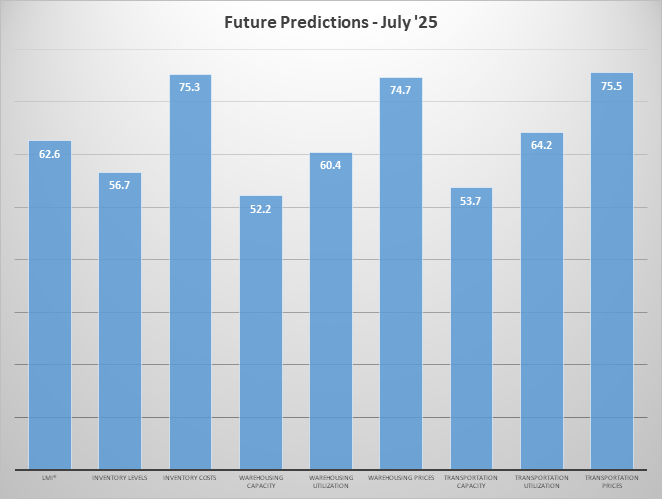
Respondents were asked to predict movement in the overall LMI and individual metrics 12 months from now. Respondent predictions for the overall index are 62.6, down (-1.9) from June’s future prediction of. This would represent a faster rate of growth than the all-time average of 61.5. A primary reason for this slowed down prediction are softer (-5.8) predictions regarding Inventory Level expansion, which came in at 56.7 – largely on the back of predictions of contraction from both large and Downstream respondents. As a result of this, future predictions expansion are lower for both Inventory Costs (-6.6 to 75.3) and Warehousing Prices (-0.8 to 74.7) – although bother are still quite high. The forecasted levels of available Transportation Capacity is up (+8.0) as well, moving from contraction at 45.7 to expansion at 53.7. Taken altogether this suggests that firms are hoping that tariffs will become a settled matter over the next 12 months and that inventory flows can become more predictable (at least on the Downstream side). However, the high predicted cost expansion (225.5 cumulative) suggests that, however this settles, respondents are anticipating supply and logistics costs to expand rapidly over the next year.
We observe some differences when comparing feedback from Upstream (blue bars) and Downstream (orange bars) respondents in July. Continuing the trends we observed through June and May, Upstream firms report expansion in Inventory Levels (58.5) while their Downstream counterparts report contraction (47.6). This is also reflected Upstream firms experiencing contraction (48.6) relative to the mild expansion reported Downstream (52.4) in available Warehousing Capacity, as the former struggles to find a place to hold this continued wave of goods. We also observe marginally statistically significant differences in both Warehousing Utilization (62.0 to 47.6) and Transportation Utilization (60.7 to 50.0), suggesting that Upstream firms are utilizing significant levels of available logistics capacity in order to manage the large volumes of inventories they are holding. Conversely, Downstream firms report contraction for Warehousing Utilization and no movement for Transportation Utilization, suggesting that the JIT approach they are taking to inventory replenishment means they are utilizing either less, or similar, level of available capacity from month to month.
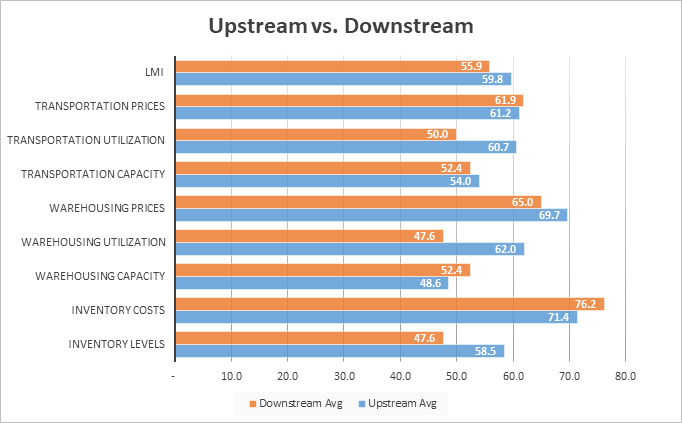
| Inv. Lev. | Inv. Costs | WH Cap. | WH Util. | WH Price | Trans Cap | Trans Util. | Trans Price | LMI | |||||||||||
| Upstream | 58.5 | 71.4 | 48.6 | 62.0 | 69.7 | 54.0 | 60.7 | 61.2 | 59.8 | ||||||||||
| Downstream | 47.6 | 76.2 | 52.4 | 47.6 | 65.0 | 52.4 | 50.0 | 61.9 | 55.9 | ||||||||||
| Delta | 10.8 | 4.8 | 3.8 | 14.4 | 4.7 | 1.6 | 10.7 | 0.7 | 3.9 | ||||||||||
| Significant? | No | No | No | Marginal | No | No | Marginal | No | No |
We also split future predictions by Downstream respondents (purple bars) and Upstream respondents (green bars). The differences are more pronounced this month, with five of the eight metrics predicted to have at least some statistically significant differences, as opposed to only one significant difference in June. Future Inventory Levels are the metric that displays significant differences in both June and July. This month we that Upstream firms are predicting strong continued expansion in Inventory Levels at 62.0, while their downstream counterparts once again predict contraction at 45.2. This suggests the Downstream retailers are planning to continue pursuing JIT policies and their Upstream suppliers expect to continue holding high levels of inventory. As a result of this difference, Upstream firms are predicant significantly higher readings for Warehousing Prices (78.5 to 67.5), Transportation Utilization (67.3 to 54.8), Transportation Prices (78.3 to 66.7), and in the overall LMI (64.3 to 57.6). Taken together this suggests that Upstream firms will bear a heavy cost burden if inventories do indeed expand so quickly. Interestingly, Downstream firms predict contraction in Transportation Capacity (47.6 to 54.7 Upstream). The tight capacity suggests that Downstream firms will be continuously moving goods in order to maintain JIT inventory practices.
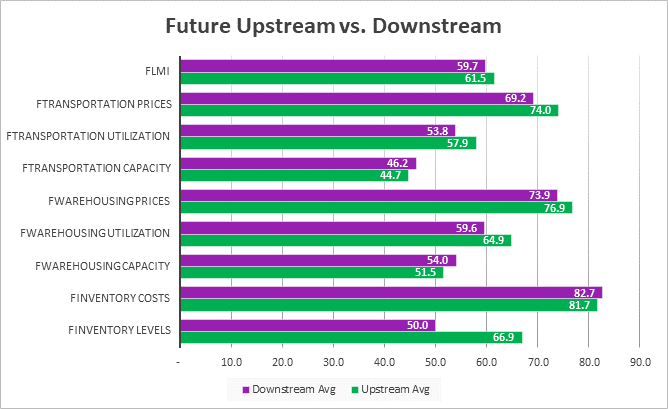
| Futures | Inv. Lev. | Inv. Costs | WH Cap. | WH Util. | WH Price | Trans Cap. | Trans Util. | Trans Price | LMI |
| Upstream | 62.0 | 77.1 | 50.7 | 62.5 | 78.5 | 54.7 | 67.3 | 78.3 | 64.3 |
| Downstream | 45.2 | 76.2 | 54.8 | 59.5 | 67.5 | 47.6 | 54.8 | 66.7 | 57.6 |
| Delta | 16.7 | 1.0 | 4.1 | 3.0 | 11.0 | 7.0 | 12.6 | 11.6 | 6.7 |
| Significant? | Yes | No | No | No | Marginal | No | Marginal | Marginal | Marginal |
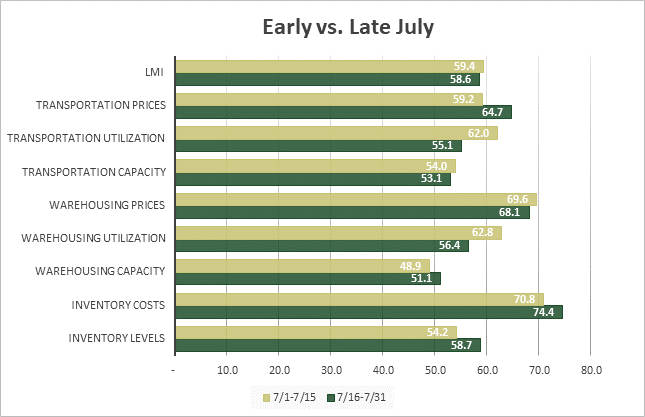
Breaking the trend established over the last few months, we observe no significant statistical differences between responses that were collected early (gold bars) and late (green bars) in the month. A likely reason for this is that, because of the delay in implementations ahead of the initial July 9th deadline, trade regulations stayed relatively constant throughout the entire month. As a result of this, port data shows that inventories continued flowing into the U.S. at a consistent rate, which in turn spread the demand for warehousing and transportation out more evenly throughout July. While none of them were statistically significant, there were some notable shifts in July. First is the decrease in expansion for both Transportation and Warehousing Utilization, which suggests that usage of available capacity grew throughout July, but was at its fastest pace in the first half of the month. We also see that Warehousing Capacity went from mild contraction early in the month (where it also was in June) to mild expansion in the second half of July, which could indicate a loosening of available space as Downstream firms continue to run down their existing inventories