- Growth is INCREASING AT AN INCREASING RATE for: Inventory Levels, Warehousing Utilization, Warehousing Prices, and Transportation Utilization
- Growth is INCREASING AT A DECREASING RATE for: Inventory Costs and Transportation Prices
- Warehousing Capacity and Transportation Capacity are CONTRACTING
The upward push in June stems from much faster expansion in Inventory Levels (+5.7 to 60.5). This increase can be largely traced to surges among larger respondents (68.6 to 55.6 for small respondents) and Downstream retailers (66.0 to 59.1 Upstream). The move was more pronounced later in June, as expansion rates went from moderate expansion at 55.4 early in the month to robust growth at 66.3 later on. The move in Inventory Levels led to subsequent increases in Warehousing Utilization (+6.5), Warehousing Prices (+3.0) and Transportation Utilization (+5.2). At the same time, we see Warehousing Capacity (-3.0 to 47.5) moving back into contraction as more storage space is needed to accommodate increased inventories.
This level of Inventory Level expansion is a flip from what we have seen for most of 2026. The push from retailers is likely representative of two factors: 1) In spite of inflation, consumer spending has held through the first half of the year, giving retailers confidence in bringing forward goods for the second half of the year; 2) tariffs may increase in later July, so some of what we’re seeing is a pull-forward ahead of peak season.
Transportation continues to move at a significant pace. Transportation Prices expansion is down (-3.6) from last month’s reading of 96.0, which was the fastest rate of expansion ever recorded for any metric in the history of the index. Price expansion in June is 92.4, which represents a significant upward movement – just at a slightly slower rate than what we saw in April and May. Transportation Capacity continues to compress (-0.9) at 30.8, which may be a factor in the continued upward swing (+5.2) of Transportation Utilization at 74.7.
University, Colorado State University, Florida Atlantic University, Rutgers University, and the University of Nevada, Reno, and in conjunction with the Council of Supply Chain Management Professionals (CSCMP) issued this report today.
Results Overview
The LMI score is a combination of eight unique components that make up the logistics industry, including: Inventory Levels and Costs, Warehousing Capacity, Utilization, and Prices, and Transportation Capacity, Utilization, and Prices. The LMI is calculated using a diffusion index, in which any reading above 50.0 indicates that logistics is expanding; a reading below 50.0 is indicative of a shrinking logistics industry. The latest results of the LMI summarize the responses of supply chain professionals collected in June 2026.
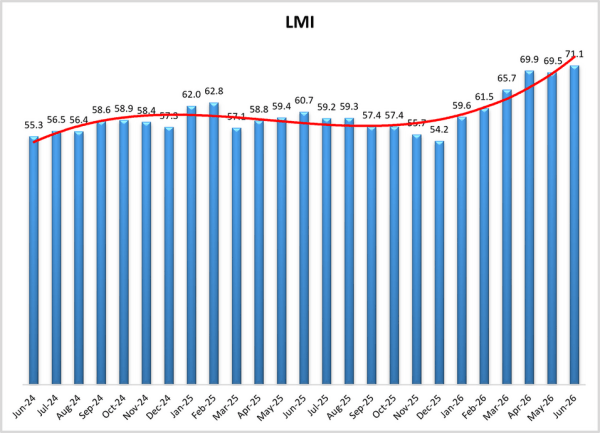
The June LMI read in at 71.1, which is up (+1.6) from May’s reading of 69.5, and is the first reading over 70.0, as well as the fastest rate of expansion, since March of 2022. This month’s reading is well above the all-time average of 61.6. This robust rate of expansion is driven primarily by larger respondents, who saw significantly faster expansion in logistics activity at 71.3 than smaller respondents who reported more moderate (but still robust) expansion at 63.3. There is also evidence that expansion was stronger later in the month.
The moves in the logistics industry reflect (and often precede) the movements in the overall economy. The economy continues to be in an interesting place this month as supply chains continue to adjust to disruptions caused by war, tariffs, and the resulting inflation. Trade policy remains a source of uncertainty in the global economy. The USMCA trade deal between the U.S., Canada, and Mexico expired on July 1st. The Trump administration has speculated that it may opt against renewing the deal and instead negotiated separate bilateral trade deals with Mexico and Canada. Under the USMCA trade between the three nations increased by $540 billion from 2020 to 2024 as several firms reconfigured their supply chains to take advantage of the revamped trade deal[1]. Ford Motor Company is a strong example of this shift – and of the impact that the move away from North American free trade have had. Ford assembles more vehicles in the U.S. than any other automaker, producing over 2 million of them in 2025. Their supply chain relies on several cross-border moves, with vehicles like the F-150 crossing between the U.S., Mexico, and Canada seven times during production. This has made Ford particularly vulnerable to shifts in trade policy, which, along with a shortage of components, partially explains their just-reported 9.6% year-over-year decline in sales[2]. There is also uncertainty regarding U.S.-European trade, as President Trump threated to scrap the recently finalized U.S./EU trade by imposing a 100% tariff on countries that have levied digital taxes that impact U.S. service exports[3].
The uncertainty may be impacting the jobs market as 22.5% of U.S. Consumer Conference Board respondents reported that jobs are “hard to get” – up from 19.8% in May[4]. This aligns reports that the U.S. added 57,000 jobs in June, which is lower than the 100,000 that had been expected[5]. This report comes on the heels of downward reassessments for April and May, as job gains have been revised down by 74,000 from initial reports The low, but still steady, job gains complicate the overall economic picture for the Fed, which is attempting to navigate a path through the current bout of inflation, but will not want to upset the job market[6]. Several Fed Governors have penciled in rate increases at some point this year, contrasting with Chairman Warsh’s more dovish statements from earlier this year[7].
Consumer spending has remained strong despite all of these headwinds. Consumer retail spending was up 0.9% in May and the National Retail Federation estimates that 32% of consumers have already started their back-to-school shopping[8]. This continued spending is likely related to the University of Michigan’s gauge of consumer sentiment, which was up 4.7 points (10.5%) in June to 49.5. The improving sentiment came on the back of improved expectations regarding the long-term consequences of the conflict with Iran. This reading is still slightly negative and is 11.2-points (18.5%) lower than this time last year. Inflation expectations continue to be a sore spot, as consumers anticipate 4.6% inflation over the next year[9]. This expectation is in line with current conditions. The Consumer Price Index (CPI) was up 0.5% in May, bringing year-over-year inflation to 4.2%. Even with food and energy increases stripped out inflation reads in at 2.9%, reflecting the indirect impacts of increased fuel costs on all types of goods[10]. The increased costs are reflected in the Personal Consumption Expenditures (PCE) index, which was up 4.1% year-over-year in May. The cost of goods is up 0.4%, and the cost of services is up 0.5% from a month ago[11]. Average paychecks are up 3.5% over the same time period, which reflects some growth but ultimately trails inflation[12]. It is also worth noting that the Upstream producer price index (PPI), which tracks the costs paid by wholesalers, is up 6.5% – the highest level since November 2022[13]. This could foreshadow continued inflation as producer price changes often precede those at the consumer level.
Retailers appear to be encouraged by the continued strength in consumer spending, rushing in goods for the back-to-school season. We see evidence of this in the increase (+5.7) in Inventory Level expansion to 60.5. As mentioned above, this is driven more by Downstream retailers (66.0 to 59.1 for Upstream firms), as well as larger firms (68.6 to 55.6 for smaller respondents). Retailers appear to be encouraged by the continued strength in consumer spending, rushing in goods for the back-to-school season. This is a noted shift from the wait-and-see approach that retailers had been employing through most of the spring. The increase in imports has driven container prices up with Freightos reporting that Asia to U.S. West Coast prices are up 109% month-over-month to $6,687.40 per container[14]. The increase freight price is exacerbated by retailers are also pulling ahead Q4 holiday goods in an effort to stay ahead of potential section 301 tariffs that the U.S. may implement at the end of July[15]. International suppliers are stepping up to meet this increased retail demand. The PMI for Chinese manufacturing moved back into expansionary territory at 50.3 in May, with the sub-index for new orders also moving into expansion at 51.4[16].
The pull-ahead of inventories in the face of potential tariffs mirrors the behavior we saw last year when the Port of Los Angeles had its biggest month ever in July. With reports that retailers are currently struggling to even find containers[17], it’s possible that we could see a repeat of that level of volume. Last year’s pull ahead led wholesalers holding significant volumes of inventory through the late summer and early fall, taxing storage networks across the country[18]. Wholesalers are already facing pressure, as PPI is up 6.5% year-over-year, which is the highest level since November 2022[19]. The continued price pressure on inventories is evident in Inventory Costs, which though down (-8.1) are still growing at 75.9 which we consider a significant rate of expansion. As would be expected given the differences in Inventory Level expansion, Inventory Cost growth is being driven primarily by larger retailers. Downstream Inventory Costs read in at 84.0 in June, which is significantly higher than the 72.2 reported by their Upstream counterparts. We see similar dynamics with differently sized firms, with larger respondents reporting expansion at 81.4 and smaller firms reporting expansion at 71.6. This is a flip from what we have seen for most of the year, as it had been manufacturers that were pulling components ahead through much of the spring. It will be interesting to see if these increasing cost numbers (both for the PPI and LMI) are eventually passed on to consumers. Many large retailers have been outspoken about protecting consumers from large costs increases[20]. However, Inventory Costs continued to increase at a rate of 76.9 over the next 12 months. If this prediction holds, it may be difficult for either Upstream or Downstream firms to fully absorb these cost increases.
These differing inventory strategies are evident in our warehousing metrics. Overall Warehousing Capacity decreased (-3.0) in June, moving back into contraction territory at 47.5. Downstream respondents went from robust capacity expansion at 60.9 last month to no movement at 50.0 in June. Conversely, Upstream firms saw Warehousing Capacity contraction become a bit milder, going from 44.3 in May to 46.4 in June. We observe similar dynamics for smaller (45.7) and larger (50.0) respondents. The differences are more apparent for Warehousing Prices, where smaller firms reported cost expansion at 67.4 – robust but significantly slower than the 81.9 reported by the larger respondents which are currently rushing inventories forward. Warehousing Prices are high generally, up (+3.0) to 73.8. As one might expect given these cost increases, Warehousing Utilization is up (+6.5) to 69.4, which is the highest reading for this metric since September of 2022.
Logistics companies have clearly noticed the momentum in the warehousing market, CMA CGM, which is the world’s third largest shipping line by capacity, is acquiring FedEx Supply Chain in an attempt to add more 3PL services to their portfolio. The acquisition will increase their warehousing space by 34 million square feet and 10,000 employees. If the deal closes as expected the combination of CMA CGM’s FedEx and Ceva assets would be the sixth-largest 3PL in the U.S.[21]. We also see that the JLL Income Property Trust has shifted heavily towards warehousing, with industrial real estate no making up 38% of their $7 billion portfolio. Two thirds of this portfolio are positioned within 3-5 miles of major transportation hubs[22]. These moves are representative of larger trends within the warehousing market, where the slow but steady increase in capacity continues to prioritize service levels and proximity between middle-mile storage and end consumers. Overall, the warehousing sector added 5,100 jobs in June. This comes on the back of 13,000 positions added in April and May[23].
Transportation metrics are once again the primary engines of growth in this month’s index. Transportation Price expansion has slowed (-3.6) but is still growing at the extreme rate of 92.4. Transportation Prices have now read in above 90.0 for four consecutive months. Prior to this the Transportation Price metric had read in below 90.0 for 52 straight months. Similar to the other two cost/price metrics, June’s growth is being driven disproportionately by larger firms (98.7 to 87.7 for smaller respondents), and Downstream retailers (97.9 to 90.4 Upstream) as these parties engage in inventory pull-forwards.
Transportation markets have reacted so strongly to this uptick in demand for two reasons. The first is fuel prices. U.S. diesel fuel was down 16.4 cents per gallon in the last week of June. Prices are now down 97.5 cents per gallon from their recent high of 5.64 per gallon in early April. Diesel prices are still up 87.5 cents per gallon from the start of the conflict with Iran[24], but the recent movements have provided some relief. This comes on the back of Brent crude oil prices dipping below $72 per barrel in the last week of June, which is consistent with pre-war prices and down significantly from the $118 per barrel peak reached this spring. Persian Gulf countries are exporting approximately 15 million barrels of oil per day which is up 50% from May. This is down from the 25 million barrel they were shipping pre-war, but it is progress. It is also notable that much of this increase is due to traffic moving through the Strait of Hormuz[25]. While uncertainty over an official end to the conflict persists, traffic through the strait has increased significantly over the last two weeks. The last Wednesday of June saw 76 ships pass through the strait, which is the most since March 1st [26] of this year.
The second reason for the continued price growth is the lack of available capacity. Transportation Capacity contracted faster (-0.9) at a rate of 30.8. Similar to the dynamics with price, Transportation Capacity has now read in below 40.0 for four consecutive months – a streak that came after 51 straight months above that number (45 of which were expansionary readings above 50.0). This is as much a demand-side issue as it is supply-side. Transportation jobs were down by 1,300 positions in June. The transportation sector has now lost jobs in four of the last five months. April is the only recent bright spot, during which 5,100 jobs were added. The result of these movements is essentially a wash, as overall 1,000 transportation positions have been added in 2026[27]. This suggests that carriers have not staffed up in response to the surge in shipping prices as they might have in the past. It is possible that carriers believe that the recent price increases are somewhat transitory and may come back down when oil markets normalize. Supply has exceeded demand in the transportation sector for much of this decade and has only recently reached an equilibrium. Carriers likely hope to avoid overreacting, while also enjoying increased margins. FreightWaves data seems to back this up, showing that while volumes are virtually flat year-over-year, tender rejection volumes are up 9%[28]. The increase in Transportation Price was significantly accelerated by oil prices, but they are staying up now because of the dearth of Transportation Capacity. A byproduct of these dynamics is a shift towards rail. An average of 369,000 containers per week were sent via intermodal freight in May, which is up 6% month-over-month[29]. The surge in activity has slowed throughput for the big four U.S. railroads, with all of them reporting recent lows in intermodal train speeds[30].
The continued price spike and dearth of capacity have fueled an expansion in Transportation Utilization, which is up (+5.2) to 74.7, which is the fastest rate of growth for this metric since October 2018. Utilization was up throughout the month, moving from 69.2 early on to 78.8 in the back half of June. The 78.8 reading would be the highest we’ve ever recorded for this metric. The increase in utilization seems likely to continue across the supply chain, but particularly Downstream, where respondents are predicting expansion at 82.7 over the next 12 months (which is significantly higher than the still robust 66.7 predicted by Upstream firms).
Respondents were asked to predict movement in the overall LMI and individual metrics 12 months from now. Respondent predictions for the overall index are 70.6, which is up (+1.2) from May’s future prediction of 69.4. Much of this upward revision is driven by the continued upward shift in anticipated inventory strategies. Predicted Inventory Level expansion is up (+10.7) to 67.7, which represents robust expansion. This comes after anticipated Inventory Levels dropped 8.5-points last month. These swings suggest that supply chain strategies continue to be in flux as firms attempt to navigate the ever-changing business environment. Expectations for increased inventories have also pushed expectations for Warehousing Capacity down (-7.0) into negative territory at 49.4. Warehousing Prices are also expected to continue expanding, at a slightly reduced (-4.4), but still high rate of 76.8. Transportation Capacity (+2.0) is expected to stay tight at 42.4, and Transportation Utilization (+5.6 to 75.8) and Transportation Prices (-4.5 to 87.0) are expected to continue on their accelerated growth trajectories.

We observe some differences when comparing feedback from Upstream (blue bars) and Downstream (orange bars) respondents in June. The most significant difference is in Inventory Costs, which are significantly higher Downstream (84.0) relative to Upstream (72.2). This difference is a likely a product of the notable, if non-significant, difference in Inventory Level expansion, where Downstream firms reported growth at 66.0 to Upstream’s 59.1. This represents a continued shift in Inventory Level dynamics as Upstream firms had been much more aggressive in building inventories in March and April (both levels of the supply chain were about even in May). The cost differences do not stop with inventories, as Downstream firms also report higher rates of expansion in Warehousing Prices (78.0 to 71.9) and Transportation Prices (97.9 to 90.4). These differences seem to be consistent with the dynamics discussed above in which retailers are now rushing inventories forward to avoid tariffs and fulfill optimistic expectations of consumer demand.


We also analyze any differences in responses collected in early (gold bars) versus late (green bars) June. The most significant difference is in Inventory Levels, later respondents reported significantly faster expansion at 66.3, up from 55.4 earlier in the month. This is a flip from May, when Inventory Level growth slowed throughout the month. Relatedly, we see a notable, if non-significant, increase (+8.1) in Inventory Costs (71.2 early to 79.3 later). Firms seem to be utilizing a significant volume of freight to move this inventory – something that is reflected in their significantly higher readings for Transportation Utilization (78.8 later to 69.2 early. This adds up to a marginally faster rate of expansion in the overall index for later in the month at 69.0 to 63.7.


The index scores for each of the eight components of the Logistics Managers’ Index, as well as the overall index score, are presented in the table below. The rate of expansion for the overall index is 71.1, which is up (+1.6) from May’s reading of 69.5. This is the first time the index has been above 70.0, which we consider to be a robust rate of expansion, since March of 2022. The upward trajectory is driven by increases in Inventory Levels (+5.7) and the resulting increases in Warehousing Utilization (+6.5), Warehousing Prices (+3.0), and Transportation Utilization (+5.2). We also observe some tightening in capacity metrics, with Warehousing Capacity moving (-3.0) back into contraction from mild expansion, and contraction moving slightly faster (-0.9) for Transportation Capacity. While expansion slowed for Inventory Costs (-8.1) and Transportation Prices (-3.6), both are still growing at very accelerated rates of 75.9 and 92.4 respectively. The strong rate of cost and price expansion is underlined by the continued upward pressure in Aggregate Logistics Costs, which are down (-8.7) but read in at 242.1, which is a level that has generally been inflationary.

This period’s along with prior readings from the last two years of the LMI are presented table below:

The Logistics Manager’s Index reads in at 71.1 in June, up (+1.6) from May’s reading of 69.5. This is the fastest rate of expansion, and first reading about 70.0, since March of 2022. This is 10.4 points higher than the reading last June and up 15.8 points from this time two years ago. The rate of activity is most pronounced for larger respondents, who reported expansion at 71.3, which is statistically significantly higher than the still robust 63.3 reported by smaller respondents.
When asked to predict what conditions will be over the next 12 months, respondents foresee a rate of expansion of 70.6, up (+1.2) from May’s future prediction of 69.4. Downstream respondents are predicting marginally statistically significantly faster expansion at 71.7 to the 66.6 reported Upstream. Despite these differences, both are robust rates of expansion that would be well above the all-time average of 61.6

The Inventory Level index is 60.5, up (+5.7) from May’s reading of 54.8. Inventory Levels are virtually flat compared to a year ago, up 0.7 points, but up 13.1 compared to two years ago. Upstream (59.1) reported a moderate increase in Inventory Levels, while downstream (66.0) reported a larger increase, a difference of 6.9 points. Small respondents had a small increase at 55.6, while larger firms showed a significant increase, at 68.6. We also see that early respondents (55.4) showed a small increase in Inventory Levels, while late (66.3) showed a larger increase.
Increased inventory strategies are reflected in forward-looking predictions. Future Inventory Levels growth is 67.7, up (+10.7) significantly from May’s future reading of 57.0, reflecting the Downstream pull-forward of inventories. Upstream (60.3) expects inventory levels to increase, but Downstream expects a more significant increase, at 73.3, suggesting that retailers may be moving away from the JIT inventory strategies that have characterized much of this year.

Inventory Cost expansion reads in at 75.9, which is down (-8.1) from May’s reading of 84.7. The value this month is 5.0 points below last year, and 12.3 points above two years ago, so Inventory Costs are lower than a year ago, and higher than two years ago. Upstream (72.2) reported significant cost increases, but lower than Downstream (84.0). For Upstream, the Cost index is 13.1 points higher than the Level index. For Downstream, the Cost index is 18.0 points higher – demonstrating the increasing relative cost of inventory across the supply chain. We also observe (likely related) significant differences between large (81.4) and small (71.6) respondents.
Predictions for future Inventory Cost growth is 76.9, down (-4.0) from May’s future prediction of 81.0. Upstream (84.7) and Downstream (73.4) expected large increases in Inventory Costs. Upstream (75.8) and Downstream (77.8) firms expected large, and very similar, increases in Inventory Costs. It is telling that that while both expect very similar increases in Inventory Costs, even though Downstream firms expect a 13.0-point higher increase in Inventory Levels than Upstream do. This likely speaks to the increased cost burden retailers are bearing due to tariffs and inventory pull-forwards.

The reading for Warehousing Capacity for June 2026 read in at 47.5 reflecting a 3.0-point increase from the month prior. This reading is nearly unchanged (+.3-points) from the reading one year ago and is down by 5.1-points from the reading two years ago. In addition, and a sharp change from last month’s nearly 17.0-point difference there as in June there was virtually no difference between Upstream (46.4) and Downstream (50.0) respondents. Comparing the differences between small (<999 employees) and large (>999) employees we see that there is a 4.3-point difference between the two at 45.7 and 50.0. This 4.3-point split was not statistically significant (p >.1).
Exploring the future predictions for Warehousing Capacity, respondents predict slight contraction at 49.4, down (-7.0) from May’s future prediction of 56.4. Respondents across the supply chain predict similar movements, territory with Upstream predictions registering in at 48.5 and Downstream predictions registering in at 50.0.

Continuing the upward trend from last month, the Warehousing Utilization index read in at 69.4 for the month of June 2026, reflecting a 6.5-point increase from the month prior, firmly remaining in expansionary territory. This reading is up 7.2-points from the reading one year ago, and up by 17.2-points from the reading two years ago. In addition, there was a 10.7-point split between Upstream (72.7) and Downstream (62.0) respondents, which – while not statistically significant (p>.1) – is a notable difference. Comparing the differences between small (<999 employees) and large (>999) employers we see that these values are 66.7 and 72.9 (confirming the transition to Downstream growth, now two months in a row) with both small and large firms remaining in expansionary territory for five months in a row. This 6.2-point split was not statistically significant (p >.1).
Exploring the future predictions for Warehousing Utilization, respondents predict expansion at 72.5, up (+1.2) from May’s future prediction of 71.3. This increase in utilization would be consistent with the predicted tightening in capacity. Expectations for growth are consistent across the supply chain with future Upstream expectations (70.6) predicted expand at a slightly slower rate than Downstream expectations (73.9) where this 3.3-point difference was not statistically significant (p>.1).

Warehouse Prices continues their upward rise, with pricing increasing by 3.1-points to 73.8 for June 2026. This reading is up 5.5-points from the reading one year ago, and up 9.3-points from the reading two years ago. In addition there was a 6.1-point difference between Upstream (71.9) and Downstream (78.0) which was not statistically significant (p>.1). Comparing the differences between small (<999 employees) and large (>999) employees we see that these values are 67.4 and 81.9 reflecting a 14.6-point difference between the two which was statistically significant (p<.05).
Finally, exploring the future predictions for Warehouse Price, respondents predict robust expansion at 76.7, down (-4.4) from May’s future prediction of 81.2, indicating a significant rate of price expansion. Expectations across the supply chain are elevated, with future Upstream expectations (78.6) predicted to increase at a faster rate than Downstream expectations (75.5). This month’s 3.0-point difference was not statistically significant (p>.1).

The Transportation Capacity Index dropped .9 points to 30.8 in June 2026. With this decease the Transportation Capacity index continues to indicate contraction for the seventh consecutive month and remains at historically low levels. While the Upstream Transportation Capacity index is at 29.9, the Downstream index is at 33.3 and the difference is not statistically significant. Hence, the contraction observed in Transportation Capacity is relatively uniformly distributed both Upstream and Downstream across the US economy.
The future Transportation Capacity index increased 2 points and now indicates 42.4, representing continued expectations of capacity contraction for the next 12 months, albeit these expectations and not as pronounced as they were in recent months. While the future Upstream index is at 42.3, the Downstream Transportation Capacity index is at 42.5, and the difference is not statistically significant. As such, expectations of slight contraction in future Transportation Capacity are relatively uniformly distributed both Upstream and Downstream across the US economy.

The Transportation Utilization Index increased 5.2 points, indicating 74.7 in June 2026. With this increase the utilization index establishes a new eight-year high mark, and 21.8 points higher than the same time last year. The Downstream Transportation Utilization Index is now at 75.0, while the Upstream index indicates 74.6, and the difference is not statistically significant. As such, Transportation Utilization is rapidly increasing both Upstream and Downstream.
The future Transportation Utilization Index increased 5.6 points and is indicating 75.8 points for the next 12 months. The future Upstream Transportation Utilization index is at 66.7 and the Downstream index at 82.7 and the difference is statistically significant. As such expectations of increased Transportation Utilization are even stronger Downstream than Upstream.

The Transportation Prices Index decreased 3.6 points from the previous reading and recorded 92.4 in June 2026. With this decrease the Transportation Prices Index has retreated from record highs but still remains at historically elevated levels. While the Upstream Transportation Prices Index is at 90.4, the Downstream index is at 97.9 and the difference is marginally statistically significant. As such, it can be concluded that the inflationary pressure on Transportation Prices is being felt strongly across the US economy, with slightly higher pressure exhibited Downstream than Upstream.
The future index for Transportation Prices decreased 4.4 points to 87.0, which represents continued strong expectations of price increases for the next 12 months. The Upstream future Transportation Prices index is at 83.3 while the Downstream Transportation Prices index is at 89.6, but the difference is not statistically significant. Therefore, inflationary expectations in Transportation Prices remain strong across the US supply chains, both Upstream and Downstream.

The data presented herein are obtained from a survey of logistics supply executives based on information they have collected within their respective organizations. LMI® makes no representation, other than that stated within this release, regarding the individual company data collection procedures. The data should be compared to all other economic data sources when used in decision-making.
Data and Method of Presentation
Data for the Logistics Manager’s Index is collected in a monthly survey of leading logistics professionals. The respondents are CSCMP members working at the director-level or above. Upper-level managers are preferable as they are more likely to have macro-level information on trends in Inventory, Warehousing and Transportation trends within their firm. Data is also collected from subscribers to both DC Velocity and Supply Chain Exchange as well. Respondents hail from firms working on all six continents, with the majority of them working at firms with annual revenues over a billion dollars. The industries represented in this respondent pool include, but are not limited to: Apparel, Automotive, Consumer Goods, Electronics, Food & Drug, Home Furnishings, Logistics, Shipping & Transportation, and Warehousing.
Respondents are asked to identify the monthly change across each of the eight metrics collected in this survey (Inventory Levels, Inventory Costs, Warehousing Capacity, Warehousing Utilization, Warehousing Prices, Transportation Capacity, Transportation Utilization, and Transportation Prices). In addition, they also forecast future trends for each metric ranging over the next 12 months. The raw data is then analyzed using a diffusion index. Diffusion Indexes measure how widely something is diffused or spread across a group. The Bureau of Labor Statistics has been using a diffusion index for the Current Employment Statics program since 1974, and the Institute for Supply Management (ISM) has been using a diffusion index to compute the Purchasing Managers Index since 1948. The ISM Index of New Orders is considered a Leading Economic Indicator.
We compute the Diffusion Index as follows:
PD = Percentage of respondents saying the category is Declining,
PU = Percentage of respondents saying the category is Unchanged,
PI = Percentage of respondents saying the category is Increasing,
Diffusion Index = 0.0 * PD + 0.5 * PU + 1.0 * PI
For example, if 25 say the category is declining, 38 say it is unchanged, and 37 say it is increasing, we would calculate an index value of 0*0.25 + 0.5*0.38 + 1.0*0.37 = 0 + 0.19 + 0.37 = 0.56, and the index is increasing overall. For an index value above 0.5 indicates the category is increasing, a value below 0.5 indicates it is decreasing, and a value of 0.5 means the category is unchanged. When a full year’s worth of data has been collected, adjustments will be made for seasonal factors as well.