Growth is INCREASING AT AN INCREASING RATE for: Inventory Costs, Warehousing Capacity, and Transportation Prices
Growth is INCREASING AT A DECREASING RATE for: Inventory Levels, Warehousing Utilization, Warehousing Prices, and Transportation Utilization Costs
Transportation Capacity is CONTRACTING
Transportation continues to move at a significant pace. Transportation Prices are up (+1.0) to 96.0, which is the fastest rate of expansion ever recorded for any metric in the nearly ten-year history of the index. Transportation Capacity continues to contract quickly at 31.7, and Transportation Utilization expansion remains elevated at 69.5. The transportation market has been tight, with prices growing at an unprecedented rate since the closure of the Strait of Hormuz. The spike in fuel has led to increases for all three of our price and cost metrics, with aggregate logistics costs reading in at 250.9, which is the highest reading since March of 2022. U.S. supply chains have largely continued operating despite the disruption of 20% of the globe’s oil exports. Upstream firms have pulled inventories forward to curtail future shortages and consolidate shipments, while Downstream firms have kept things leaner in an attempt to mitigate tariffs. Supply chains have been resilient despite these ongoing disruptions. However, in the past this level of elevate cost has eventually led to significant levels of supply-driven inflation. It will be important to continue monitoring these costs through the summer to observe if they begin to significantly impact both Upstream and Downstream demand.
University, Colorado State University, Florida Atlantic University, Rutgers University, and the University of Nevada, Reno, and in conjunction with the Council of Supply Chain Management Professionals (CSCMP) issued this report today.
Results Overview
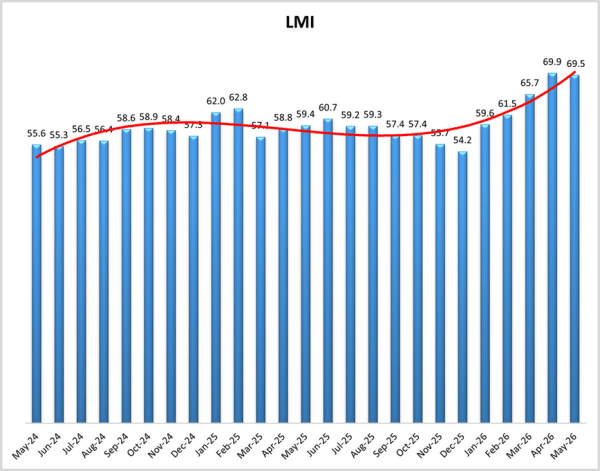
The LMI score is a combination of eight unique components that make up the logistics industry, including: Inventory Levels and Costs, Warehousing Capacity, Utilization, and Prices, and Transportation Capacity, Utilization, and Prices. The LMI is calculated using a diffusion index, in which any reading above 50.0 indicates that logistics is expanding; a reading below 50.0 is indicative of a shrinking logistics industry. The latest results of the LMI summarize the responses of supply chain professionals collected in May 2026.
The May LMI read in at 69.5, which is down (-0.5) from April’s reading of 69.9, which was the fastest rate of expansion since March of 2022. Even with the slight drop, this month’s reading is still well above the all-time average of 61.5. This robust rate of expansion is consistent across respondents, with no significant differences between Upstream and Downstream (65.8 and 63.8), early and late (65.4 and 64.7), or small and large respondents (66.3 and 63.4).
The moves in the logistics industry reflect (and often precede) the movements in the overall economy. The economy continues to be in an interesting place this month as supply chains continue to adjust to disruptions caused by war, tariffs, and the resulting inflation. In the U.S., PCE was up 0.4% in April and 3.8% year-over-year. This was driven heavily by increased fuel costs, as spending on gasoline and other energy products was up 5.7% in April and a staggering 27.1% from a year ago[1]. The New York Times estimates that American consumers have collectively spent an additional $44.8 billion on gasoline since the start of the war in late February[2]. In the last week of May, Federal Reserve Governor Lisa Cook stated that she is prepared to raise interest rates if the current supply-driven inflation persists. She mentioned in remarks at Stanford University that the job market is currently stable, making it a less pressing matter than inflation and negating the need to decrease rates[3]. Minneapolis Fed President Neel Kashkari agrees, stating that because the labor market is in “decent shape right now, while inflation is simply much too high,” he is focusing on the latter over the former[4]. Inflation is clearly on the mind of the bond market as well, as U.S. 30-year Treasury bonds hit 5.197% in late May, which is their highest level since July 2007 during the build-up to the Great Recession [5].
This phenomenon is not restricted to the U.S., as large economies across Europe and Asia are seeing significant jumps as well. This is particularly pronounced in the U.K., where bonds are at their highest rate since 1998, and in Japan, where the 4.13% 30-year bond yield is the highest in the country’s history[6]. The European Central Bank (ECB) stated it will do “what is necessary” to curtail inflation, leading markets to effectively price in an anticipated rate hike[7]. Given this combination of economic headwinds, United Nations economists predict that annual global GDP growth will be 2.5% for 2026, down from the 2.7% growth they predicted in January. At the same time, they predict that global inflation will be up 3.9%, up from January’s 3.1% prediction. Inflation is predicted to be significantly greater in developing countries (5.2%) than in their first-world counterparts (2.9%)[8].
The impact of inflation is impacting both business and consumer sentiment. The University of Michigan’s Survey of Consumers read in at 44.8 in May, which is the lowest reading in the history of that index. The drop in sentiment largely due to concerns over prices, with 57% of consumers reporting that high prices are eroding their personal finances. Consumers are concerned this will continue, anticipating 4.8% inflation over the next year – up notably from the expectation of 3.4% inflation in the final reading before the start of the conflict with Iran[9]. The Survey of Professional Forecasters through the Philadelphia Fed is even more pessimistic, projecting that the CPI will be up 6% in the second quarter. They predict that producer-side (PCE) inflation will be up 4.5% over the same period[10]. The Conference Board consumer confidence index is also down (-0.7) to 93.1 in May, breaking a three-month run of increases. The Conference Board survey is reflective of the ongoing K-shaped economy, with respondents from households with incomes above $100,000 reporting increased confidence, contrasting with decreasing confidence from households below $100,000[11].
Inflation has been noticed on the retail front as well. Retail sales in April were up 0.5% from March, although this drops to 0.3% when gas stations – and their increased prices – are removed[12]. Larger items such as home and garden, furniture, and appliance sales were down, with the CEO of Whirlpool comparing their sales to a recession-level environment[13]. Walmart noted that shoppers were filling up their cars with 10 gallons less per trip last month. CFO John David Rainey believes this is a “sign of stress”, and one of the reasons why Walmart has so far planned to keep prices on other goods steady to draw in cost-conscious consumers[14]. Several other firms, including Coca-Cola, Kraft Heinz, and McDonald’s, are releasing slimmed-down product offerings as a way to reduce prices and provide some relief for consumers[15]. Retailers are betting these lower prices will continue to attract consumers, adding 22,000 jobs in April which accounted for nearly 20% of total job growth last month[16].
This caution might also explain the slowing buildup of Inventory Levels in May, which were down (-1.5) to 54.8, which is a very modest rate of expansion. The slowdown was most noticeable in late May, where Inventory Levels essentially broke even at 50.9 which was a far cry from the robust expansion of 60.5 reported earlier in the month. We also saw that smaller firms reported much slower levels of expansion at 51.0 to the more robust 59.5 reported by larger firms that may not be experiencing the same cost challenges. Inventory Levels are inextricably linked to Inventory Costs. Inventory Costs were up dramatically (+9.4) to 84.1, which is their fastest rate of expansion since May of 2022. As displayed in the figure below, these readings mean that Inventory Costs are 29.2 points higher than Inventory Levels, which is the largest gap between these two metrics in the history of the index. This suggests that the cost of inventories, relative to their absolute level, is increasing at the fastest pace in the decade we have been tracking this. The previous high was in November of 2021, which was the height of the rush of emergency shipments in the post-Covid year at the peak of the previous freight cycle. The logistics industry crashed soon after this previous peak due to a combination of too much inventory and high inflation. Inventories have been lower in the run up to this peak, so the chance of a crash may be softened in this case. However, like 2021-2022, inflation is present in 2026. When inventories become more expensive, consumer and industrial demand can eventually drop off, which can in turn lead to a slowdown in the larger logistics industry. It will be important to keep an eye on these metrics moving forward.

Evidence that this is likely to be a temporary pull-forward and not an ongoing strategy is seen in future predictions. Inventory Levels are predicted to expand at the modest rate of 57.0 over the next 12 months. Digging in more deeply though, we see that Upstream respondents are predicting no movement in future Inventory Levels at 50.0. This stands in sharp contrast to Downstream firms, which predict future expansion at 68.8. This speaks to the nuances in the way different parts of the supply chain have been approaching this. Manufacturers are pulling inventories forward now, as they are most concerned about shortages. Retailers have been much leaner, keeping inventories low due to currently high costs that are partially driven by tariffs. Both parties seem to be looking for a change going forward, with manufacturers and retailers working through the stocks they are presently building, and retailers hoping to increase inventories at some point in the next year (possibly ahead of peak season).
These differing inventory strategies are evident in our warehousing metrics. Overall Warehousing Capacity increased (+5.0) in May, moving away from contraction to mild expansion at 50.5. Downstream retailers and their lean inventory strategies drove this move, reporting robust expansion of 60.9 in Warehousing Capacity. This stands in sharp contrast with Upstream firms, which reported contraction at 44.3. There were similar dynamics in the split between large and small respondents, as smaller firms reported contraction at 44.1 and their larger counterparts reported expansion at 58.1. We also see a significant split between large and small firms with Warehousing Utilization. Larger firms report significant expansion in Warehousing Utilization at 70.9 while their smaller counterparts report more modest expansion at 56.0. Small firms, with their contracting capacity, may be boxed out of new space. If the space they do have is close to being maxed out already, they might have less space to expand into, limiting the growth of their utilization. Overall, Warehousing Utilization remains robust, down slightly (-1.5) to 62.9. There may be some relief for smaller firms looking for more space with the launch of Amazon Supply Chain Services as the U.S.’s largest ecommerce retailer, and largest parcel carrier by volume, takes another step towards becoming a 3PL for other firms[22]. Increased network capacity could also be a relief for Warehousing Prices, which continue expanding at the slightly slower (-2.0) but still significant pace of 70.7. Warehousing Prices are currently elevated across the supply chain. This may change, however, as Upstream firms are predicting Warehousing Prices to increase at 86.1 over the next 12 months, which is a significantly faster rate of growth than the (still quite high) predictions of 71.7 by Downstream firms.
While Warehousing Prices and Inventory Costs are both high in May, they both pale in comparison to Transportation Prices, which are up (+1.0) to 96.0, which is the highest ever reading for any metric in the history of the LMI. As would be expected, given the continued shortage in fuel and subsequent spikes in cost, Transportation Prices are up across all respondents. However, they are highest for smaller respondents, which reported Transportation Price expansion of 98.2, the highest sub-reading we’ve ever seen and very close to the index maximum of 100.0. This reading is marginally statistically significantly higher than the 93.3 reported by larger firms, indicating that – similar to what we saw with tariffs in 2025 – the smallest firms are once again bearing the brunt of unexpected supply disruptions. At the same time, larger respondents do report that Transportation Capacity contracted at a marginally statistically significantly faster rate (25.6) than smaller firms (36.6). Overall Transportation Capacity is contracting a bit slower (+3.3), but at a still rapid pace of 31.7. We read in a difference for the metric between Upstream and Downstream respondents as well, with Upstream firms, who are stocking up more quickly at the moment, reporting a very sparse 34.1, contrasting with the milder contraction of 45.3 Downstream. This difference seems likely to continue, with Upstream firms predicting contraction at 34.1 over the next 12 months, while their Downstream counterparts predict mild expansion at 54.7. Finally, we observe differences in Transportation Utilization as well, with Upstream firms reporting a higher level of expansion (73.9) than Downstream firms (60.9). These differences are consistent with the reported differences in Capacity. Overall Transportation Utilization remains elevated, down very slightly (-0.1) to 69.5.
This is the hottest that the transportation market has been in over four years. It will be interesting to see whether or not that persists, or whether the disruptions that have acted as tailwinds to the freight market could eventually become headwinds. Both the University of Michigan and Conference Board consumer surveys showed a downward shift in spending habits, and a move away from durable goods as more money is spent on food and energy. If this trend continues, it could have an impact on freight volumes. Take, for instance, the recent estimate that sales of new cars in 2026 are expected to be down by a million units from the pre-Covid norm as more and more consumers hold onto older vehicles in the face of high costs and less disposable income[23]. Inflation has crept into mortgage rates as well, with the average 30-year fixed rate mortgage in the U.S. up to 6.51 percent[24]. The housing market has been slow for several years, and the recent spike in mortgage rates could act as an additional headwind. New home sales are also down 6.2% in April, with a third of all sales concentrated on homes that are prices above $500,000[25]. Automotive manufacturing and housing construction soak up significant transportation and warehousing volumes. Continued slowness in these sectors could eventually bleed over into reduced freight volumes.


We observe some differences when comparing feedback from Upstream (blue bars) and Downstream (orange bars) respondents in May. The most significant differences are in the relative paucity of available capacity upstream. Upstream firms report contraction (44.3) for Warehousing Capacity, contrasting with robust expansion (60.9) for Downstream firms. Upstream firms are also reporting significantly faster contraction (25.7) for available Transportation Capacity than their Downstream counterparts (45.3). Relatedly, Upstream firms also report significantly faster expansion for Transportation Utilization (73.9) than Downstream respondents (60.9). This is all consistent with recent reports that manufacturing firms are increasing inventories more quickly to get ahead of potential cost increases in the near-term. As will be seen on the next page, it also seems to be informing future plans, both Upstream and downstream, in the supply chain.


We analyze any differences in responses collected in early (gold bars) versus late (green bars) May. Similar to what we observed in April, there are no statistically significant differences between the two groups of responses, but we do read in some interesting nuance nevertheless. The biggest shift is in Inventory Levels, moving from robust expansion (60.5) to almost no movement (50.9). This is the inverse of April, when Inventory Levels went from almost no movement (52.4) early in the month to moderate-to-robust expansion (59.8) later on. This suggests that there was a burst of inventories from mid-April to mid-May, which now may have slowed slightly. The other metrics were largely consistent throughout the month, with cost metrics showing strong rates of expansion and capacity remaining tight.


The index scores for each of the eight components of the Logistics Managers’ Index, as well as the overall index score, are presented in the table below. The rate of expansion for the overall index is 69.5, which is down (-0.4) from April’s reading of 69.9. The downward pressure comes from a slowdown in the rate of expansion for Inventory Levels (-1.5), leading to subsequent slowdowns in Warehousing Utilization (-1.5), Warehousing Prices (-2.0), and Transportation Utilization (-0.1). We also observe some loosening in capacity metrics, with Warehousing Capacity moving (+5.0) from contraction to mild expansion, and the rate of contraction slowing (+3.3) for Transportation Capacity. Despite the slowdown in inventory growth, we see marked expansion (+9.4) in Inventory Costs, suggesting that factors like tariffs and fuel costs may be increasing per-unit costs. The impact of fuel costs is evident in the continued expansion (+1.0) in Transportation Prices, which at 96.0 is the fastest growing metric we’ve recorded in the history of the index. Together, these movements push aggregate costs to 250.85, their fastest rate of growth since March of 2022 at the height of inflation.

This period, along with prior readings from the last two years of the LMI, is presented in the table below:

The May Logistics Manager’s Index reads in at 69.5, down (-0.4) from April’s reading of 69.9, which had been the fastest rate of expansion in four years. This month’s mark is not far off that pace and is driven by continued strength among the transportation metrics and strong cost/price growth across the board. We do see a slight slowdown in inventories, particularly in the second half of the month, as firms adjust to higher costs. The overall expansion is consistent across respondents, with no significant differences between Upstream and Downstream, small and large, or between early and late May responses.
When asked to predict what conditions will be over the next 12 months, respondents foresee a rate of expansion of 69.4. This is down (-3.8) from April’s future prediction of 73.2 and consistent with the current expansion of 69.5. We find no significant differences between the growth expectations from Upstream (66.0) and Downstream (67.6) respondents.

The Inventory Level index is 54.8, down (-1.5) from April’s reading of 56.3 and an exact repeat of the reading from March, up slightly (+1.5) from March’s reading of 54.8. Inventory Levels are 3.3 points higher than a year ago, and 8.3 points lower than two years ago at this time. Upstream (54.2) reported a small increase in inventory levels, while downstream (57.8) reported a slightly larger increase, with a difference of 3.6 points. The real split was by size, as small respondents were virtually unchanged, at 51.0, while larger firms showed a significant increase, at 59.5. There was also a change over time, as early respondents (60.5) showed an increase in inventory levels, while late (50.9) showed inventory levels as virtually unchanged.
Increased inventory strategies are reflected in forward-looking predictions. Future Inventory Levels growth is 57.0, down notably (-8.5) from April’s future prediction of 65.5 and reflects a change in strategy, particularly for manufacturers that may be concerned about increasing costs and potential product shortages. Upstream expects Inventory Levels to be unchanged over the next twelve months, at 50.0, whereas Downstream expects a significant increase, at 68.8. This is a big shift as last month, the Upstream value was 8.4 points higher than Downstream but this month, Downstream is 18.8 points higher than Upstream.

Inventory Costs are 84.7, up (9.4) from April’s reading of 74.7. This reading is 29.2 points higher than the current Inventory Level expansion, which is the largest delta we have ever read between these two metrics. This difference suggests that the relative cost of inventories is increasing faster than any level we have seen over the last decade. The value this month is 5.7 points above last year, and 18.9 points above two years ago, so inventory costs are a little higher than a year ago, and much higher than two years ago. Upstream and Downstream both reported very similar and high Inventory Costs. Upstream was 85.3, and Downstream was 81.3. These results come despite the fact that both reported only very small increases. The Upstream Cost number is 31.2 points higher than the Inventory Levels. For Downstream, the Cost value is 23.4 points higher than the inventory levels. We saw marginal differences between cost growth reported across early (86.5) and late (82.4) or small (85.0) and large (82.9) respondents.
Predictions for future Inventory Cost growth is 81.0, up (+1.8) from April’s future prediction of 79.2. This prediction is above 80.0 and therefore across the threshold of what we would consider to be extreme rates of expansion. Upstream (84.7) and Downstream (73.4) are expected to experience large increases in Inventory Costs. Interestingly, Upstream firms expect Inventory Levels to be flat at 50.0, while also expecting a very large increase in Inventory Costs, at 84.7. On the other hand, Downstream expects much larger growth in Inventory Levels, at 68.8, while expecting a more modest increase than Upstream in Inventory Costs, at 73.4. Looked at another way, the downstream cost projections of 73.4 are only 4.7 points higher than the inventory levels. For Upstream, the difference is 34.7 points.

The reading for Warehousing Capacity for May 2026 registered in at 50.5, reflecting a 5.0-point increase from the month prior. This reading is nearly unchanged (+0.5) from the reading one year ago, and is down by 5.1-points from the reading two years ago. In addition, there was a sizable 16.7-point split between Upstream (44.3 and notably unchanged from last month) and Downstream (60.9 where the difference is seen) was statistically significant (p<.01), but notable that the Upstream value remains in contraction for 4 months now, where Downstream is now expanding. Comparing the differences between small (<999 employees) and large (>999) employees we see that there is a 14.0-point difference between the two at 44.1 and 58.1. This 14.0-point split was statistically significant (p <.05).
Exploring the future predictions for Warehousing Capacity, respondents predict moderate expansion at 56.4, up (+5.8) from April’s future prediction of 50.6. Respondents across the supply chain predict similar movements, territory with Upstream predictions registering in at 54.9 (up 4 points from last month) and Downstream predictions registering in at 59.4 (up 9.4 points from last month) with this 4.5-point difference being not statistically significant (p>.1), though both are stronger growth predictions than last month’s estimates.

Reversing the dip from last month, the Warehousing Utilization index registered at 62.9-points for the month of May 2026, reflecting a 1.5-point decrease from the month prior, firmly remaining in expansionary territory. This reading is up 0.5-points from one year ago, and down by 1.1-points from two years ago. In addition there was a 1.7-point split between Upstream (64.2) and Downstream (62.5), with this difference being not statistically significant (p>.1). Comparing the differences between small (<999 employees) and large (>999) employees we see that these values are 56.0 and 70.9 (corroborating the transition to Downstream growth) with both small and large firms remaining in expansionary territory for four months in a row, but with Upstream showing softening. This 14.9-point split was statistically significant (p <.05).
Exploring the future predictions for Warehousing Utilization, respondents predict expansion at 71.3, down (-3.7) from April’s future prediction of 75.0. This dramatic increase in utilization would be consistent with the predicted tightening in capacity. Expectations for growth are consistent across the supply chain with future Upstream expectations (69.7) being predicted to be growing at a slightly slower rate than Downstream expectations (73.4), which reflects an inflection from last month’s dynamics, where this 3.9-point difference is not statistically significant (p>.1).

The Warehousing Pricing continues its upward rise, reading in at 70.7, which is a slightly slower rate (-2.0) from April. This reading is down 1.4 points from the reading one year ago, and up 5.8 points from the reading two years ago. In addition, there was a 2.7-point difference between Upstream (71.0) and Downstream (68.3) which was not statistically significant (p>.1). Comparing the differences between small (<999 employees) and large (>999) employees we see that these values are 71.6 and 69.0 reflecting a 2.5 -point difference between the two which was not statistically significant (p >.1).
Finally, exploring the future predictions for Warehouse Price, respondents predict robust expansion at 81.2, down slightly (-0.4) from April’s reading of 81.6, indicating an extreme rate of price expansion. Expectations across the supply chain are elevated, with future Upstream expectations (86.1) being predicted to increase at a faster rate than Downstream expectations (71.7). This month’s 14.4 -point difference was statistically significant (p<.05).

The Transportation Capacity Index rebounded 3.3 points to 31.7 percent in May 2026. Despite this increase, the Transportation Capacity index continues to indicate contraction for the sixth consecutive month and remains at historically low levels. While the Upstream Transportation Capacity index is at 25.7, the Downstream index is at 45.3 and the difference is statistically significant. Hence, the contraction observed in Transportation Capacity is significantly stronger Upstream than downstream across the US economy.
The future Transportation Capacity index increased 7.2 points and now indicates 40.4, representing continued expectations of capacity contraction for the next 12 months. While the future Upstream index is at 34.1, the Downstream Transportation Capacity index is at 54.7, and the difference is statistically significant. As such, expectations of strong contraction in future Transportation Capacity remain very strong Upstream, while mild expansion in Transportation Capacity is expected downstream in the US economy.

The Transportation Utilization Index dropped a mere .1 points, indicating 69.5 in May 2026. With this small decrease, the utilization index remains very close to the two-year high mark, and 16.9 points higher than the same time last year. The Downstream Transportation Utilization Index is now at 60.9, while the Upstream index indicates 73.9, and the difference is statistically significant. As such, it can be concluded that the increase in Transportation Utilization remains much stronger Upstream than Downstream.
The future Transportation Utilization Index decreased 4.3 points and is indicating 70.2 points for the next 12 months. The future Upstream Transportation Utilization index is at 70.1, and the Downstream index at 71.0, but the difference is not statistically significant. As such, the expectation of increased Transportation Utilization spread across the US economy, both Upstream and Downstream.

The Transportation Prices Index increased by another point from the previous reading and recorded 96.0 in May 2026. With this increase, the Transportation Prices Index has established a new all-time record. While the Upstream Transportation Prices Index is at 96.3, the Downstream index is at 95.3, but the difference is not statistically significant. As such, it can be concluded that the inflationary pressure on Transportation Prices is being felt extremely strongly across the US economy.
The future index for Transportation Prices decreased 2.5 points, indicating 91.4 and continuing to represent extremely high expectations of price increases for the next 12 months. The Upstream future Transportation Prices index is at 92.5, while the Downstream Transportation Prices index is at 88.7, but the difference is not statistically significant. Therefore, inflationary expectations in Transportation Prices remain very strong across the US supply chains, both Upstream and Downstream.

The data presented herein are obtained from a survey of logistics supply executives based on information they have collected within their respective organizations. LMI® makes no representation, other than that stated within this release, regarding the individual company data collection procedures. The data should be compared to all other economic data sources when used in decision-making.
Data and Method of Presentation
Data for the Logistics Manager’s Index is collected in a monthly survey of leading logistics professionals. The respondents are CSCMP members working at the director-level or above. Upper-level managers are preferable as they are more likely to have macro-level information on trends in inventory, warehousing, and Transportation trends within their firm. Data is also collected from subscribers to both DC Velocity and Supply Chain Exchange as well. Respondents hail from firms working on all six continents, with the majority of them working at firms with annual revenues over a billion dollars. The industries represented in this respondent pool include, but are not limited to: Apparel, Automotive, Consumer Goods, Electronics, Food & Drug, Home Furnishings, Logistics, Shipping & Transportation, and Warehousing.
Respondents are asked to identify the monthly change across each of the eight metrics collected in this survey (Inventory Levels, Inventory Costs, Warehousing Capacity, Warehousing Utilization, Warehousing Prices, Transportation Capacity, Transportation Utilization, and Transportation Prices). In addition, they also forecast future trends for each metric ranging over the next 12 months. The raw data is then analyzed using a diffusion index. Diffusion Indexes measure how widely something is diffused or spread across a group. The Bureau of Labor Statistics has been using a diffusion index for the Current Employment Statics program since 1974, and the Institute for Supply Management (ISM) has been using a diffusion index to compute the Purchasing Managers Index since 1948. The ISM Index of New Orders is considered a Leading Economic Indicator.
We compute the Diffusion Index as follows:
PD = Percentage of respondents saying the category is Declining,
PU = Percentage of respondents saying the category is Unchanged,
PI = Percentage of respondents saying the category is increasing,
Diffusion Index = 0.0 * PD + 0.5 * PU + 1.0 * PI