LMI® at 56.7%, Growth is INCREASING at in Increasing rate for: Inventory Costs, Growth is Increasing at a decreasing rate for: Inventory Levels, Warehousing Utilization, Warehousing Prices, Transportation Utilization and Transportation Capacity
According to a sample of North American logistics executives, growth continued (although at a decreasing rate) across the logistics sector in May 2019. Warehouse Capacity and Transportation Prices are DECREASING. The other six metrics reported growth in May, although Inventory Costs are the only metric displaying an increasing rate of growth. This is the first time in the history of the LMI® that Transportation Price, which had often been the highest-scoring metric, has reported a decrease. This is the seventh consecutive drop in the overall LMI, and the lowest score measured in the history of the index. The LMI® is down significantly from this time a year ago, when it registered at 72.6. With that being said, May’s score of 56.7 is still above 50.0, which indicates growth (albeit at a decreasing rate).
Researchers at Arizona State University, Colorado State University, Rochester Institute of Technology, Rutgers University, and the University of Nevada, Reno, and in conjunction with the Council of Supply Chain Management Professionals (CSCMP) issued this report today.
Results Overview
The LMI score is a combination eight unique components that make up the logistics industry, including: inventory levels and costs, warehousing capacity, utilization, and prices, and transportation capacity, utilization, and prices. The LMI is calculated using a diffusion index, in which any reading above 50 percent indicates that logistics is expanding; a reading below 50 percent is indicative of a shrinking logistics industry. The latest results of the LMI summarize the responses of supply chain professionals collected in May 2019.
This month, there is not much movement in the inventory metrics. Inventory Levels (-0.17) are at 62.2 and are growing at virtually the same rate as they were in April. Inventory Costs (+1.85) registered at 72.55, which is the highest index score of any of the LMI® metrics this month. Warehouse Capacity (-1.14) continues to contract, with an index score of 48.1 indicating that opportunities for available warehousing remains tight. Warehouse Prices register at 70.6, which is the exact score from April 2019. The lack of availability may be the primary factor driving these steady rates of growth. Interestingly, the rate of growth for Warehouse Utilization is 58.57 and has dropped significantly (-9.51) from April.
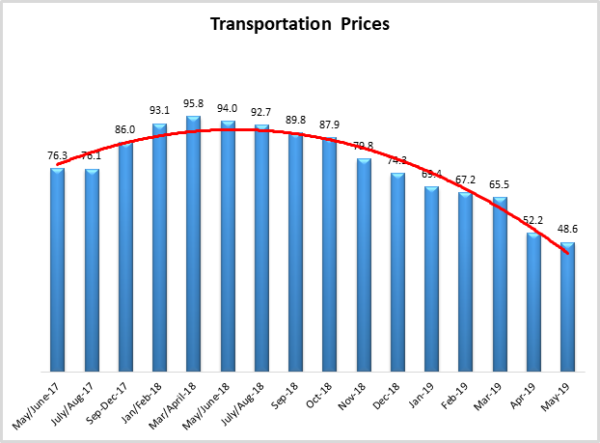
Transportation metrics have been the most dynamic over the history of the LMI®. With an index score of 48.6, Transportation Prices (-3.58) are contracting for the time in the history of the LMI®. This is a far cry from May 2018 when this metric was growing a rate of 94.0. The change index used by the LMI® ranges from 0-100, so to go from growing at essentially the fastest rate possible to contracting in the span of 12 months suggests a significant shift in the market. This decrease came with Transportation Capacity (-4.73) still reporting solid (if slightly decreased) rates of growth at 67.29.
As was speculated in last month, there may have been an inflection point in April 2019, with the rate of growth in Transportation Capacity surpassing that of Transportation Prices (which is not contracting). In March/April 2018, the index score for Transportation Price was 65 points higher than for Transportation Capacity. Today, Capacity is higher by 18.7 points.
The index scores for each of the eight components of the Logistics Managers’ Index, as well as the overall index score, are presented in the table below. six of the eight components are either at or above 50.0, with Transportation Prices and Warehousing Capacity currently contracting. The overall LMI® index score is down to its lowest point in the history of the index, but still indicates growth in the logistics industry.
| LOGISTICS AT A GLANCE | ||||||
| Index | April 2019 Index | March 2019 Index | Month-Over-Month Change | Projected Direction | Rate of Change | |
| LMI® | 56.7 | 57.9 | -1.25 | Growing | Decreasing | |
| Inventory Levels | 62.4 | 62.3 | -0.17 | Growing | Increasing | |
| Inventory Costs | 72.55 | 70.7 | +1.85 | Growing | Increasing | |
| Warehousing Capacity | 48.1 | 49.2 | -1.14 | Contracting | Decreasing | |
| Warehousing Utilization | 58.57 | 68.1 | -9.51 | Growing | Increasing | |
| Warehousing Prices | 70.59 | 70.6 | 0.00 | Growing | Decreasing | |
| Transportation Capacity | 67.29 | 72.0 | -4.73 | Growing | Increasing | |
| Transportation Utilization | 56.54 | 61.0 | -4.44 | Growing | Decreasing | |
| Transportation Prices | 48.60 | 52.2 | -3.58 | Contracting | From Increasing | |
Future predictions indicate that respondents predict an increase in all eight LMI® metrics over the next 12 months. Over the past two year LMI® respondents have been very accurate in their future predictions. Whether or not this period’s dip in growth rates will have an impact on this accuracy remains to be seen. Future predictions for LMI components 12 months from now are displayed below:
Historic Logistics Managers’ Index Scores
This period’s along with all prior readings of the LMI are presented table below. The values have been updated to reflect the method for calculating the overall LMI:
| Month | LMI | Average for previous readings – 64.9
High – 75.71 Low – 56.7 Std. Dev – 5.19 |
| May’19 | 56.7 | |
| April ‘19 | 57.9 | |
| March ‘19 | 60.41 | |
| February ‘19 | 61.95 | |
| January ‘19 | 63.33 | |
| December ‘18 | 63.54 | |
| November ‘18 | 66.98 | |
| October ‘18 | 71.20 | |
| September ‘18 | 70.80 | |
| July/August ‘18 | 70.80 | |
| May/June ‘18 | 72.55 | |
| March/April ‘18 | 75.71 | |
| January/February‘18 | 68.89 | |
| September-December ‘17 | 70.09 | |
| July/August ‘17 | 63.64 | |
| May/June ‘17 | 62.02 | |
| Mar/April ‘17 | 60.76 | |
| Jan/Feb ‘17 | 61.69 | |
| Nov/Dec ‘16 | 61.79 | |
| Oct ‘16 | 60.36 | |
| Sep ‘16 | 60.70 |
LMI®
The overall LMI index is 56.7 in the May 2019 reading, down from April’s index score of 57.9. This is also down considerably from a year ago when the LMI overall score was 72.6. It has trended down since then, with rates of growth decreasing in every period since October 2018 and this month’s reading is the lowest in the history of the index. This month’s decrease seems to be primarily driven by decreasing rates of growth in Warehouse Utilization and Transportation Utilization, as well as contraction in Warehouse Capacity and Transportation Prices.
While May 2019’s LMI is the lowest overall score in the history of the index, the score of 56.7 is still above 50.0, the threshold indicating growth. So the logistics industry is still growing, but it is doing so at the slowest rate since the inception of this index in September 2016.
Looking forward, respondents predict the overall LMI will continue to grow over the next year, predicting an overall index score of 58.6. This indicates an expectation of similar levels of steady, if unspectacular growth, in the logistics industry through early 2020.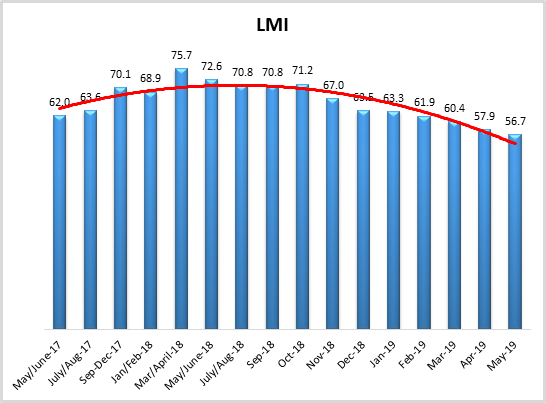
Inventory Levels
The Inventory Level index is 62.14, which indicates that inventory levels are continuing to rise, only 0.1 points below the previous level, indicating no significant change. This value is 7.1 points below the level a year ago at this time, which was one period after the highest value recorded for the index. As all values above 50 indicate growing inventory levels, the string of uninterrupted growth that started in November/December of 2016 continues. The current reading of 62.14 is only slightly below the all-time average value for this metric, which is 63.3.
The long-term trend-line shows a gradual falling, but levels are not expected to fall below 50 any time soon. With the exception of March, 2019, every value in the past two years has been above 60, so growth seems to remain low, but consistent. When asked to predict what will conditions will be like 12 months from now, the average value is 62.1, indicating inventory levels are expected to continue to grow. This value is slightly below last month’s year-ahead prediction of 64.0, but still consistent with a prediction of increasing levels next year.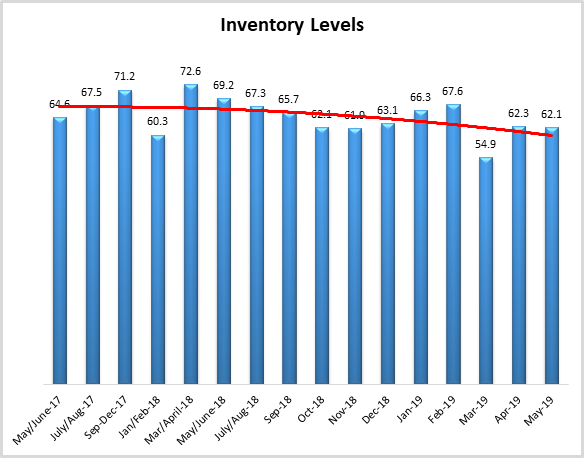
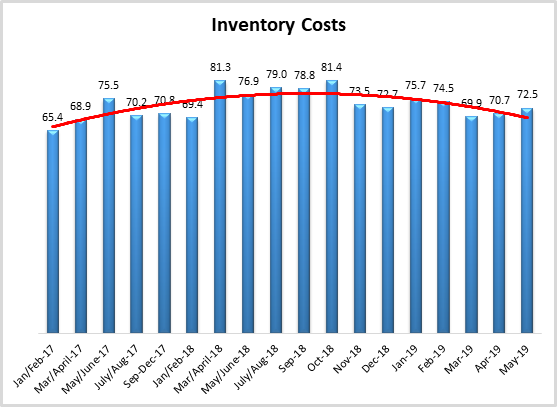
Inventory Costs
Given the continued levels of inventory growth, it is not surprising that inventory costs continue to increase. The current value is 72.55, a slight increase from the previous reading of 70.7. These continued high levels indicate strong continued growth in inventory costs, and at a higher level than the first year and a half of the data. The current value is 4.4 points lower than the 76.9 value last year at this time. The current value is approximately equal to the long-term average of 72.4.
The trend line shows cost growth increasing over the first half, and falling over the second half. However, this long-term trend line appears to be largely driven by the unusually high values from March to October 2018. If those unusually high values are removed, the trend line becomes almost perfectly flat. Taking this graph and the previous graph of inventory values together, inventory levels are continuing to grow, though at a slower rate, and inventory costs continue to grow.
Respondents agree with this analysis. When asked about what they expect inventory costs to be like 12 months from now, the index value is 72, relatively unchanged over last month’s value of 73.8. Respondents clearly expect inventory costs to continue to be high for the next 12 months.
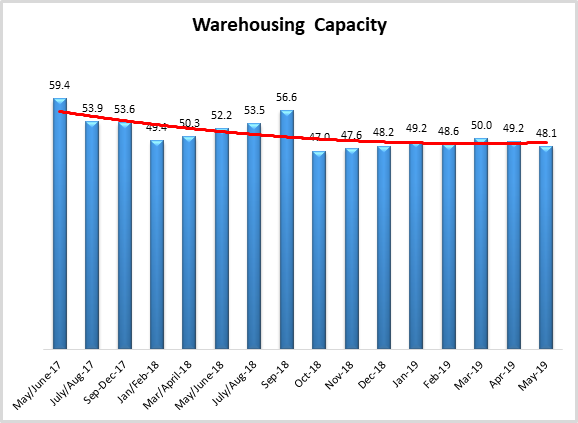
Warehousing Capacity
The Warehousing Capacity Index registered 48.1 percent in May 2019. This represents a slight decrease (1.1%) from the April 2019 reading and a 4.1-point decrease from the reading one year. Also of note, this reading is down sharply down from the Jan/Feb 2017 high of 59.5. The results indicate that warehousing capacity is continuing to contract, now for the 8th straight month. That being said, available capacity has been remarkably consistent in 2019, with a total range of 1.9 points (50.0 in Marcy to 48.1 in May) in our index.
Looking forward at the next 12 months, the predicted Warehousing Capacity index is 55.7, which is up slightly from April’s prediction (57.4). This is close to the break-even of 50.0, indicating that respondents are not hopeful we will see significant gains in available capacity over the next 12 months.
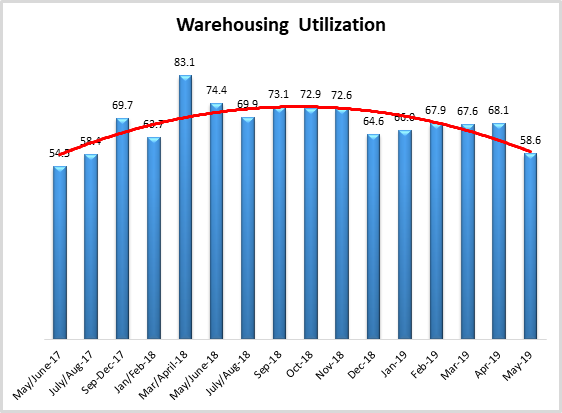
Warehousing Utilization
The Warehousing Utilization Index registered 58.57 percent in May 2019. This is a rather precipitous decline of nearly 10 percentage points from April 2019, and still a very sharp decline of over 24 percentage points from the March/April 2018 reading of 83.1. This is the third month in a row in increased utilization overall, though the sharp decline in the rate of growth may indicate a shift in the market.
Looking forward at the next 12 months, the predicted Warehousing Utilization index is 66.0, down from April’s prediction (70.8), indicating that firms anticipate utilizing existing warehouse capacity consistently over the next year.
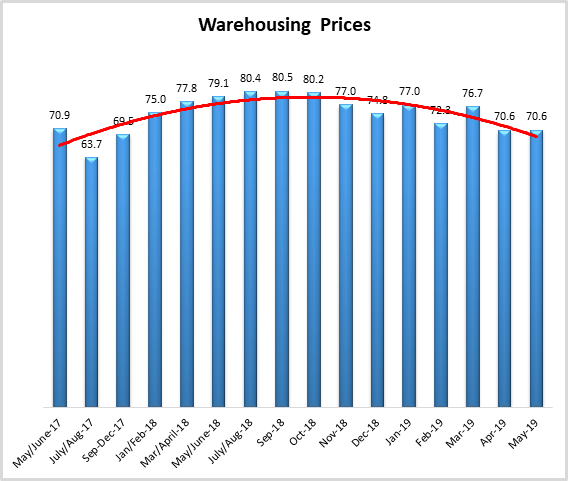
Warehousing Prices
Finally, the Warehousing Prices Index registered 70.59 percent in May 2019. This is virtually unchanged from the April reading of 70.6. This reading is down just under 9 points from one year ago. With the continued contracting of the warehousing capacity, the increase in utilization (though at a decreasing rate), this continued increase in the rate of price suggests that there is pressure in the warehousing market. Readings suggest that the price of warehousing will continue to increase, though this potential increase could be countered if utilization continues to decrease.
Looking forward at the next 12 months, the predicted Warehousing Prices index is 72.1, which is up from April’s prediction (70.7). This indicates that firms are expecting consistent, significant growth in Warehouse Prices over the next 12 months.
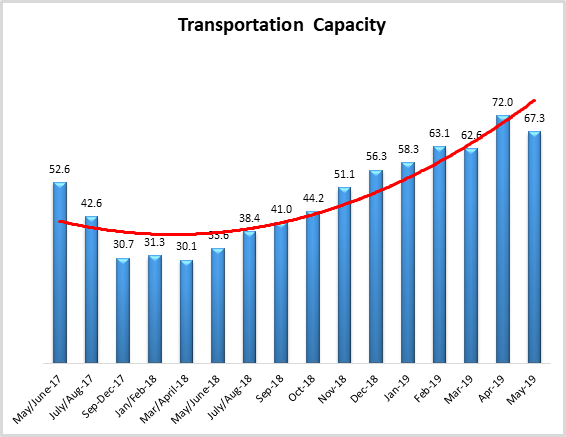
Transportation Capacity
The Transportation Capacity Index registered 67.3 percent in May 2019. This is a decrease of 4.7 percentage points from the April reading of 72.0. Although the growth rate of available Transportation Capacity has fluctuated in 2019, the fact that it continues grow has remained constant. This month’s index score is more than double that of May/June 2018 when it was contracting at a rate of 33.6.
It should be noted the data also indicates a score of 64.5 percent for the next year. This is consistent with the current reading and is a 2.1 percent decrease in future expectations when compared to April data.
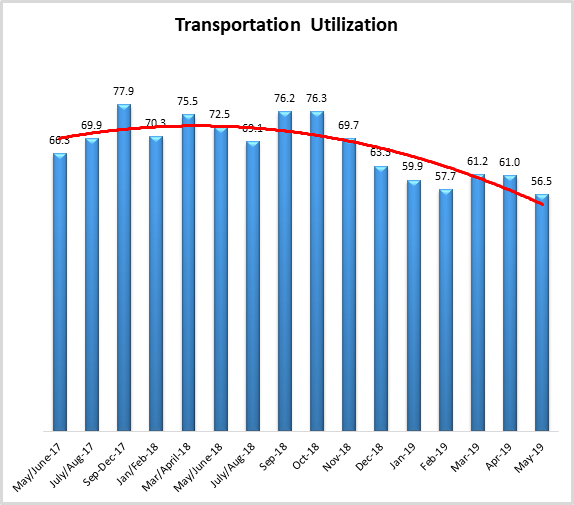
Transportation Utilization
The Transportation Utilization Index registered 56.5 percent in May 2019. This is a decrease of 5.5 percentage points from the April reading of 61.0. This score indicates a continuing expansion trend in Transportation Utilization, and the downward trend in the rate of the increase appears to have stopped.
Our future Transportation Utilization Index also indicates a 57.0 percent level for the next 12 months. Future expectations are 5.1 percent higher than their April levels.
Transportation Prices
The Transportation Prices Index registered 48.6 percent in May 2019. This is 3.6 points lower than the March 2019 transportation prices reading of 52.2. Transportation Prices Index is continuing to come off its historical highs, with the latest reading being the eleventh consecutive decrease from the all-time high registered in March-April 2018. This stark drop is demonstrated clearly in the downward slope of the trend-line below. May 2019’s reading is the lowest Transportation Price index score in the history of the LMI®, as well as the first time it has been reported as contracting. Transportation Prices have been an early economic indicator in the past, whether this portends anything about the overall economy remains to be seen.
Conversely, the future expectations for Transportation Prices are at 60.2 percent, which suggests that this dip in prices may be a short-term trend.