- LMI® at 56.0%
- Growth is INCREASING AT AN INCREASING RATE for: Inventory Levels and Warehousing Utilization.
- Growth is INCREASING AT A DECREASING RATE for: Inventory Costs, Warehousing Prices, Transportation Utilization and Transportation Capacity.
- Warehouse Capacity and Transportation Prices have gone from DECREASING to INCREASING.
According to a sample of North American logistics executives, growth continued (although at a decreasing rate) across the logistics sector in June 2019. Warehouse Capacity and Transportation Prices are DECREASING. The other six metrics reported growth in May, although Inventory Costs are the only metric displaying an increasing rate of growth. This is the first time in the history of the LMI® that Transportation Price, which had often been the highest-scoring metric, has reported a decrease. This is the seventh consecutive drop in the overall LMI, and the lowest score measured in the history of the index. The LMI® is down significantly from this time a year ago, when it registered at 72.6. With that being said, May’s score of 56.7 is still above 50.0, which indicates growth (albeit at a decreasing rate).
Researchers at Arizona State University, Colorado State University, Rochester Institute of Technology, Rutgers University, and the University of Nevada, Reno, and in conjunction with the Council of Supply Chain Management Professionals (CSCMP) issued this report today.
Results Overview
The LMI score is a combination eight unique components that make up the logistics industry, including: inventory levels and costs, warehousing capacity, utilization, and prices, and transportation capacity, utilization, and prices. The LMI is calculated using a diffusion index, in which any reading above 50 percent indicates that logistics is expanding; a reading below 50 percent is indicative of a shrinking logistics industry. The latest results of the LMI summarize the responses of supply chain professionals collected in June 2019.
Transportation metrics have been the most dynamic over the history of the LMI®. Transportation Prices were detracting last month, but are up slightly (+2.4) and reading in as increasing (though somewhat feebly) at a rate of 51.0. While this is a slight increase from May, it is a far cry from a year ago when this metric was growing a rate of 94.0. The change index used by the LMI® ranges from 0-100, so to go from growing at essentially the fastest rate possible to anemic movement in the span of 12 months suggests a significant shift in the market. This lack of growth, along with a steep drop in Transportation Utilization (-5.0) corroborate recent reports of slowing freight markets[1][2] This decrease came with Transportation Capacity (-4.73) still reporting solid (if slightly decreased) rates of growth at 67.29.
Warehouse Prices are down (-5.47) sharply to 65.1. They are still growing but at a decreased rate. This dip in price is likely related to the significant increase in Warehouse Capacity (+6.25); June’s score of 54.3 indicates significant growth in available Warehousing for the first time since September 2018. Interestingly, the rate of growth for Warehouse Utilization is 64.2, which is up (+5.56) from May. The Warehousing metrics seem to suggest that capacity is becoming available for the first time, increasing utilization and slowing the growth in price. Finally, Inventory Levels (+2.4) are at 64.5 and are growing steadily. Inventory Costs (-1.35) registered at 71.2, which is the highest index score of any of the LMI® metrics for the second consecutive month.
The index scores for each of the eight components of the Logistics Managers’ Index, as well as the overall index score, are presented in the table below. All eight metrics are up, but many are moving at low or considerably decreased rates. The overall LMI® index score is down to its lowest point in the history of the index, but still indicates growth in the logistics industry.
| LOGISTICS AT A GLANCE | ||||||
| Index | June 2019 Index | May 2019 Index | Month-Over-Month Change | Projected Direction | Rate of Change | |
| LMI® | 56.0 | 56.7 | -0.72 | Growing | Decreasing | |
| Inventory Levels | 64.5 | 62.4 | +2.38 | Growing | Increasing | |
| Inventory Costs | 71.2 | 72.55 | -1.35 | Growing | Decreasing | |
| Warehousing Capacity | 54.3 | 48.1 | +6.25 | Growing | From Decreasing | |
| Warehousing Utilization | 64.1 | 58.57 | +5.56 | Growing | Increasing | |
| Warehousing Prices | 65.1 | 70.59 | -5.47 | Growing | Decreasing | |
| Transportation Capacity | 67.29 | 67.29 | -1.98 | Growing | Decreasing | |
| Transportation Utilization | 51.5 | 56.54 | -5.00 | Growing | Decreasing | |
| Transportation Prices | 51.0 | 48.60 | +2.39 | Growing | From Decreasing | |
Future predictions indicate that respondents predict an increase in all eight LMI® metrics over the next 12 months. Over the past two years, LMI® respondents have been very accurate in their future predictions. Future predictions for LMI components 12 months from now are displayed below:
Historic Logistics Managers’ Index Scores
This period’s along with all prior readings of the LMI are presented table below. The values have been updated to reflect the method for calculating the overall LMI:
| Month | LMI | Average for previous readings – 64.4
High – 75.71 Low – 56.0 Std. Dev – 5.40 |
| June ‘19 | 56.0 | |
| May’19 | 56.7 | |
| April ‘19 | 57.9 | |
| March ‘19 | 60.41 | |
| February ‘19 | 61.95 | |
| January ‘19 | 63.33 | |
| December ‘18 | 63.54 | |
| November ‘18 | 66.98 | |
| October ‘18 | 71.20 | |
| September ‘18 | 70.80 | |
| July/August ‘18 | 70.80 | |
| May/June ‘18 | 72.55 | |
| March/April ‘18 | 75.71 | |
| January/February‘18 | 68.89 | |
| September-December ‘17 | 70.09 | |
| July/August ‘17 | 63.64 | |
| May/June ‘17 | 62.02 | |
| Mar/April ‘17 | 60.76 | |
| Jan/Feb ‘17 | 61.69 | |
| Nov/Dec ‘16 | 61.79 | |
| Oct ‘16 | 60.36 | |
| Sep ‘16 | 60.70 |
LMI®
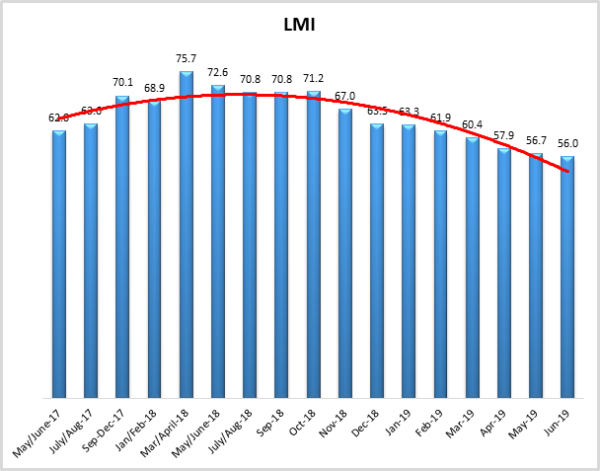
The overall LMI index is 56.0 in the June 2019 reading, down very slightly from May’s index score of 56.7. This is also down considerably from a year ago when the LMI overall score was 72.6. It has trended down since then, with rates of growth decreasing in every period since October 2018 and this month’s reading is the lowest in the history of the index – the fourth consecutive month that this index has reached a new nadir. This month’s decrease seems to be primarily driven by decreasing rates of growth in Warehouse Prices, Transportation Capacity and Transportation Utilization, as well slightly improved but still very low rate of growth for Transportation Prices.
While June’s 2019’s LMI is the lowest overall score in the history of the index, the score of 56.0 is still above 50.0, the threshold indicating growth. So the logistics industry is still growing, but it is doing so at the slowest rate since the inception of this index in September 2016. This slowdown is demonstrated by the trend-line in the figure below.
Looking forward, respondents predict the overall LMI will continue to grow over the next year, predicting an overall index score of 58.6. This indicates an expectation of similar levels of steady, if unspectacular growth, in the logistics industry through early 2020.
Inventory Levels
The Inventory Level index is 64.5, which indicates that inventory levels are continuing to rise. The current value is 2.4 points above the previous level, indicating a slight change in the amount of increase. This value is 4.7 points below the level a year ago at this time, The index declined for most of the remainder of 2018, and except for one reading, has remained in the low to mid-60s for the past year, indicating continued growth.
When asked to predict what will conditions will be like 12 months from now, the average value is 58.6, indicating inventory levels are expected to continue to grow. This value is slightly below last month’s year-ahead prediction of 62.1, but still consistent with a prediction of increasing levels next year.
Inventory Costs
Given the continued levels of inventory growth, it is not surprising that inventory costs continue to increase. The current value is 71.2, with respondents indicating that inventory costs have continued to climb, significantly. The current value is a very slight decrease from the previous reading of 72.5. These continued high levels indicate strong continued growth in inventory costs, and are almost identical to the long-term average of 72.4. That being said, the current value is 5.7 points lower than the 76.9 value last year at this time.
Respondents agree with this analysis. When asked about what they expect inventory costs to be like 12 months from now, the index value is 69.8, a slight decrease over last month’s value of 72. Respondents clearly expect inventory costs to continue to be high for the next 12 months.
Warehousing Capacity
The Warehousing Capacity Index registered 54.3 percent in June 2019. This represents a rather sharp increase of 6.2 points from the May 2019 reading and a 2.1 point increase from the reading one year ago. Also of note, this reading is in line with previous readings during this time, which may indicate a seasonality in the early part of the summer(s). This reading indicates that the previous trend of 8 straight months of contraction has been broken. Whether this is an aberration, or represents a sea-change from the
Looking forward at the next 12 months, the predicted Warehousing Capacity index is 57.5, which is up slightly from May’s prediction (55.7) which is up slightly from April’s prediction (57.4).
Warehousing Utilization
The Warehousing Utilization Index registered 64.1 percent in June 2019. This is a rather sharp increase of nearly 6 percentage points from May 2019, and over 10 points down from the May/June 2018 reading of 74.4. This reading counteracts previous indications that the sharp decline in the rate of growth may indicate a shift in the market, and suggests a tightening in the utilization of warehousing.
Looking forward at the next 12 months, the predicted Warehousing Utilization index is 68.1, up slightly from May’s prediction (66.0), indicating that firms anticipate utilizing existing warehouse capacity consistently over the next year.
Warehousing Prices
Warehousing Prices Index registered 65.1 percent in June 2019. This is down 5.5 points from the May reading of 70.6. This reading is sharply down 14 points from one year ago. With the increase of the warehousing capacity, the increase in utilization, this continued decrease in the rate of price suggests that the market is responding to previous pressure in the warehousing market through price augmentation.
Looking forward at the next 12 months, the predicted Warehousing Prices index is 68.0, which is down slightly from May’s prediction (72.1). This indicates that firms are expecting some growth in Warehouse Prices over the next 12 months.
Transportation Capacity
The Transportation Capacity Index registered 65.3 percent in June 2019. This is a decrease of 2 percentage points from the May reading of 67.3. This is the second consecutive decrease since the historical high registered in April 2019. This month’s index score is nearly double that of May/June 2018 when it was contracting at a rate of 33.6.
It should be noted the data also indicates a score of 58.8 percent for the next year. This is consistent with the current reading and is down very slight (-0.8) percent decrease in future expectations when compared to May data.
Transportation Utilization
The Transportation Utilization Index registered 51.5 percent in June 2019. This is a decrease of 5 percentage points from the May reading of 56.5. the 51.5 percent reading is the lowest level ever recorded in Transportation utilization and it is very close to our benchmark level of 50 that denotes the inflection point from growth to decline.
Our future Transportation Utilization Index also indicates a 59.9 percent level for the next 12 months. Future expectations are 2.9 percent higher than their May levels.
Transportation Prices
The Transportation Prices Index registered 51.0 percent in June 2019. This is 2.4 percent higher than the May 2019 transportation prices reading of 48.6, which was a historical low in Transportation Prices. This month’s reading indicates that Transportation Prices are up very slightly but are essentially holding steady from May. June 2019’s reading is 43.4 points reading lower than June 2018’s.
The future expectations for transportation prices are at 58.9 indicating modest growth over the next 12 months. Future expectations are 1.3 percent higher than their May levels.


