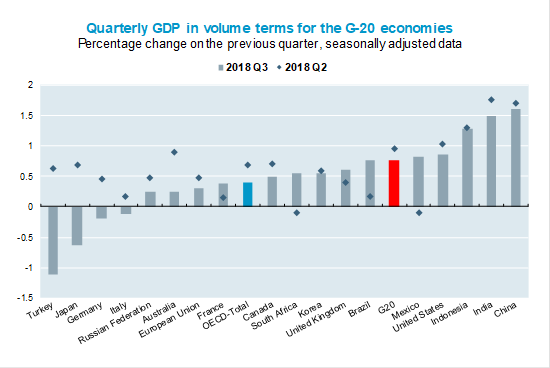
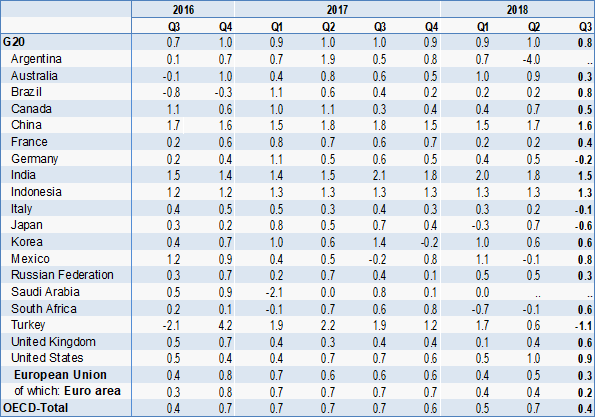
Growth of real gross domestic product (GDP) in the G20 area eased to 0.8% in the third quarter of 2018, compared with 1.0% in the previous quarter, according to provisional estimates.
GDP contracted in four G20 countries in the third quarter of 2018, following growth in the previous quarter. Turkey recorded the sharpest contraction (minus 1.1%), on the back of the Lira’s significant depreciation in August, followed by Japan (minus 0.6%, compared with 0.7% in the previous quarter), Germany (minus 0.2%, compared with 0.5%) and Italy (minus 0.1%, compared with 0.2%).
GDP growth slowed in a majority of the remaining G20 economies for which data are available. Growth slowed significantly in Australia (to 0.3%, from 0.9%), and, to a lesser extent, in India (to 1.5%, from 1.8%), Canada (to 0.5%, from 0.7%), Russia (to 0.3%, from 0.5%), China (to 1.6%, from 1.7%) and the United States (to 0.9, from 1.0%). It also slowed in the European Union (to 0.3%, from 0.5%).
On the other hand, growth rebounded in Mexico and South Africa, to 0.8% and 0.6%, respectively in the third quarter of 2018, following a contraction of 0.1% in the previous quarter in both countries. Growth also picked-up significantly in Brazil (to 0.8%, from 0.2%), and, to a lesser extent, in the United Kingdom (to 0.6%, from 0.4% in the previous quarter, albeit latest estimates for the UK for October point to a slowdown from Q3) and France (to 0.4%, from 0.2%). GDP growth was stable in Indonesia (1.3%) and Korea (0.6%).
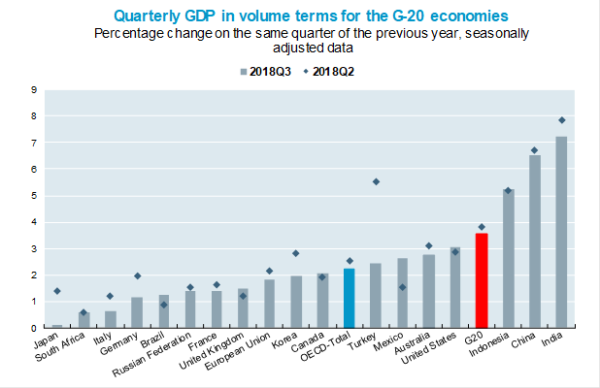
Year-on-year GDP growth for the G20 area slowed to 3.6% in the third quarter of 2018 (from 3.8% in the previous quarter), with India recording the highest growth (7.2%) and Japan the lowest (0.1%).
Technical note for G20 GDP News Release: G20 GDP growth in volume
Gross Domestic Product (GDP) is the standard measure of the value of the goods and services produced by a country during a reference period. The estimate of GDP growth for the G20 aggregate is produced by the OECD Secretariat. It is based on quarterly seasonally adjusted data reported by G20 countries and Eurostat, and, if country data are not available, on estimates from the OECD’s Secretariat.
Country notes
The statistical data in this publication are supplied by and under the responsibility of the relevant statistical authorities. The use of such data by the OECD is without prejudice to the status of or sovereignty over any territory, or to the delimitation of international frontiers and boundaries.
China – China is part of the G20 aggregate for all quarters. Data shown in the tables correspond to official figures from the National Bureau of Statistics of China (NBS). Quarterly data used to compile the G20 aggregate are based on estimates from the OECD’s Economics Department, which are not shown in the tables.
Russian Federation – The Russian Federal State Statistics Service (Rosstat) has implemented the 2008 SNA in its System of National Accounts in the beginning of April 2016 and since July 2017 it has released time series according to the 2008 SNA back to 2011.
Saudi Arabia – Data is compiled by the “General Authority for Statistics, Kingdom of Saudi Arabia” and provided to the OECD by the IMF.
The seasonally adjusted data includes a working-day correction for all G20 countries except Argentina, Brazil, China, India, Indonesia, Saudi Arabia and South Africa. When seasonally adjusted national data are not available, data are adjusted by the OECD’s Statistics Directorate with the TRAMO/SEATS method; this is the case for Argentina, India, Indonesia and Saudi Arabia. Figures for the G20 aggregate are calculated from seasonally adjusted data of the countries (i.e. the indirect method). Growth over the previous quarter is not annualized in this News Release. The charts presented in this News Release are based on data with more than one decimal.
Growth rates for the G20 are derived from chained volume estimates in US dollars converted using 2010 Purchasing Power Parities (PPPs) of GDP.
Implementation of SNA 2008 / ESA 2010 methodology
Quarterly national accounts data are compiled according to the new SNA 2008 / ESA 2010 standards by all the countries in the G20 area except Saudi Arabia.
Find more information on the change of methodology and its impact on GDP at the following link: http://www.oecd.org/sdd/na/sna-2008-main-changes.htm
Country coverage
The G20 consists of the following: Argentina, Australia, Brazil, Canada, China, France, Germany, India, Indonesia, Italy, Japan, Korea, Mexico, the Russian Federation, Saudi Arabia, South Africa, Turkey, the United Kingdom, the United States, and the European Union.
The G20 aggregate is calculated taking the fifteen individual country members of the G20 (other than France, Germany, Italy and the United Kingdom) plus the European Union as an aggregate.
Further information
Further methodological information can be downloaded from: http://www.oecd.org/sdd/na/G20QuarterlyGDPGrowth_Methodology.pdf
Working with over 100 countries, the OECD is a global policy forum that promotes policies to improve the economic and social well-being of people around the world.