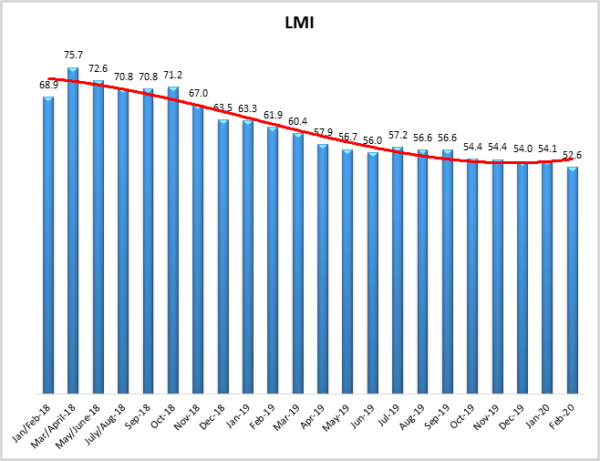
LMI® at 52.6%
Growth is INCREASING AT AN INCREASING RATE for Warehousing Capacity, Warehousing Utilization, and Transportation Utilization.
Growth is INCREASING AT A DECREASING RATE for Inventory Costs, Warehousing Prices, and Transportation Capacity
Transportation Prices and Inventory Levels are CONTRACTING
According to a sample of North American logistics executives, growth continued in February, but at a lower rate (-1.50) than in January 2020, and the lowest score we’ve recorded in the history of the index, reading in at 52.6, down from last month’s reading of 54.1.
The overall LMI score of 52.6 is down (-10.1) from this time a year ago when it registered at 63.3. The lowest eleven scores in the history of the index have all occurred within the last eleven months. However, it should be pointed out that every score has been above 50.0, indicating growth in the logistics industry, the growth has just been very slow (and has been trending slower). Logistics metrics, especially those involving transportation and inventory, are global in nature. The negative turn in both Transportation Prices and Inventory Levels may be partially attributable to the outbreak of the Coronavirus. While the effects of the virus became stronger in the U.S. near the end of February, it is worth pointing out that the bulk of this month’s responses came in after February 21st, meaning the Coronavirus and its effects are somewhat reflected in this report.
Researchers at Arizona State University, Colorado State University, Rochester Institute of Technology, Rutgers University, and the University of Nevada, Reno, and in conjunction with the Council of Supply Chain Management Professionals (CSCMP) issued this report today.
Results Overview
The LMI score is a combination of eight unique components that make up the logistics industry, including inventory levels and costs, warehousing capacity, utilization, and prices, and transportation capacity, utilization, and prices. The LMI is calculated using a diffusion index, in which any reading above 50 percent indicates that logistics is expanding; a reading below 50 percent is indicative of a shrinking logistics industry. The latest results of the LMI summarize the responses of supply chain professionals collected in February 2019. Six of the eight metrics read below their historical average. Only Warehouse Capacity and Transportation Capacity show growth in this reading. This is crucial as these two metrics generally move inversely with economic growth (more warehousing/transportation available = lower demand).
Transportation metrics continue to be the most dynamic measures in LMI®. Transportation Prices are down 1.02 points to 48.9, indicating contraction during February. This is down 18.2 points from this time a year ago. Conversely, Transportation Capacity, reads in at 55.1, down from January but still showing an increase in the level of transportation services available. It is interesting that we still see growth in Transportation Capacity even with the number of 3PLs that have recently closed[1]. This may be partially attributable to the influence of the Coronavirus. Transportation Utilization is back into growth territory this month (+4.8) after two straight readings of contraction. Prices are down and capacity is up, so it follows that the utilization of available transportation services is up slightly.
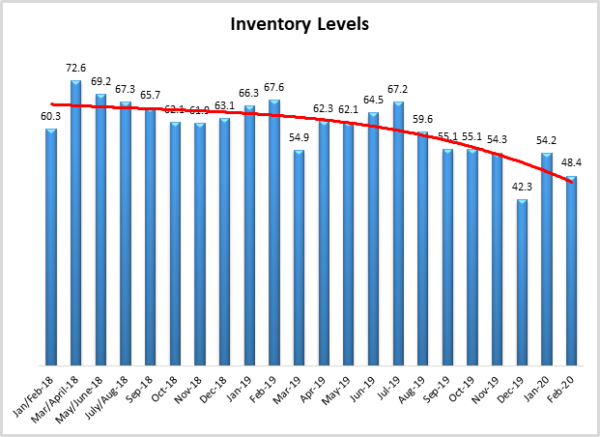
Inventory Levels are back into negative territory at 48.4. This is down (-5.86) from January and back to reading in as contraction after a slight reprieve in January. For three of the last four months inventory has been contracting. Inventories were up in January, likely as firms built stocks back up after the holiday season. Whether they will continue to trend down or if this is an aberration related to the Coronavirus remains to be seen. Inventory Costs are also down (-4.33) to 61.8. This is 12.7 points down from this time last year.
Warehousing Capacity is up again (+6.02) to 60.8, this is the first time this metric has moved into the ’60s. This seems to corroborate estimates that capacity would be up in the beginning of 2020[2] CITE. Those same estimates projected that this surplus would disappear by mid-year. We will continue to monitor this metric and see if that prediction holds true. With the higher capacity, it is no surprise that Warehousing Prices are down (-3.98) for the second consecutive month to 65.9. While this is down, it still demonstrates strong levels of growth. Finally, Warehouse Utilization is up somewhat (+2.33), reading in at 60.7 and leaving all three Warehousing metrics with strong growth scores in the 60’s.
The index scores for each of the eight components of the Logistics Managers’ Index, as well as the overall index score, are presented in the table above. Six of the eight metrics show signs of growth, but many of them are moving at low or considerably decreased rates. The overall LMI® index score is at its lowest point in the history of the index. Our reading indicates a continued trend of slowing yet steady growth in the logistics industry.
| LOGISTICS AT A GLANCE | |||||
| Index | February 2020 Index | January 2020 Index | Month-Over-Month Change | Projected Direction | Rate of Change |
| LMI® | 52.62 | 54.12 | -1.50 | Growing | Decreasing |
| Inventory Levels | 48.35 | 54.21 | -5.86 | Contracting | From Growing |
| Inventory Costs | 61.80 | 66.13 | -4.33 | Growing | Decreasing |
| Warehousing Capacity | 60.75 | 54.74 | 6.02 | Growing | From Flat |
| Warehousing Utilization | 60.75 | 58.42 | 2.33 | Growing | Increasing |
| Warehousing Prices | 65.91 | 69.89 | -3.98 | Growing | Decreasing |
| Transportation Capacity | 55.10 | 57.14 | -2.04 | Growing | Decreasing |
| Transportation Utilization | 51.01 | 46.15 | 4.86 | Growing | From Contracting |
| Transportation Prices | 48.98 | 50.00 | -1.02 | Contracting | From Flat |
For the first time, this month we are including overall scores for both “upstream” and “downstream” respondents. Respondents classified as upstream are those that do not interact directly with consumers. These tend to be warehousing firms, carriers, and manufacturers. Downstream respondents are firms that do interact with consumers, such as retailers.
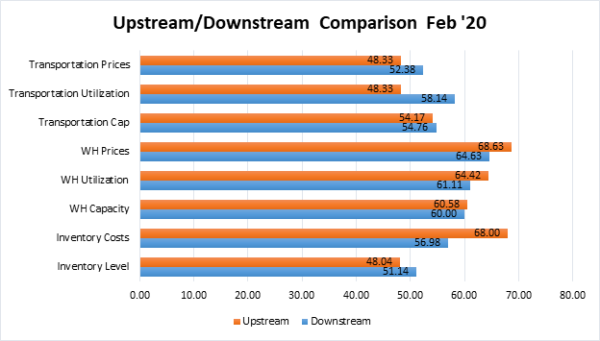 It is clear from the graph that the downstream sector seems to be growing at a slightly stronger rate than the upstream sector, registering positive Inventory Levels and Transportation Prices. This tracks with recent reports showing that consumers are the strong point of the economy relative to manufacturing and industrial output.
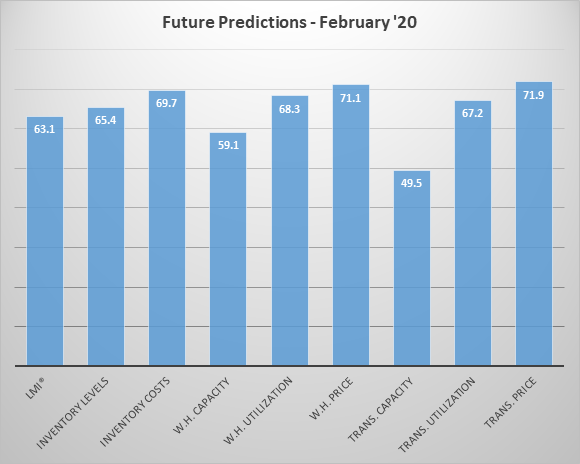
Respondents were asked to predict movement in the overall LMI and individual metrics 12 months from now. Their predictions for future ratings are presented below and, as has become a pattern seem to be somewhat more optimistic than our current readings. Respondents seem to be predicting better times ahead as far as the logistics industry is concerned.
Historic Logistics Managers’ Index Scores
This period’s along with prior readings from the last two years of the LMI is presented in the table below. The values have been updated to reflect the method for calculating the overall LMI:
| Month | LMI | Average for previous readings – 61.9
High – 75.7 Low – 52.6 Std. Dev – 6.3
|
| Feb ‘20 | 52.6 | |
| Jan ‘20 | 54.1 | |
| Dec ‘19 | 54.0 | |
| Nov ‘19 | 54.4 | |
| Oct ‘19 | 54.4 | |
| Sep ‘19 | 56.6 | |
| August ‘19 | 56.6 | |
| July ‘19 | 57.2 | |
| June ‘19 | 56.0 | |
| May’19 | 56.7 | |
| April ‘19 | 57.9 | |
| March ‘19 | 60.41 | |
| February ‘19 | 61.95 | |
| January ‘19 | 63.33 | |
| December ‘18 | 63.54 | |
| November ‘18 | 66.98 | |
| October ‘18 | 71.20 | |
| September ‘18 | 70.80 | |
| July/August ‘18 | 70.80 | |
| May/June ‘18 | 72.55 | |
| March/April ‘18 | 75.71 | |
| January/February‘18 | 68.89 |
LMI®
The overall LMI index is 52.6, down slightly (-1.5) from January’s reading of 54.1. This is the lowest score in the history of the LMI, and is down (-7.6) from this time a year ago, when it read in at 61.9. this continues the downward trend in the overall index, with the lowest eleven scores in the history of the index coming in the last eleven months. It should be pointed out that although it is down, the logistics industry is still growing, but at the slowest rate than we have measured over the past 42 months.
Respondents predict that over the next year, the LMI will be at 63.1, up slightly (+0.3) from January’s future prediction of 62.8, but up significantly from where it is now. Essentially respondents are predicting a regression back to the status quo, as the historical three-year average of the LMI is a very similar 61.9.
Inventory Levels
The Inventory Level value is 48.4, which is below 50, and which indicates that inventory levels have contracted slightly, relative to the previous month. This value is 5.8 points below the value last month of 54.2, and only 6.1 points above the month before that, which was the lowest inventory level value in the history of the LMI. Taking the last three months together, the decrease in the index value has been significant. The current value is lower than the same value in previous years. This value is 19.2 points below the value one year ago and 11.9 points below the level two years ago at this time. Four of the last six values were all-around 54, but two of the last three have been below 50, so it seems that the period of stability has ended, and inventory values are beginning to fall. These declining inventory values may be reflecting uncertainty brought about by the COVID-19 Coronavirus,
When asked to predict what will conditions will be like 12 months from now, the average value is 65.4, indicating inventory levels are expected to grow. This value is virtually unchanged from last month’s year-ahead prediction of 63.3. This indicates that despite current declines, respondents expect values to increase over the next year.
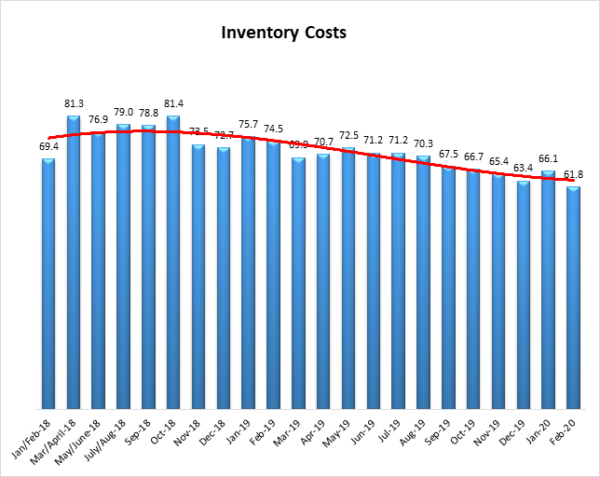
Inventory Costs
As inventory levels show signs of declining, it is somewhat surprising that inventory costs have continued to increase, although at ever-slower rates. The current value is 61.8, and any value above 50 indicates growth. The current value is 4.3 points below the previous reading of 66.1. These continued high levels indicate strong continued growth in inventory costs, although they are below the long-term average of 71.1. The current value is 12.7 points below the 74.5 value last year at this time, meaning cost growth has fallen significantly in the past year. The current value is also 7.6 points below the 69.4 value of two years ago at this time. Inventory cost values have never fallen below 50, over the life of the index. Given the relatively small decrease in inventory levels seen above and consistent increases in warehousing costs, it seems quite likely that inventory costs will continue to rise.
Responses seem consistent with this hypothesis. When asked about what they expect inventory costs to be like 12 months from now, the index value is 69.7, a slight decrease from last month’s value of 72.9 This value reflects expected continued inventory cost growth. Respondents clearly expect inventory costs to continue to be high for the next 12 months.
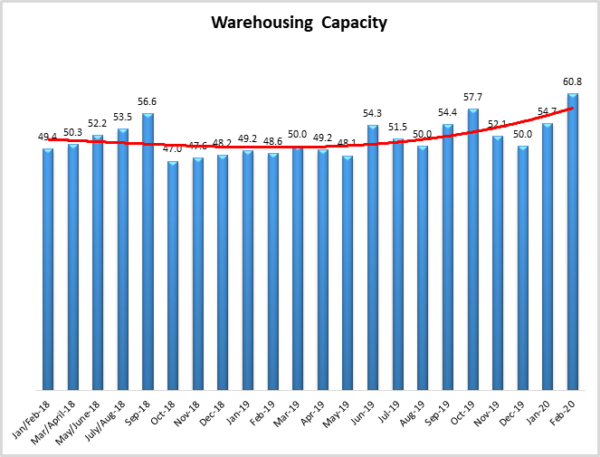
Warehousing Capacity
The Warehousing Capacity Index registered 60.8 percent in February 2020. This represents an increase of 6.1 percentage points from the January 2020 reading of 54.7, and a sharp increase of 12 points from the reading one year ago. Also of note, is that this the second month in a row where capacity has increased, and at a modest pace. This shift could indicate an opening in the market.
Looking forward at the next 12 months, the predicted Warehousing Capacity index is 59.1, up (+3.3) from January’s future prediction of 55.8, This continues a pattern of ping-ponging back and forth since October when it was at 62.0, down to 47.9 in November, up to 61.1 in December, down to 55.8 in January and back up this month. It is unclear what is causing these fluctuations.
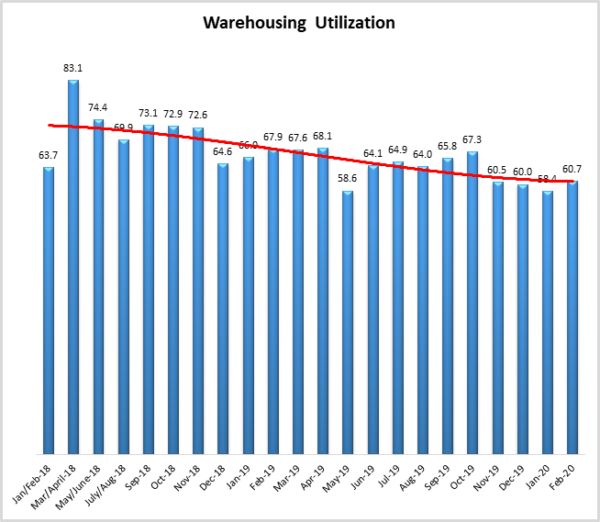
Warehousing Utilization
The Warehousing Utilization Index registered 60.7 percent in February 2020. This represents a minor increase of 2.3 percentage points from last month, and is down by 7.2 points from the February 2019 reading of 67.9. Taken together, the slight increase in the utilization with the increased capacity could mean that the market is responding to increased demand by opening up additional resources/capacity.
Looking forward to the next 12 months, the predicted Warehousing Utilization index is 68.3, up slightly (+0.7) from January’s future prediction of 67.6. Respondents appear to be optimistic that utilization will increase over the next year.
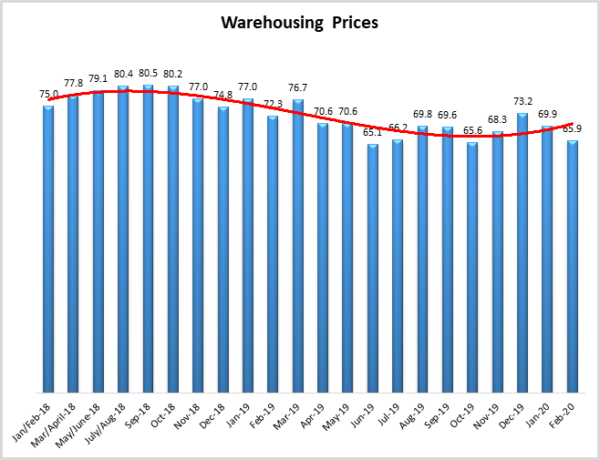
Warehousing Prices
Warehousing Prices Index registered 65.9 percent in February 2020. This is down by 4 points from the January 2020 reading of 69.9. This reading is also down by 6.4 points from one year ago. This also continues the trend of the decreased rate of growth in pricing. Though still increasing, given the decline in the rate of growth from last month, and taken together with the increased utilization and increased capacity, this decrease could suggest that the market is reflecting the price sensitivity in demand and adjusting as necessary. Stated differently, the market may be responding by pushing prices downward given the freed up capacity to ultimately increase utilization of excess capacity in warehousing.
Looking forward to the next 12 months, the predicted Warehousing Prices index is 71.1, down slightly (-3.9) from January’s future prediction of 75.0, This indicates that firms are not expecting strong growth in Warehouse Prices over the next 12 months.
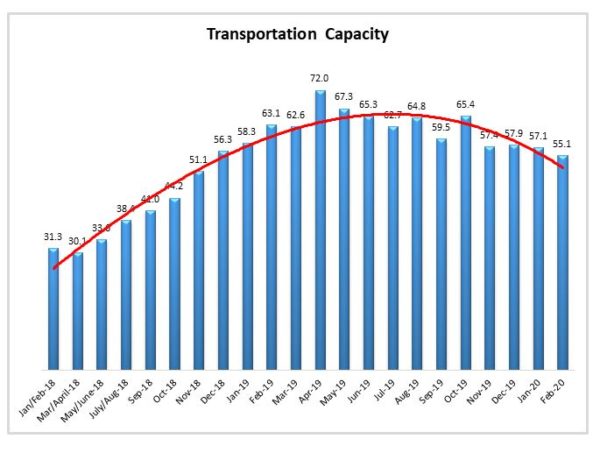
Transportation Capacity
The Transportation Capacity Index registered 55.1 percent in February 2020. This is a small decrease of 2 percentage points from the January reading of 57.1. This capacity level is down from this time last year (-8.0) when this metric read in at 61.3. Interestingly, it’s up 23.8 points from January/February 2018, when it read in at 31.3.
It should be noted the data indicates a score of only 49.5 percent for the next year, up slightly (+2.8) from January’s future prediction of 46.7. This indicates that respondents are not expecting further contraction in Transportation Capacity going forward.
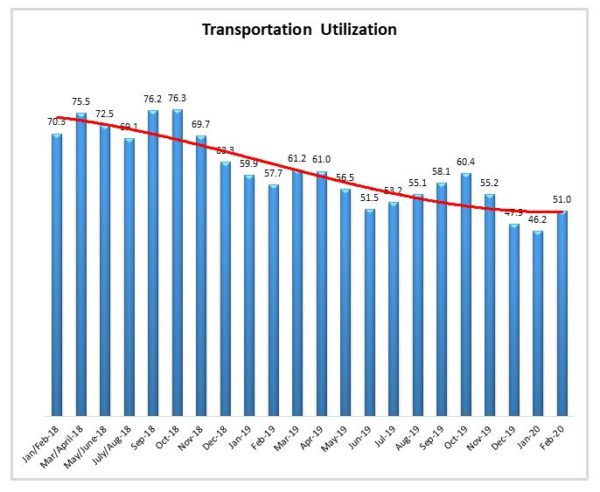
Transportation Utilization
The Transportation Utilization Index registered 51.0 percent in February 2020. This is an increase of 4.8 percentage points from the January reading of 46.2. With this increase, the Transportation Utilization Index reversed the downward trend and moved slightly over the 50 percent level, indicating expansion. This is the first time since November that we read an increase in the Transportation Utilization index (although the growth is 51.0, which is very minimal).
Interestingly, the future Transportation Utilization Index indicates a score of 67.2 (+8.5) from January’s future prediction. This indicates that respondents are confident that the utilization of existing transportation will increase over the next 12 months.
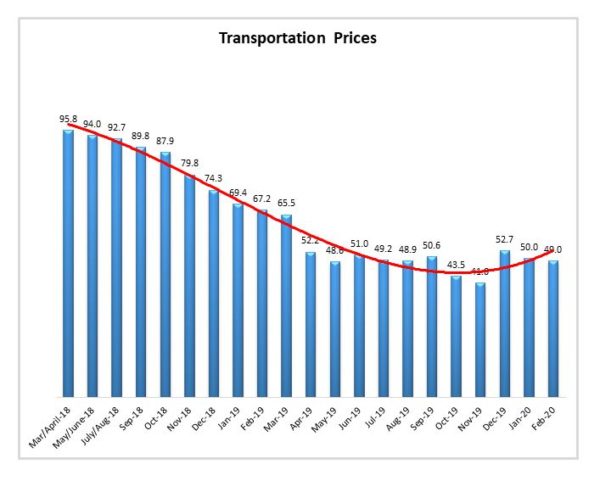
Transportation Prices
The Transportation Prices Index registered 49.0 percent in February 2020. This is a decrease of 1.0 percent from the January transportation prices reading of 50.0. The 49.0 reading indicates that transportation prices are slightly decreasing. This is the sixth out of the last ten readings that Transportation Prices have been in a state of contraction. This is in contrast to a year ago when Transportation Prices read in 16.2 points higher at 67.2.
The future index for transportation prices remains elevated, with a future Transportation Prices Index value of 71.9 (+4.3 from January’s future prediction) indicating strong expectations of price increases over the next 12 months.
About This Report
The data presented herein are obtained from a survey of logistics supply executives based on information they have collected within their respective organizations. LMI® makes no representation, other than that stated within this release, regarding the individual company data collection procedures. The data should be compared to all other economic data sources when used in decision-making.
Data and Method of Presentation
Data for the Logistics Manager’s Index is collected in a monthly survey of leading logistics professionals. The respondents are CSCMP members working at the director-level or above. Upper-level managers are preferable as they are more likely to have macro-level information on trends in Inventory, Warehousing and Transportation trends within their firm. Data is also collected from subscribers to both DC Velocity and Supply Chain Quarterly as well. Respondents hail from firms working on all six continents, with the majority of them working at firms with annual revenues over a billion dollars. The industries represented in this respondent pool include, but are not limited to Apparel, Automotive, Consumer Goods, Electronics, Food & Drug, Home Furnishings, Logistics, Shipping & Transportation, and Warehousing.
Respondents are asked to identify the monthly change across each of the eight metrics collected in this survey (Inventory Levels, Inventory Costs, Warehousing Capacity, Warehousing Utilization, Warehousing Prices, Transportation Capacity, Transportation Utilization, and Transportation Prices). In addition, they also forecast future trends for each metric ranging over the next 12 months. The raw data is then analyzed using a diffusion index. Diffusion Indexes measure how widely something is diffused, or spread across a group. The Bureau of Labor Statistics has been using a diffusion index for the Current Employment Statics program since 1974, and the Institute for Supply Management (ISM) has been using a diffusion index to compute the Purchasing Managers Index since 1948. The ISM Index of New Orders is considered a Leading Economic Indicator.
We compute the Diffusion Index as follows:
PD = Percentage of respondents saying the category is Declining,
PU = Percentage of respondents saying the category is Unchanged,
PI = Percentage of respondents saying the category is Increasing,
Diffusion Index = 0.5 * PD + 0.5 * PU + 1.0 * PI
For example, if 25% say the category is declining, 38% say it is unchanged, and 37% say it is increasing, we would calculate an index value of 0*0.25 + 0.5*0.38 + 1.0*0.37 = 0 + 0.19 + 0.37 = 0.56, and the index is increasing overall. For an index value above 0.5 indicates the category is increasing, a value below 0.5 indicates it is decreasing, and a value of 0.5 means the category is unchanged. When a full year’s worth of data has been collected, adjustments will be made for seasonal factors as well.


