-
Growth is INCREASING AT AN INCREASING RATE for: Inventory Costs, Warehousing Utilization, and Warehousing Prices
-
Growth is INCREASING AT AN DECREASING RATE for: Warehousing Capacity and Transportation Capacity
-
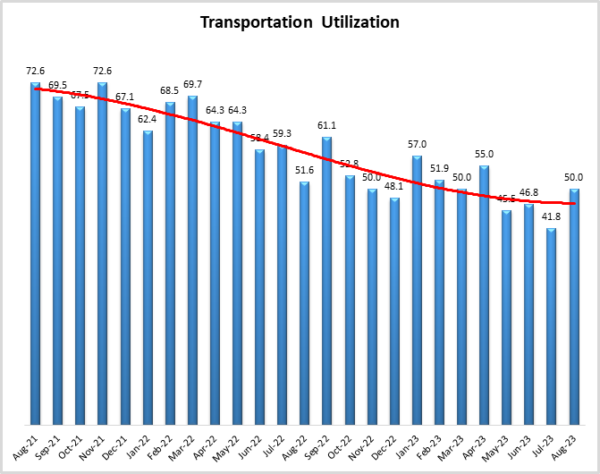
Transportation Utilization is NEITHER INCREASING NOR DECREASING
-
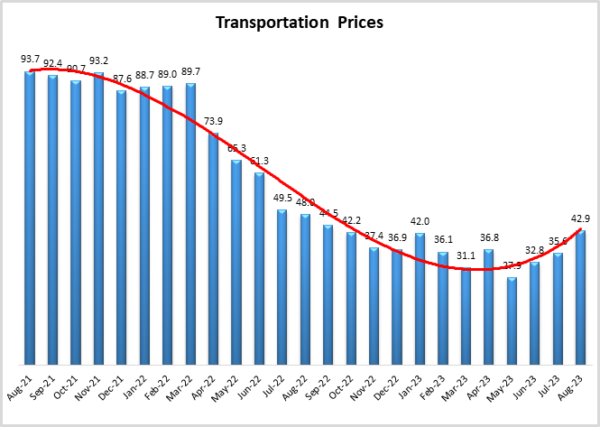
Inventory Levels and Transportation Prices ARE DECREASING
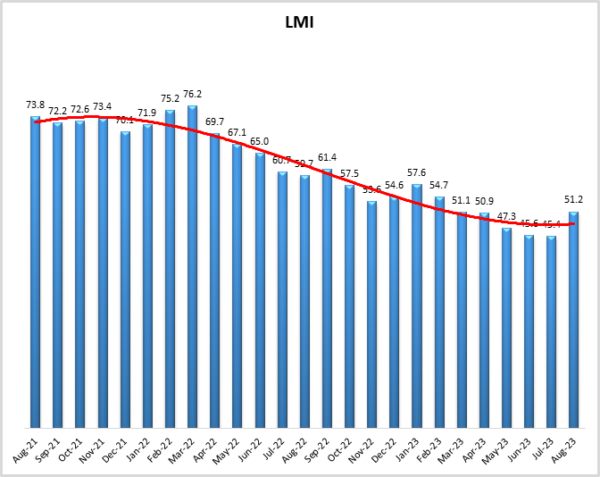
In August the Logistics Manager’s Index read in at 51.2. This is a marked change for the index as before August’s reading the overall index had registered three consecutive months of contraction and five consecutive months of registering new all-time low scores. In contrast, this is the fastest rate of expansion since February.
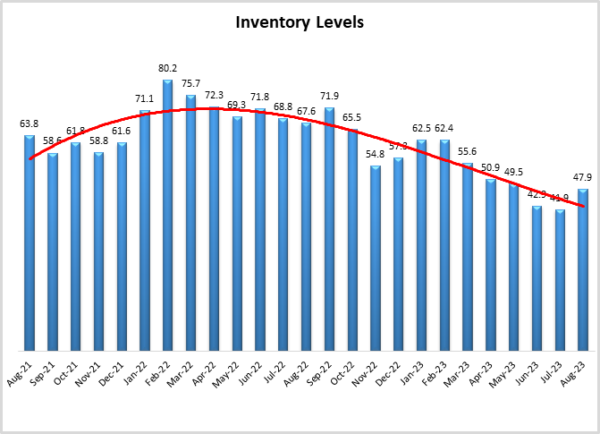
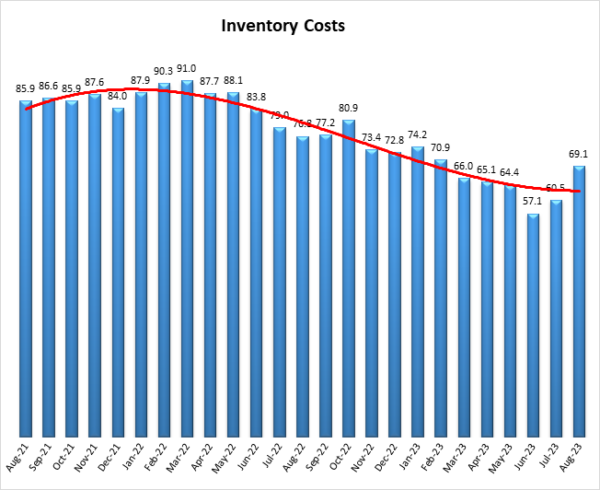
The expansion this month is driven by increased activity across all eight sub-metrics of the index. Inventory Levels are still contracting, but at a much slower rate (+6.0) than July’s reading of 41.9, which was the steepest rate of contraction in the history of the index. This has led to an increase in Inventory Costs (+8.6 to 69.1) and Warehousing Prices (+2.8 to 63.4). We also observe Transportation Utilization moving out of contraction (+8.2 to 50.0) and the rate of Transportation Price contraction slowing considerably (+7.3 to 42.9).
It is not yet clear whether this move back towards expansion is a one-off deviation from the contraction we had been seeing or represents a pivot back towards expansion remains to be seen. However, it does appear that the increase in activity we observed in the second half of July has spilled over into August. When taken together with other anecdotal evidence and metrics that will be discussed below, it seems that a move back towards continued expansion is quite possible.
Researchers at Arizona State University, Colorado State University, Florida Atlantic University, Rutgers University, and the University of Nevada, Reno, and in conjunction with the Council of Supply Chain Management Professionals (CSCMP) issued this report today.
Results Overview
The LMI score is a combination of eight unique components that make up the logistics industry, including: inventory levels and costs, warehousing capacity, utilization, and prices, and transportation capacity, utilization, and prices. The LMI is calculated using a diffusion index, in which any reading above 50.0 indicates that logistics is expanding; a reading below 50.0 is indicative of a shrinking logistics industry. The latest results of the LMI summarize the responses of supply chain professionals collected in August 2023.
The move back towards a positive overall logistics index was accompanied by other positive economic news in August – particularly in the U.S. For instance, average hourly earnings were up 4.3% year-over-year in August (compared to an increase of 3.2% in the consumer price index over the same period). This is a 0.2% increase from July, giving suggesting that the economy is slowing to a level closer to what the Federal Reserve is looking for[1]. Conversely, the Personal Consumption Expenditures (PCE) index was up 3.3% in July year over year. This is up from the 3% growth rate we saw in June – although it should also be pointed out it is down significantly from the 7% growth we saw a year ago. Core inflation was also up slightly from 4.1% year-over-year in June to 4.2% in July[2].
In addition to the earnings increases, the U.S. added 187,000 jobs in August. This brings the average jobs added over the last three months to 150,000 per month, increasing the chances that the Fed will hold interest rates steady at their September meeting. Despite the overall increase, both warehousing and transportation employers cut jobs in August; although in the case of the latter a large part of that was due to the closure of Yellow[3]. Yellow’s impact was significant. The 36,700 employees that dropped out of the transportation industry marks the largest loss of transportation jobs since the start of lockdowns in April of 2020. Overall, transportation jobs are down 43,800 from their peak of 1.61 million in January[4]. This contrast between the overall market and transportation epitomizes what we have been seeing over the 18 months, during which we have had a freight recession but economic growth otherwise. Ironically, the lost jobs look to be leading to a rebalancing of supply and demand in the freight market, as capacity comes back in line with freight demand, we will continue to see transportation prices come back up.
It will be interesting to observe what an increase in logistics prices does to the economy. According to the San Francisco Fed, decreasing supply costs have contributed to slowing inflation in three of the most recent five months[5]. The progress the U.S. has made economically particularly stands out when compared to the situation around the world. Eurozone prices were up 5.3% year over year in August. This is below the peak reached last October, but still well above the levels officials are looking for. While tourism and services have come back in some parts of Europe, manufacturing in places like Germany remains depressed due to the lack of demand for goods[6]. China is of course facing a whole raft of economic issues, including low exports and personal consumption[7].
This progress has led to a positive outlook from both consumers and analysts. The University of Michigan Index of Consumer Sentiment “moved sideways” in August, going from a 71.6 in July to 69.5 in August. This is still the second highest reading in nearly two years and is up 39% from the all-time low consumer sentiment observed in July 2022[8]. Although it should be noted that consumer sentiment could shift with the resumption of student loan repayments in October, with loan beginning to accrue again in September[9]. Additionally, S&P Global Market Intelligence estimated that U.S. GDP will increase by 4% in Q3, which would be a significant increase over what we have seen during the last year and a half[10]. Finally, the overall LMI is up (+5.8) to 51.2, moving back into expansion for the first time since April. This is important as the logistics industry often acts as a leading indicator for the overall economy (before things can be sold in a store or online, they need first be moved on a truck or stored in a warehouse).
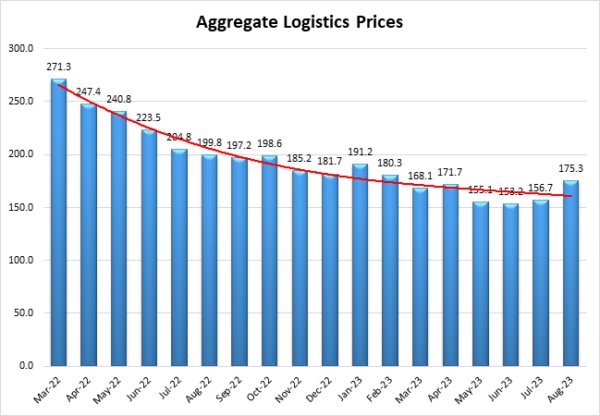
Much of this optimism is due to the perception that inflation is slowing and will continue to do so going forward. Despite the progress that has been made on slowing inflation rates, many investors expect that one more interest rate hike could still happen before the end of the year2. As mentioned above, decreased supply costs have been a major driver of the slowdown on inflation. The chart below show aggregate logistics costs – which is a cumulative measure of Inventory Costs, Warehousing Prices, and Transportation Prices – from March of 2022 to August 2023. March 2022 was picked as the starting date because that’s when aggregate prices hit their all-time peak shortly after the invasion of Ukraine and subsequent fuel crunch that sent inflation through the roof last year. Because this is the sum of three separate indices with a range of 0-100, this aggregate measure can be anywhere from 0-300, with 150.0 representing a breakeven point. Aggregate Logistics Costs dipped under 200.0 a year ago in August of 2022. The rate of growth steadily declined until reaching levels in the 150’s, which is close to no growth, for three consecutive months from May to July, with the all-time low of 153.3 coming in June. While low costs were difficult on the freight market, they appear to have been helpful to the overall economy due to their moderating impact on inflation. Aggregate Logistics Costs jumped up 18.6-points to a reading of 175.3 in August. This is a marked change from the trends we have been observing over the last 18 months. It will be critical to continue monitoring this to observe whether or not this will have a negative impact on inflation reduction, simply provide relief to freight markets, or some combination of the two. If Aggregate Logistics Prices stay in a reasonable range (e.g. somewhere around 200.0), then our chances of an improvement in both the freight market and overall economy are good. If however, the increase continues and we see Aggregate Logistics Prices over 250.0 again it may be a sign that we are moving back towards inflation.
The greatest source of increased costs in August are Inventory Costs, which are up (+8.6) to 69.1. This is the highest reading for this metric since last February when many supply chains were dealing with inventories that went unsold during Q4. Factors behind this increase include a lack of storage capacity and a restocking of inventories at large firms (both of which will be discussed below). The restocking of inventories at large firms was behind the slowdown in the rate of contraction for Inventory Levels, which read in at 47.9 – up (+6.0) from July’s reading of 41.9, which was the lowest in the history of the index. While it is likely we will see inventories begin to grow again ahead of Q4, it is unlikely they will get anywhere close to what we saw in the buildup to the holiday season in 2020 and 2021. U.S. import data suggests that inventory is likely to remain low this season, with the National Retail Federation predicting imports to be down slightly in September and October. Imports into the west coast ports have been down throughout 2023, and empty containers going back to Asia to be refilled are down as well[11]. It should be noted that what we’re seeing in California, July was the busiest month for the port of New York/New Jersey since October of 2022[12]. Imports have remained strong across the East and Gulf Coast ports this summer, as shippers continue to take advantage of revamped infrastructure, and avoid the tight warehousing markets in Southern California. This is however complicated by issues in the Panama Canal, where passage has slowed due to a drought that has led to reduced ware levels. At some points in August there were over 200 vessels waiting to cross, with some waiting for 20 days or more to make the trip through the canal. Some vessels have opted to sail in the other direction, either going through the Suez Canal or south around the horn of Africa[13]. In late August 75% of the west coast dockworkers union (the ILWU) voted in favor a new 6-year contract with west coast ports. The new deal is thought to include a 32% pay raise and a “hero bonus” for workers who kept supply chains alive during the pandemic[14]. The possibility of a strike or slowdown had been in the air since the contract expired. The new 6-year pact provides some assurances that will no longer take place. Whether or not that assurance brings volume back to the west coast ports remains to be seen.
There is not much hope on the horizon that imports from China will pick up to fill the empty containers. Their manufacturing activity was down for the fifth consecutive month in August as exports are down7. At the same time domestic spending has been damaged by a sputtering real estate and construction market, as well as demographic issues that have prime-age consumers saving for retirement and to take care of older relatives[15]. One of the issues holding the Chinese economy back is the continued trade tensions with the U.S. In a recent meeting with Chinese officials, Commerce Secretary Gina Raimondo communicated that the Biden administration was willing to push trade regarding some categories of goods, but also that loosening the restrictions on exports involving semiconductors or related equipment remains off the table. Whether they will lead to a re-start in the trade relationship between the U.S. and China, possibly kicking off an increased economic activity for the latter, remains to be seen[16].
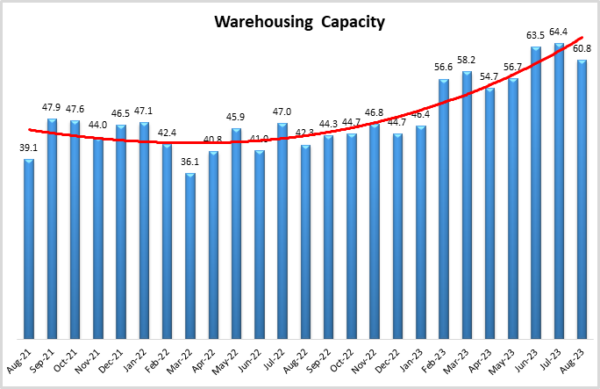
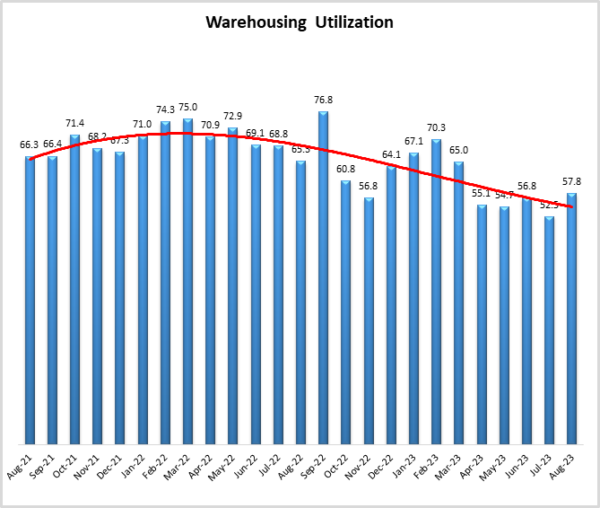
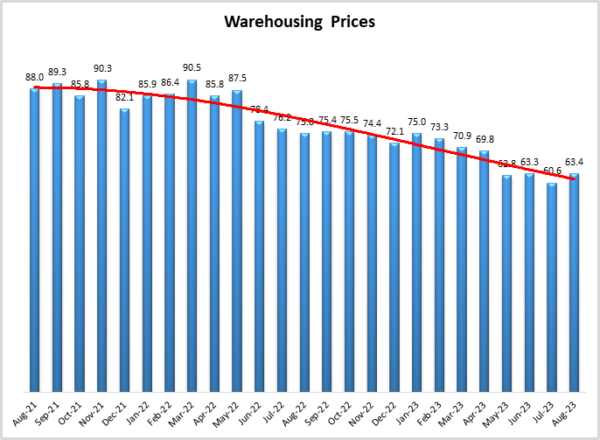
Of all eight metrics, warehousing – true to its nature – showed the least movement in August. Warehousing Capacity grew at the slightly slower (-3.6) rate of 60.8. The continued growth in capacity is partly due to the ongoing wave of U.S. factory and distribution construction that has been spurred by anticipation of growing domestic chip and high-capacity battery production. Despite concerns about staffing, the need for increased U.S. chip capacity is likely to remain strong. Nvidia’s streak of consecutive record-breaking quarters suggests the chip and semiconductor demand will continue to be a growth area for the foreseeable future. In fact, some analysts have called into question whether the current expansion plans for firms like TSMC will be enough to satisfy demand[17]. We also see firms continue to build out their networks to accommodate next- and same-day delivery for ecommerce. Target is an example of the trend towards networks optimized for ecommerce, moving from large distribution centers to smaller fulfillment centers placed nearer to population centers. Interestingly, they believe that these smaller FC’s have helped them to reduce their inventory by 17% year-over-year[18]. While this contrasts somewhat with the square root law, and the long-held belief that more warehouses almost always lead to more inventory, it is possible that because they are using automated “flow” or “sort” centers, inventory is not sticking around for long. This is emblematic of a move back to JIT strategies, wherein firms hold onto inventory for the shortest amount of time possible. A sign that this capacity is still needed is that despite the increased space, Warehousing Utilization is up (+5.2) to 57.8 and Warehousing Prices (+2.8) have grown (+2.8) to 63.4.
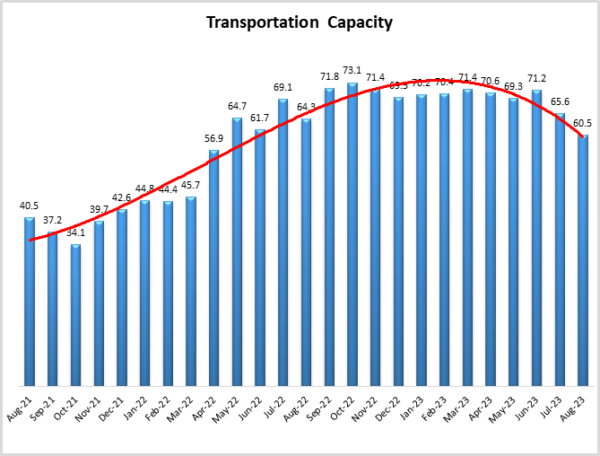
The transportation has not had anything approximating the consistency of warehousing. The aftermath of Yellow’s bankruptcy has led to a bit of turbulence. The rush for their remaining assets has already kicked off as Old Dominion has committed $1.5 billion to the winning bid to buy Yellow’s network of approximately 170 truck terminals. This was a unique opportunity as the level of well-place terminals rarely hit the open market[19]. We have said repeatedly in past reports that the freight recession will not end until excess capacity exits the market, but Yellow’s exit has not been a panacea. There is still clearly an imbalance in supply and demand with excess capacity suppressing prices, but the issues are not as severe as they previously had been. Take for example Transportation Capacity, which is still expanding at a rate of 60.5, but at a slower pace (-5.1) than what we saw in July. Interestingly, this is the first time Transportation Capacity came in lower than Warehousing Capacity since January 2022 – a few months before the freight recession started.
For the freight market to truly move back toward equilibrium demand will need to increase as well. Knight-Swift’s CEO David Jackson recently stated that their “base case is for a modest seasonal uplift in the fourth quarter,” but they’re “not calling for such a turning point,” (although they are not ruling it out either). On the intermodal side, J.B. Hunt intermodal president Darren Field stated that they “don’t have any customers really predicting a significant peak season,” and that Hunt is taking a “wait-and-see” approach11. This type of modest increase is reflected in Transportation Utilization jumping up (+8.2) to 50.0 and moving out of contraction territory for the first time since April. Freight Waves’ Outbound Tender Rejection Index topped 4% in August, marking the highest rejection rate since January. While this is nowhere near the rejection rates of 20-25% the index was registering in 2021, it represents a slight tightening of the freight market – providing further evidence that we may be moving back towards equilibrium[20]. Transportation Prices are moving back int eh right direction as well. Although they are still declining at a rate of 42.9, it is at a slower pace (+7.3) than last month and the highest reading for this metric since September of 2022. Transportation markets are nowhere near a full recovery to the levels we saw from Summer 2020 to early 2022, but it is possible we are now seeing concrete steps moving out of the freight recession.
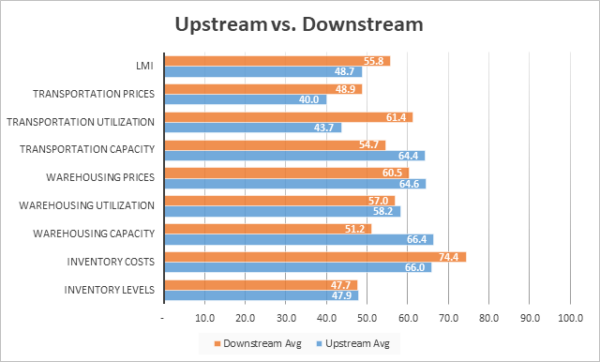
Continuing the trend we have observed throughout most of 2023 we see more activity from our Downstream (orange bars) than from our Upstream (blue bars) respondents. While both sides of the supply chain reported slight contraction in Inventory Levels, Downstream firms report significantly greater growth in Inventory Costs (74.4 to 66.0). This higher cost is likely due to the lack of storage space as Downstream respondents report Warehousing Capacity of 51.2 – near no growth – whereas Upstream firms report capacity increasing at a rate of 66.4. We also see a pronounced difference across our transportation metrics. Upstream Transportation Utilization is contracting (43.7) while Downstream firms are reporting expansion (61.4). Downstream firms report slowing rates of contraction for Transportation Prices (48.9 – bordering on no change) than their Upstream counterparts (40.0). Although both report contraction, these are significantly slower rates of decline than we have been seeing for most of the year. Taken all together, Downstream firms report growth in the overall index at a rate of 55.8. Upstream firms report slight contraction at a rate of 48.7. It will be interesting to observe if this dynamic continues. As we report below, Upstream firms are actually predicting a more robust logistics market than their Downstream counterparts – something that would represent a marked change from what we have seen over the last year.
| Inv. Lev. | Inv. Costs | WH Cap. | WH Util. | WH Price | Trans Cap | Trans Util. | Trans Price | LMI | |
| Upstream | 47.9 | 66.0 | 66.4 | 58.2 | 64.6 | 64.4 | 43.7 | 40.0 | 48.7 |
| Downstream | 47.7 | 74.4 | 51.2 | 57.0 | 60.5 | 54.7 | 61.4 | 48.9 | 55.8 |
| Delta | 0.2 | 8.4 | 15.3 | 1.2 | 4.1 | 9.7 | 17.7 | 8.9 | 7.1 |
| Significant? | No | Marginal | Yes | No | No | Marginal | Yes | No | Yes |
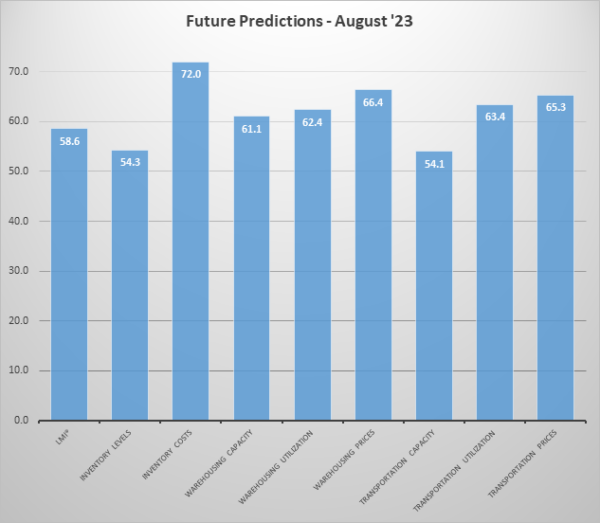
Respondents were asked to predict movement in the overall LMI and individual metrics 12 months from now. Future expectations were notably more optimistic in August than in July, with predictions for the overall index up (+6.0) to 58.6, its highest reading since July of 2022. This growth is driven by expectations a slowdown in the rate of expansion for our two capacity metrics and expectations of increased rated of growth for everything else. Particularly notable this month are Inventory Levels moving from contraction to expansion (49.6 to 54.3) and sizable jumps for Inventory Costs (60.4 to 72.0) Transportation Utilization (52.5 to 63.4), and Transportation Prices (56.1 to 65.3). Taken together, this suggests that firms will begin building inventories back up to normal levels over the next 12 months, leading to increased activity in the freight market. Warehousing Prices and Utilization are expected to continue their current trajectory of solid growth. The contrast of Inventory Levels in the 50’s and warehousing metrics in the 60’s likely indicates that firms are hopeful that inventories will turn over quickly, moving in and out of storage facilities and allowing a return to just-in-time inventory management principles.
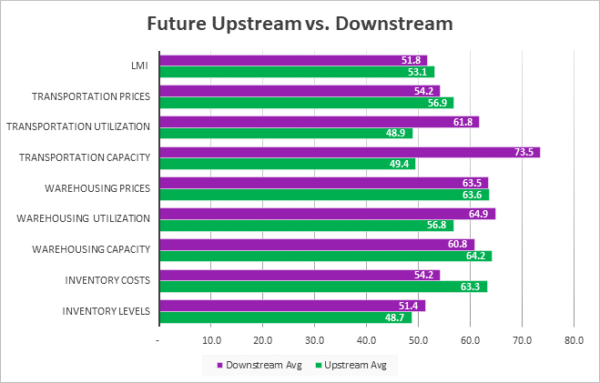
Both Upstream (green bars) and Downstream (purple bars) respondents are predicting growth over the next 12 months. As has been the case for some time, Downstream firms expect to see Inventory Levels continue to build over the next 12 months. However, Upstream respondents are now expecting that as well (at a rate of 51.4 to Downstream’s 58.5). This expectation of inventories moving through supply chains led Upstream firms to predict statistically significantly greater levels of growth for Transportation Utilization (68.8 to 55.9) which would portend solid growth in freight prices (both groups come in around 65 – which represents a significant change). Interestingly, Upstream firms are also predicting a significantly greater amount of Transportation Capacity growth (59.9), Downstream firms are forecasting contraction (46.2). This contrast indicates that, while transportation should pickup across all levels of the supply chain, it will be most pronounced downstream due to consumer purchases and last-mile delivery.
| Futures | Inv. Lev. | Inv. Costs | WH Cap. | WH Util. | WH Price | Trans Cap. | Trans Util. | Trans Price | LMI |
| Upstream | 51.4 | 73.2 | 63.8 | 60.7 | 64.3 | 59.9 | 68.8 | 65.1 | 58.9 |
| Downstream | 58.5 | 70.2 | 57.3 | 64.9 | 69.4 | 46.2 | 55.9 | 65.7 | 62.0 |
| Delta | 7.1 | 3.0 | 6.5 | 4.2 | 5.1 | 13.7 | 12.9 | 0.6 | 3.1 |
| Significant? | No | No | No | No | No | Yes | Yes | No | No |
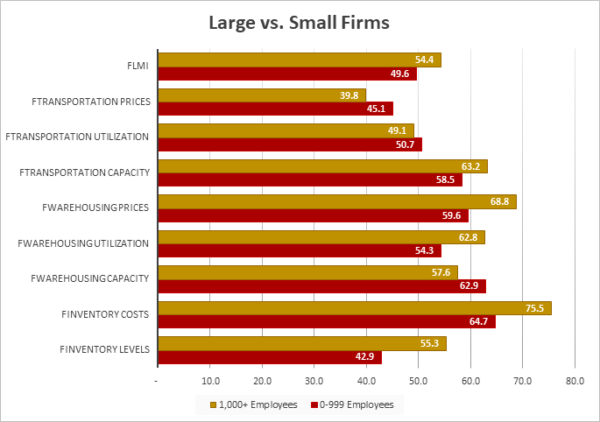
In a continuation of what we observed in July we see more growth coming out of larger firms (those with 1,000 employees or more, represented by gold lines) than from smaller firms (those with 0-999 employees, represented by maroon lines). Statistically significant differences emerged for Inventory Levels, Inventory Costs, Warehousing Prices, and for the overall index. Larger firm readings came in higher for all three of these metrics. Essentially, it seems that larger firms- are building inventories up for Q4 which is leading to higher inventory and warehousing costs. It is interesting that large firms are seeing this level of growth when both Upstream and Downstream firms reported a slight contraction in inventories. This suggests that it is the larger Downstream retailers, and their larger Upstream suppliers and logistics service providers that are currently driving the move back towards growth in the logistics industry.
| Employees | Inv. Lev. | Inv. Costs | WH Cap. | WH Util. | WH Price | Trans Cap. | Trans Util. | Trans Price | LMI |
| 0-999 | 42.9 | 64.7 | 62.9 | 54.3 | 59.6 | 58.5 | 50.7 | 45.1 | 49.6 |
| 1,000+ | 55.3 | 75.5 | 57.6 | 62.8 | 68.8 | 63.2 | 49.1 | 39.8 | 54.4 |
| Delta | 12.5 | 10.8 | 5.2 | 8.4 | 9.2 | 4.8 | 1.6 | 5.3 | 4.8 |
| Significant? | Marginal | Yes | No | No | Marginal | No | No | No | Marginal |
The index scores for each of the eight components of the Logistics Managers’ Index, as well as the overall index score, are presented in the table below. After three consecutive months of contraction the overall LMI has moved back into expansion territory at a rate of 51.2. Transportation Utilization has also moved out of contraction, reading in at 50.0 and no change from July. The two metrics that continue to contract are Inventory Levels at 47.9 and Transportation Prices at 42.9. The other six sub-metrics are expanding, with only the two capacity metrics doing so at a slower pace than what we saw last month.
| LOGISTICS AT A GLANCE | |||||
| Index | August 2023 Index | July 2023 Index | Month-Over-Month Change | Projected Direction | Rate of Change |
| LMI® | 51.2 | 45.4 | +5.8 | Expanding | From Contraction |
| Inventory Levels | 47.9 | 41.9 | +6.0 | Contracting | Slower |
| Inventory Costs | 69.1 | 60.5 | +8.6 | Expanding | Faster |
| Warehousing Capacity | 60.8 | 64.4 | -3.6 | Expanding | Slower |
| Warehousing Utilization | 57.8 | 52.5 | +5.2 | Expanding | Faster |
| Warehousing Prices | 63.4 | 60.6 | +2.8 | Expanding | Faster |
| Transportation Capacity | 60.5 | 65.6 | -5.1 | Expanding | Slower |
| Transportation Utilization | 50.0 | 41.8 | +8.2 | No Change | From Contraction |
| Transportation Prices | 42.9 | 35.6 | +7.3 | Contracting | Slower |
Historic Logistics Managers’ Index Scores
This period’s along with prior readings from the last two years of the LMI are presented table below:
| Month | LMI | Average for last 3 readings – 47.4
All-time Average – 63.0 High – 76.2 Low – 45.4 Std. Dev – 8.18
|
| Aug ‘23 | 51.2 | |
| July ‘23 | 45.4 | |
| June ‘23 | 45.6 | |
| May ‘23 | 47.3 | |
| Apr ‘23 | 50.9 | |
| Mar ‘23 | 51.1 | |
| Feb ‘23 | 54.7 | |
| Jan ‘23 | 57.6 | |
| Dec ‘22 | 54.6 | |
| Nov ‘22 | 53.6 | |
| Oct ‘22 | 57.5 | |
| Sep ‘22 | 61.4 | |
| Aug ‘22 | 59.7 | |
| July ‘22 | 60.7 | |
| June ‘22 | 65.0 | |
| May ‘22 | 67.1 | |
| Apr ‘22 | 69.7 | |
| Mar ‘22 | 76.2 | |
| Feb ‘22 | 75.2 | |
| Jan ‘22 | 71.9 | |
| Dec ‘21 | 70.1 | |
| Nov ‘21 | 73.4 | |
| Oct ‘21 | 72.6 | |
| Sep ‘21 | 72.2 | |
| Aug ‘21 | 73.8 |
LMI®
After five consecutive months of reaching new lows – with the last three of those being readings of contraction – the overall index has moved back up (+5.8) into expansionary territory, reading in at 51.2. This is the highest reading for the overall index since February. This move is fueled by a slight tightening in the transportation market and continued growth in warehousing and inventory costs. Interestingly, Upstream firms are still seeing slight contraction at 48.7 while Downstream firms are up 9.5-points from July, reading in at 55.8.
Building on their optimistic predictions from last month, respondents expect continued growth in the logistics industry, predicting a healthy expansion of 58.6 over the next 12 months, this is up (+5.8) from July’s future prediction of 52.8 and is indicative of the growing optimism in logistics markets and across the overall economy.
Inventory Levels
The Inventory Level value is 47.9, which is up (+6.0) from last month’s value of 41.9 which is the lowest value recorded in the history of the index. This is only the fifth consecutive time – and only sixth overall – this metric has been in a state of contraction. This value is down 19.7 from last year, and down 15.9 from two years ago. This month, both upstream and downstream respondents reported slight decreases. Upstream respondents averaged 47.9, while downstream averaged 47.7. Last month, upstream showed a significant contraction, while downstream respondents reported very slight growth (37.5 vs 51.4). We do however see a difference in terms of firm size. Large respondents are restocking (55.3) while smaller firms are still in a state of inventory contraction (42.9).
When asked to predict what conditions will be like 12 months from now, the average value is 54.3, up (+6.4) from July’s future prediction of 47.9. Interestingly, Upstream respondents predicted an increase of 57.6, while Downstream respondents predicted a slight increase of 48.9. This suggests that while retailers are expecting inventory to stay close to a steady state – perhaps reflecting a move toward JIT – their suppliers are expecting them to pick up. This would be a marked shift from the dynamic we have observed over the last year when Downstream firms were building up stocks of goods more quickly.
Inventory Costs
Inventory costs are growing significantly, with a value of 69.1. This index is up (+8.6) from July’s reading of 60.5. This value is down 7.7 from last year, and down 16.8 from two years ago. Both Upstream and Downstream reported increased Inventory Costs (66.0 and 74.4 respectively) although Downstream levels were increasing at a significantly faster pace. We also observe a significant difference between small firms at 64.7 and their larger counterparts at 75.5. Essentially, higher costs are being borne by firms closer to customers and those with larger footprints (and likely some for which both those things are true).
Above, we saw that respondents expect inventory levels to increase slightly over the next 12 months (54.3). Interestingly, Inventory Costs are expected to grow at a significantly faster rate of 72.0. It seems likely that this difference reflects an expectation that storage space will remain tight, and transportation prices may increase – both of which will add to the total cost of ownership for goods. Upstream respondents predict a growth rate of value of 73.6, while Downstream predict a rate of 69.3.
Warehousing Capacity
The July 2023 warehousing capacity index registered in at 60.4, down (-4.0) from July’s reading of 64.4.This is up 18.5-points from this time last year, and 21.7-7 points higher than two years ago. Warehousing Capacity had never expanded at a rate over 60.0 before June of this year but has now done so for three consecutive months. Much of this growth is driven by Upstream firms, who registered an expansion rate of 66.4 – 15.3 points higher than the 51.2 reported by their Downstream counterparts. A reading of 51.2 is very near to “no growth” which suggests that retailers and other customer-facing firms are having a difficult time opening up the space necessary to meet consumer demands. While the difference is not statistically significant, it should also be noted that Warehousing Capacity expanded 5.9 points slower in the second half of August than it did in the first half of the month(63.2 to 57.3), suggesting that further tightening could be on the way as firms ramp up for Q4.
Future predictions suggest capacity will continue to come online over the next year as respondents are expecting an expansion rate of 61.1, down (-2.0) from July’s future prediction of 63.1. While we still see a difference between the different levels of the supply chain, the future predictions for Warehousing Capacity for Upstream (63.8) and Downstream (57.3) respondents is not nearly pronounced as the current split. This suggests that respondents across the supply chain are expecting available storage capacity and demand to move back into equilibrium over the next 12 months.
Warehousing Utilization
Warehousing Utilization reads in at 57.8, which is up (+5.8) from July’s reading of 52.5. This reading is down 7.5 points from the reading from one year ago, and down 9.5 points from the reading from two years ago. This is the highest reading for this metric since February of this year when supply chains were still working through excess inventories left over from Q4. Warehousing Utilization expanded at a similar rate for both Upstream (58.2) and Downstream (57.0) respondents. This is a marked change from July, when Downstream firms reported a growth rate 16-points greater than Upstream firms, who reported contraction. This shift may indicate that supply chains are beginning to ramp up again ahead of peak season.
Looking forward to the next 12 months, the predicted Warehousing Utilization index is 61.1, which is up (+1.8) from July’s future prediction of 59.3. Downstream firms are more bullish on future utilization, predicting an expansionary rate of 64.9 – 4.2 points higher than the Upstream prediction of 60.7-point growth.
Warehousing Prices
The Warehousing Price index reads in at 63.4, which is up (+2.8) from July’s reading of 60.6 – which was the second-lowest reading in the history of the index. In last month’s report we wondered if the downward trend would continue and a new nadir would be reached. However, with move back towards inventory growth at the retail level it seems they have rebounded slightly. Prices are much lower than a year (-11.6) or two years (-24.6) ago but do continue to expand. The rate of expansion is felt most keenly by larger firms who report Warehousing Price growth of 68.8, which is 9.2 points higher than the 59.6 reported by smaller respondents.
Future predictions suggest prices growth will remain healthy as respondents are expecting prices to continue to grow at a rate of 66.4, up (+3.0) from July’s future prediction of 63.4. This suggests that firms are planning to stock up on inventory over the next year and are anticipating that the costs of doing so will be high. Downstream firms expect a slightly faster rate of price expansion at 69.4 relative to Upstream expectations of 64.3.
Transportation Capacity
The Transportation Capacity Index registered 60.5 percent in August 2023. This constitutes a drop of 5.1 points from the July reading of 65.6. With this drop the Transportation Capacity Index has continued its retreat from the all-time highs. However, the capacity index continues to remain above the critical threshold of 50, indicating moderate expansion. The drop is even more significant for the Downstream Transportation Capacity index which is at 54.7, while the Upstream index is at 64.4.
The future Transportation Capacity index indicates 54.1 corresponding to a drop of 2.1 points from the previous reading and continuing to indicate expectations of slight growth. The Downstream future Transportation Capacity index is at 52.3 while the Upstream future transportation capacity index indicates 55.8. As such, expectations of dampened growth in which capacity and demand move back towards equilibrium are relatively uniformly distributed across the supply chain.
Transportation Utilization
The Transportation Utilization Index registered 50.0 in August 2023. This corresponds to a jump of 8.2 points from last month’s reading of 41.8, which was the all-time low for this metric. With this increase, Transportation Utilization rebounds back to the neutral position, indicating a steady state. This month’s reading is down 1.6 points from the same time last year, and 22.6 points down from two years ago. The Downstream Transportation Utilization Index jumps to 61.4 indicating expansion, while the Upstream index remains in contraction territory at 43.7.
The future Transportation Utilization Index also increased significantly from the previous reading and indicates expansion at a 63.4 level for the next 12 months. As such, logistics managers expect increased transportation activity growth over the near future, especially in the downstream where transportation utilization index indicates expansion at 70.0. The Upstream Transportation Utilization Index also moved into the expansion territory at 59.1. With these large increases, the expectations of increased Transportation Utilization over the next year are spread across the supply chain, with Downstream companies leading the comeback.
Transportation Prices
The Transportation Prices Index indicates 42.9, a jump of 7.3 points from last month’s reading of 35.6 and continuing the rebound that started in the beginning of the summer. Hence, the downward pressure on Transportation Prices continues to ease but the index remains slightly in contraction territory. The Downstream Transportation Prices index at 48.9 while the Upstream index at 40.0, both remaining in the contraction territory for now but showing signs of continued rebound. If the current trends continue, it is possible that we will see price growth on the Downstream side soon, which would be the first such instance in over a year.
The future index for Transportation Prices remains above the critical level and is at 65.3, indicating increased expectations of higher Transportation Prices in the next 12 months. The Downstream Transportation Prices index is at 67.4 while the Upstream Transportation Prices Index is at 63.6, so the expectations of higher prices coming to transportation over the next year are dispersed across the supply chain.
About This Report
The data presented herein are obtained from a survey of logistics supply executives based on information they have collected within their respective organizations. LMI® makes no representation, other than that stated within this release, regarding the individual company data collection procedures. The data should be compared to all other economic data sources when used in decision-making.
Data and Method of Presentation
Data for the Logistics Manager’s Index is collected in a monthly survey of leading logistics professionals. The respondents are CSCMP members working at the director-level or above. Upper-level managers are preferable as they are more likely to have macro-level information on trends in Inventory, Warehousing and Transportation trends within their firm. Data is also collected from subscribers to both DC Velocity and Supply Chain Quarterly as well. Respondents hail from firms working on all six continents, with the majority of them working at firms with annual revenues over a billion dollars. The industries represented in this respondent pool include, but are not limited to: Apparel, Automotive, Consumer Goods, Electronics, Food & Drug, Home Furnishings, Logistics, Shipping & Transportation, and Warehousing.
Respondents are asked to identify the monthly change across each of the eight metrics collected in this survey (Inventory Levels, Inventory Costs, Warehousing Capacity, Warehousing Utilization, Warehousing Prices, Transportation Capacity, Transportation Utilization, and Transportation Prices). In addition, they also forecast future trends for each metric ranging over the next 12 months. The raw data is then analyzed using a diffusion index. Diffusion Indexes measure how widely something is diffused or spread across a group. The Bureau of Labor Statistics has been using a diffusion index for the Current Employment Statics program since 1974, and the Institute for Supply Management (ISM) has been using a diffusion index to compute the Purchasing Managers Index since 1948. The ISM Index of New Orders is considered a Leading Economic Indicator.
We compute the Diffusion Index as follows:
PD = Percentage of respondents saying the category is Declining,
PU = Percentage of respondents saying the category is Unchanged,
PI = Percentage of respondents saying the category is Increasing,
Diffusion Index = 0.0 * PD + 0.5 * PU + 1.0 * PI
For example, if 25 say the category is declining, 38 say it is unchanged, and 37 say it is increasing, we would calculate an index value of 0*0.25 + 0.5*0.38 + 1.0*0.37 = 0 + 0.19 + 0.37 = 0.56, and the index is increasing overall. For an index value above 0.5 indicates the category is increasing, a value below 0.5 indicates it is decreasing, and a value of 0.5 means the category is unchanged. When a full year’s worth of data has been collected, adjustments will be made for seasonal factors as well.
Logistics Managers Index
Requests for permission to reproduce or distribute Logistics Managers Index Content can be made by contacting in writing at: Dale S. Rogers, WP Carey School of Business, Tempe, Arizona 85287, or by emailing [email protected] Subject: Content Request.
The authors of the Logistics Managers Index shall not have any liability, duty, or obligation for or relating to the Logistics Managers Index Content or other information contained herein, any errors, inaccuracies, omissions or delays in providing any Logistics Managers Index Content, or for any actions taken in reliance thereon. In no event shall the authors of the Logistics Managers Index be liable for any special, incidental, or consequential damages, arising out of the use of the Logistics Managers Index. Logistics Managers Index, and LMI® are registered trademarks.
About The Logistics Manager’s Index®
The Logistics Manager’s Index (LMI) is a joint project between researchers from Arizona State University, Colorado State University, University of Nevada, Reno, Florida Atlantic University, and Rutgers University, supported by CSCMP. It is authored by Zac Rogers Ph.D., Steven Carnovale Ph.D., Shen Yeniyurt Ph.D., Ron Lembke Ph.D., and Dale Rogers Ph.D.
[1] Casselman, B. (2023, September 1). Pay Gains Are Slowing, Easing Worries on Inflation. The New York Times. https://www.nytimes.com/2023/09/01/business/economy/wage-growth-inflation.html
[2] Smialek, J. (2023, August 31). Inflation and Consumers Show Staying Power as Fed Eyes Another Rate Move. The New York Times. https://www.nytimes.com/2023/08/31/business/economy/fed-inflation-july.html
[3] Guilford, G. (2023, September 1). Job Gains Eased in Summer Months; Unemployment Increased in August. WSJ. https://www.wsj.com/economy/jobs/jobs-report-august-today-unemployment-economy-de847415
[4] Kingston, J. (2023, September 1). Truck transportation jobs plummet in August. FreightWaves. https://www.freightwaves.com/news/truck-transportation-jobs-plummet-in-august
[5] Shapiro, A. (2023, August 15). Supply- and Demand-Driven PCE Inflation—Through July 2023. San Francisco Fed. https://www.frbsf.org/economic-research/indicators-data/supply-and-demand-driven-pce-inflation/
[6] Hannon, P. (2023, August 31). Stubborn Inflation Proves Difficult to Tame in Europe. WSJ. https://www.wsj.com/economy/stubborn-inflation-proves-difficult-to-tame-in-europe-40cc4fc8
[7] Douglas, J., & Li, C. (2023, August 31). China’s Economy Shows Fresh Weakness in Factories, Housing and Consumer Spending. WSJ. https://www.wsj.com/world/china/chinas-economy-shows-fresh-signs-of-weakness-in-factories-consumer-spending-ad46fa8a
[8] University of Michigan. (2023, August 31). Surveys of Consumers. Survey of Consumer – Final Results for August 2023. http://www.sca.isr.umich.edu/
[9] Bernard, T. S. (2023, August 31). Student Loan Payments Are Due Again. Here Are 5 Things to Know. The New York Times. https://www.nytimes.com/2023/08/31/your-money/student-loan-payments-resume.html
[10] Guilford, G. (2023, September 1). Job Gains Eased in Summer Months; Unemployment Increased in August. WSJ. https://www.wsj.com/economy/jobs/jobs-report-august-today-unemployment-economy-de847415
[11] Berger, P. (2023b, August 29). Where Peak-Season Shipping Is Headed, In Charts. Wall Street Journal. https://www.wsj.com/articles/where-peak-season-shipping-is-headed-in-charts-f15be0ab
[12] LaRocco, L. A. (2023, August 31). Port of New York and New Jersey moves the most TEUs since October 2022. FreightWaves. https://www.freightwaves.com/news/port-of-new-york-and-new-jersey-moves-the-most-teus-since-october-2022
[13] Paris, C. (2023a, August 18). The Panama Canal Has Become a Traffic Jam of the Seas. WSJ. https://www.wsj.com/business/logistics/panama-canal-drought-causes-traffic-problems-ecd9d335
[14] Berger, P. (2023c, August 31). Dockworkers Ratify Labor Deal at West Coast Ports. Wall Street Journal. https://www.wsj.com/articles/dockworkers-ratify-labor-deal-at-west-coast-ports-f0dc23e
[15] Krugman, P. (2023, August 31). Opinion | Why Is China in So Much Trouble? The New York Times. https://www.nytimes.com/2023/08/31/opinion/china-xi-jinping-policy-thrift.html
[16] Swanson, A., & Bradsher, K. (2023, August 31). The U.S. and China Are Talking Again. Where It Will Lead Is Unclear. The New York Times. https://www.nytimes.com/2023/08/31/business/economy/us-china-talks-gina-raimondo.html
[17] Fitch, A. (2023, August 26). Nvidia Supply Concerns Ease, but Long-Term Challenges Remain. WSJ. https://www.wsj.com/tech/ai/nvidia-supply-concerns-ease-but-long-term-challenges-remain-a259dc54
[18] Young, L. (2023, August 24). Target Goes Local to Speed Up Order Deliveries. Wall Street Journal. https://www.wsj.com/articles/target-goes-local-to-speed-up-order-deliveries-bb7b9251
[19] Berger, P. (2023a, August 23). Bankrupt Trucker Yellow’s Real Estate Is in High Demand. Wall Street Journal. https://www.wsj.com/articles/bankrupt-trucker-yellows-real-estate-is-in-high-demand-9822e78e
[20] Strickland, Z., FW Market Expert &. Market. (2023, August 28). Truckload capacity tightens in August. FreightWaves. https://www.freightwaves.com/news/truckload-capacity-tightens-in-august


