LMI® at 61.4, Growth is INCREASING AT AN INCREASING RATE for Inventory Levels, Inventory Costs, Warehousing Utilization, Warehousing Prices, Transportation Capacity, and Transportation Utilization
Growth is INCREASING AT A DECREASING RATE for NOTHING. Warehousing Capacity and Transportation Prices are CONTRACTING.
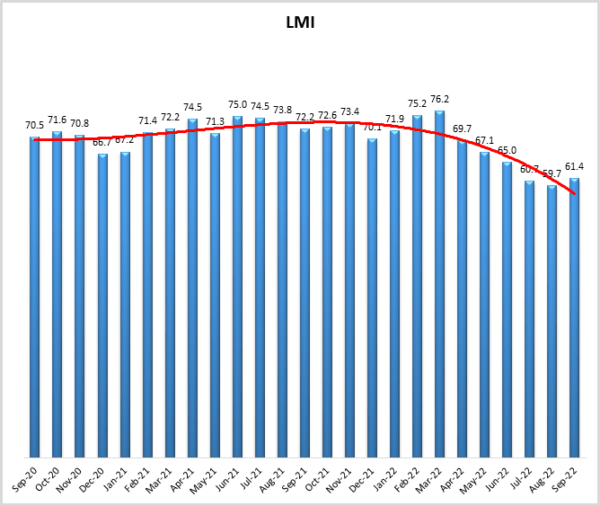
The Logistics Managers’ Index reads in at 61.4 in September, up (+1.7) from August’s reading of 59.7, and marking a return to the ’60s after a one-month detour into the ’50s. in August, down (-1.0) from July’s reading of 60.7. The sustained growth in the logistics industry continues to be fueled by high levels of inventory and the associated levels of cost and utilization associated with holding them. On the other hand, transportation metrics continue their slowed pace, reaching the second highest level of capacity growth, and the third fastest rate of price contraction in the history of the index. Interestingly, Transportation Utilization is the outlier here, as both utilization metrics in the index were up significantly in September. Essentially, it seems that inventory has been moved early and is ready to go for Q4. The question now is whether it will start moving soon, or if systems will remain clogged through the rest of 2022.
Researchers at Arizona State University, Colorado State University, Rochester Institute of Technology, Rutgers University, and the University of Nevada, Reno, and in conjunction with the Council of Supply Chain Management Professionals (CSCMP) issued this report today.
Results Overview
The LMI score is a combination of eight unique components that make up the logistics industry, including inventory levels and costs, warehousing capacity, utilization, and prices, and transportation capacity, utilization, and prices. The LMI is calculated using a diffusion index, in which any reading above 50.0 indicates that logistics is expanding; a reading below 50.0 is indicative of a shrinking logistics industry. The latest results of the LMI summarize the responses of supply chain professionals collected in September 2022. Overall, the LMI is up (+1.7) from August’s reading of 59.7. Every metric other than Transportation Prices and Warehousing Capacity is growing at a faster rate this month, pointing to some potential bounce-back potential in the logistics industry.
“It was the best of times, it was the worst of times”. This is the opening quote of Charles Dickens’ The Tale of Two Cities, but in September 2022 this could also be applied to the LMI, and the massive differences we see between our Warehousing and Transportation metrics. Transportation continues its slump, while Warehousing is chugging along at the same breakneck pace we have observed for much of this post-pandemic recovery period.
Much of this confusion can be attributed to the high levels of inventory that continue to permeate global supply chains. Inventory Levels are up (+4.4) to 71.9 – which as a value over 70.0 we would classify as a significant rate of expansion. Inventories have been high all through 2022, largely due to goods that were late arriving due to supply chain congestion, a shift in consumer spending towards services, and high levels of inflation. The August rate of inflation in the U.S. was higher than expected, with core inflation up 4.9% on a year-over-year basis. Headline inflation was curbed by falling fuel prices, increasing only 0.3% over the same period[1]. Dow industrials officially fell into bear market territory in the final week of September, as investors continue to grow nervous due to burgeoning interest rates and slipping consumer sentiment. This dip has led multiple experts and company executives to worry that the Fed’s current plans are too “aggressive” and may end up pushing the economy until it “breaks”[2]. At the same time, Bloomberg predicts that the U.S. jobs report coming out at the end of this week will show that payrolls increased by approximately 250,000 jobs, keeping unemployment at 3.7%, just off the 50-year low reached this summer[3]. This rosy picture is at least partially due to the five-month low in weekly jobless claims observed in the last week of September as firms began bulking up for Q4[4].
The glut of inventory and lack of space continues to drive Inventory Costs up (+0.4) with that metric reading in at 77.2 in September. It is not only finished goods clogging the systems, work-in-process (WIP) inventory continues to bedevil supply chains. At the end of September Ford reported 40,000 to 45,000 vehicles that could not be delivered due to missing components ranging from chips and semiconductors (the old standbys of missing components) to the blue oval plate bearing the “Ford” insignia. Auto sales have increased through 2022 (up 27% in August for Ford), and some executives are hopeful that the increase will continue into Q4 if there is more high-end inventory available[5]. Despite grim economic outlooks in some corners, U.S. consumers remain resilient, with spending up in August by 0.4 percent on a seasonally adjusted basis. This shift back towards growth comes after the slight dip (-0.2% year-over-year) we observed in July. There is some evidence that the decline in gas prices, along with the continued strength in the labor market has provided a boon to consumers. However, this spending growth can primarily be attributed to essentials like rent and food, with fewer dollars being spent on goods – causing inventories to continue to accumulate[6]. In response to high inventories and muted spending, Firms like Target and Walmart have very publicly marked down goods as part of their strategy to work through excess inventories quickly. Interestingly, this is putting pressure on smaller retailers who do not have excess inventory to run promotions as well as to stay competitive in the slowing retail environment. For instance, UBS Group reports that apparel and footwear retailers offered a discount of 16% on average in August – regardless of inventory levels[7].
Much of this idle inventory is currently sitting in warehouses. Warehousing Capacity read in at 44.3 in September. This is up (+2.1) from August’s reading of 42.2 but still well into contraction territory. This is the 25th consecutive month of contraction for this metric, highlighting the continued difficulty firms have had to store the massive amount of inventory currently in the system. Nike is emblematic of the issues firms have been having, reporting inventories up 44% in the most recent quarter, leading to a 12% drop in stock price on the final day of September[8]. However, Nike anticipates that inventories will begin to normalize in Q4 – if consumer spending remains strong and does not contract significantly[9]. The shortage of available space has led some large retailers to bring increased levels of automation inside of their own facilities. The hope is that by increasing the use of robotics they will be able to combat both the labor and facility shortage and increase capabilities to fulfill online orders out of stores and other sites they may own already[10]. This lack of space along with firms pushing goods forward in anticipation of Q4 likely explains the massive jump (+11.5) we observe in the Warehousing Utilization metric, which was up to 76.8 in September. This is the second highest reading in the history of this metric, and the fastest rate of expansion in four and a half years. The lack of space and high utilization have contributed to the high rate of expansion for Warehousing Prices (+0.4) which read in at 75.4 in September. In a corollary to the prolonged contraction in our capacity metric, Warehousing Prices have now grown at a rate over 70.0 – which we would consider a significant rate of expansion – for two consecutive years.
Anecdotally, there has been some hope that space is starting to open up. For instance, Amazon has delayed the construction of approximately 66 planned sites as eCommerce demand has stabilized. However, it is important to remember that essentially doubled its warehousing footprint, going from 165 million square feet in early 2020 to 379 million square feet today. Amazon may be slowing the rate of expansion as they attempt to right-size for the “new normal” – which is well above whatever the “old normal” was[11]. This is reflected in Amazon increasing its pay to $19 per hour in an attempt to bolster its ranks and ensure high levels of customer service in anticipation of strong demand for eCommerce goods during Q4. This comes after they dropped nearly 100,000 employees this Spring, suggesting that the contraction was more of a seasonal adjustment than a declaration of the direction they believed the company to be headed in. Amazon will also continue following its strategy from 2021 holding an early Prime Day in an attempt to spread out demand more smoothly throughout Q4[12].
It is possible that inventories are merely in a holding pattern and will begin moving again when goods spending picks back up in Q4; we will not know for certain though for at least another 1-2 months. What we do know however is that right now inventory is moving at a much slower rate than what we have seen over the last two years. Transportation Capacity is up (+7.5) to 71.8, the second-highest rate in the six-year history of the LMI. Even if freight demand goes up in Q4, firms are pessimistic in regard to achieving a similar level of utilization to last year. Delivery companies are projecting to handle approximately 92 million parcels per day during the holiday shopping season. While this is well above the pre-pandemic norm, firms have built up the capacity to handle 110 million packages, meaning that some of this will likely go unused, softening Q4 Transportation Prices relative to what we have seen in years past[13]. Those prices are certainly softer at the end of Q3, dropping (-3.5) to 44.5, which is the strongest level of contraction since the height of lockdowns in April of 2020. Transportation Capacity (green line) and Transportation Prices (orange line) have switched places over the last year. Prices were growing at a rate of 92.4, while Capacity was contracting at a rate of 37.2 in September 2021 for a 55.1-point advantage for the Price index. That has slipped in 2022, with Capacity growing at a rate of 71.8, and Prices contracting at 44.5 for a 27.3-point discrepancy in the other direction (an 83.2-point swing).
Standing as an outlier here is Transportation Utilization, which is up (+9.5) to 61.1. This may be representative of firms cutting costs by combining loads to achieve economies of scale. FedEx and UPS continue to increase rates to deal with fuel costs and slipping demand. Shippers are likely continuing the practices they followed during the tight freight market of the last few years, it will be interesting to see whether they continue to pursue this practice even as capacity loosens and shippers continue to gain leverage over carriers. Many shippers rank on-time delivery and cost as their two most important KPIs[14]; meaning that while excess capacity and lower prices may hurt carriers, shippers and consumers may actually see some benefits.
This bifurcation in the logistics industry can be seen most clearly in the contrast of Warehousing Prices (blue line) and Transportation Prices (red line) from May 2020 to September 2022. May of 2020 was selected as the starting point for this chart because that was the month that we began to see the bounce back of logistics services begin in earnest after the early lockdown. Demand for both warehousing was high from the second half of 2020 through the first quarter of 2022, and the rates of price growth reflected it. For much of 2020 and 2021, the two metrics moved in similar patterns. However, after March of 2022 (when the overall index peaked and the two price metrics were only 0.8 points apart), there has been a significant divergence. The rate of growth for both Warehousing and Transportation Prices has dropped, but the latter has decreased much more significantly – moving into contraction territory over the last three months. The 0.8-point split of March has grown to a 30.9-point gulf in September. Meetings and conversations in the hallway at September’s CSCMP conference reflected this gap on an anecdotal level, with many transportation professionals speaking about the challenges of a softening market, and industrial real estate representatives struggling to keep up with burgeoning demand and no space. Because of this, it has become difficult to fully assess the health of the economy.
The average rate of change for the price metrics was within only a few points of one another in 2020 and in 2021, but in 2022 that clearly changed:
| Average Price by Year | 2020 | 2021 | 2022 |
| Warehouse Price | 68.4 | 84.5 | 82.3 |
| Transportation Price | 68.0 | 89.9 | 67.8 |
A frequent comment from players throughout the supply chain has been that normal seasonal patterns do not apply to 2022 as many goods were shipped early. The executive director of the Port of Los Angeles Gene Seroka recently stated: “Some goods that usually arrive in August the for the fall and winter season shipped earlier to make sure they reached their destination in time,”[15]. This notion was echoed by Maersk’s CEO Soren Skou, who believes that the slowdown in ocean demand is because the “normal cyclicality of global trade has been suspended for the last couple of years,”[16]. Essentially, many of the goods that firms need for Q4 got here earlier than normal, leading to a considerable muting of the shipping peak and congestion that would usually happen in Q3. However, just because inventories have stopped moving, does not mean that they will idle forever. Consumer spending remains steady, and warehouses are bursting with inventory. Borrowing a concept from physics, perhaps this inventory can be viewed as potential energy, waiting to be released during the Q4 spending rush. If this turns out to be the case and transportation markets pick up to move this inventory to storefronts or directly to consumers, it might then convert to kinetic energy actively moving through supply chains.
The argument against September as a bounce-back from the floor we hit in August can be found in the breakdown of responses from early September (the first to the fifteenth, represented by the gold bars) relative to late September (the sixteenth to thirtieth, represented by the green bars). The overall LMI in late September was significantly lower (-7.4) than what we saw in early September. This was largely due to significant drops in the rate of growth for Inventory Levels (-9.5) and Costs (-9.4), along with big changes in Transportation Capacity (+9.2) and Transportation Prices (-14.0). The move in Transportation Prices is notable as the index moved from expansion in the first half of the month to sharp contraction during the back half. This is rapid change may be attributable to the beginnings of a sharp slow down (potentially brought on by interest rates and inflation destroying demand), or conversely could be a wave of calm before increased activity we may see during Q4. At this point is it impossible to tell for certain, but what is clear is that the rate of growth in the logistics industry slowed drastically in late September – a time when things would be picking up in normal times.
| Inv. Lev. | Inv. Costs | WH Cap. | WH Util. | WH Price | Trans Cap | Trans Util. | Trans Price | LMI | |
| 9/1-9/15 | 75.8 | 81.3 | 44.6 | 79.2 | 74.2 | 67.7 | 63.1 | 50.8 | 63.6 |
| 9/16-9/30 | 66.3 | 71.9 | 44.0 | 73.5 | 77.0 | 76.9 | 58.7 | 36.8 | 56.2 |
| Delta | 9.5 | 9.4 | 0.6 | 5.8 | 2.8 | 9.2 | 4.4 | 14.0 | 7.4 |
| Significant? | Marginal | Marginal | No | No | No | Yes | No | Yes | Yes |
The index scores for each of the eight components of the Logistics Managers’ Index, as well as the overall index score, are presented in the table below. six of the eight metrics show signs of growth. Warehousing Capacity has now tightened for 25 consecutive months, and Transportation Prices continue their Summer slide, contracting for the third straight month. In general however, we observe a bit of an uptick across many of our metrics, with rates of growth increasing for the inventory and utilization metrics, as well as for Warehousing Prices. It will be interesting to continue monitoring these rates of growth through Q4 to observe whether or not economic activity picks up during the holiday season, or remains somewhat muted.
| LOGISTICS AT A GLANCE | |||||
| Index | September 2022 Index | August 2022 Index | Month-Over-Month Change | Projected Direction | Rate of Change |
| LMI® | 61.4 | 59.7 | +1.6 | Growing | Slower |
| Inventory Levels | 71.9 | 67.6 | +4.4 | Growing | Slower |
| Inventory Costs | 77.2 | 76.8 | +0.4 | Growing | Slower |
| Warehousing Capacity | 44.3 | 42.3 | +2.1 | Contracting | Faster |
| Warehousing Utilization | 76.8 | 65.3 | +11.5 | Growing | Slower |
| Warehousing Prices | 75.4 | 75.0 | +0.4 | Growing | Slower |
| Transportation Capacity | 71.8 | 64.3 | +7.5 | Growing | Slower |
| Transportation Utilization | 61.1 | 51.6 | +9.5 | Growing | Slower |
| Transportation Prices | 44.5 | 48.0 | -3.5 | Contracting | Faster |
This month, Downstream firms (orange bars) reported significantly tighter rates of Warehousing Capacity than their Upstream counterparts (blue bars). This is likely reflective of the high amount of inventories currently being held by retailers in anticipation of consumer activity in Q4. We have observed the inventory slowly trickling down from Upstream suppliers to Downstream retailers over the last few months, and now much of it finally appears to be within the downstream systems (although, a 48.5 in Warehousing Capacity for Upstream firms is still reflective of a very tight market). Downstream firms are hoping to run through much of this inventory in the next few months, and according to what we’ll see next in the future predictions, seem optimistic that they might do so.
| Inv. Lev. | Inv. Costs | WH Cap. | WH Util. | WH Price | Trans Cap | Trans Util. | Trans Price | LMI | |
| Upstream | 68.8 | 74.6 | 48.5 | 76.9 | 75.4 | 70.6 | 58.8 | 43.5 | 59.0 |
| Downstream | 75.5 | 80.6 | 38.8 | 76.5 | 75.5 | 73.5 | 64.3 | 45.9 | 62.3 |
| Delta | 6.8 | 6.0 | 9.7 | 0.4 | 0.1 | 2.9 | 5.5 | 2.4 | 3.3 |
| Significant? | No | No | Yes | No | Yes | No | No | No | No |
Respondents were asked to predict movement in the overall LMI and individual metrics 12 months from now. Their predictions for future ratings are presented below. Similar to what we observed in August, September’s future predictions hint at normalization and a return to business as usual over the next year. Respondents are predicting a greater level of relief in Warehousing Capacity (58.3) than they have in months. While we see hints of moderation across all cost/price metrics, Warehousing Prices are predicted to remain in the ’70s, indicating significant growth, while Transportation Prices are predicted to just barely increase at 50.4. Transportation Capacity may remain elevated (65.3) as carriers look to fill the millions of truckloads of excess capacity currently on hand. Finally, respondents have finally grown optimistic regarding moderations Inventory Levels, hoping to work through the backlog and come out with a future growth rate of 60.4 – which would be within only a few points of the all-time average for the metric, representing a return to “normal” after the roller coaster of the last three years.
The exact nature of the future predictions varies by supply chain position[17]. In September we observe a significant difference in anticipated Transportation Capacity over the next year. As is often the case regarding this metric, Downstream firms such as retailers anticipate a tighter transportation market than their Upstream counterparts. This may reflect anticipation of continued strength in the consumer economy and some softness upstream among manufacturers and in business-to-business transactions. Despite the massive differences in Transportation Capacity, both groups of respondents predict essentially no change in Transportation Price. In August Downstream respondents had been expecting significantly higher levels of Warehousing Utilization going forward, but in September there is no meaningful difference in this metric between the two groups.
| Futures | Inv. Lev. | Inv. Costs | WH Cap. | WH Util. | WH Price | Trans Cap. | Trans Util. | Trans Price | LMI |
| Upstream | 60.0 | 66.2 | 56.2 | 67.7 | 72.7 | 71.3 | 57.4 | 50.0 | 56.1 |
| Downstream | 60.2 | 65.3 | 61.2 | 65.3 | 686.4 | 56.1 | 61.2 | 50.0 | 55.9 |
| Delta | 0.2 | 0.8 | 5.1 | 2.4 | 4.3 | 15.2 | 3.9 | 0.0. | 0.3 |
| Significant? | No | No | No | No | No | Yes | No | No | No |
Historic Logistics Managers’ Index Scores
This period along with prior readings from the last two years of the LMI is presented table below:
| Month | LMI | Average for last 3 readings – 60.6
All-time Average – 65.0 High – 76.5 Low – 51.3 Std. Dev – 7.01
|
| Sep ‘22 | 61.4 | |
| Aug ‘22 | 59.7 | |
| July ‘22 | 60.7 | |
| June ‘22 | 65.0 | |
| May ‘22 | 67.1 | |
| Apr ‘22 | 69.7 | |
| Mar ‘22 | 76.2 | |
| Feb ‘22 | 75.2 | |
| Jan ‘22 | 71.9 | |
| Dec ‘21 | 70.1 | |
| Nov ‘21 | 73.4 | |
| Oct ‘21 | 72.6 | |
| Sep ‘21 | 72.2 | |
| Aug ‘21 | 73.8 | |
| July ‘21 | 74.5 | |
| June ‘21 | 75.0 | |
| May ‘21 | 71.3 | |
| Apr ‘21 | 74.5 | |
| Mar ‘21 | 72.2 | |
| Feb ‘21 | 71.4 | |
| Jan ‘21 | 67.2 | |
| Dec ‘20 | 66.7 | |
| Nov ‘20 | 70.8 | |
| Oct ‘20 | 71.6 | |
| Sep ‘20 | 70.5 |
LMI®
The overall LMI reads in at 61.4 in September, up (+1.4) from August’s reading of 59.7, returning to the 60’s after a one-month dip into the 50’s. The continued growth in the overall index is primarily due to the expansion in inventories, utilization of warehousing and transportation, as well as the related costs. It is moderated by the slowdown in transportation metrics. This is generally a peak season for supply networks (the overall network read in at 72.2, 11.8 points higher, this time last year). Seasonality would dictate that activity should pick up throughout the rest of the year, particularly if consumer spending is strong. Whether or not this will be the case remains to be seen.
Respondents seem to expect a slight slowdown in the rate of expansion, predicting a growth rate of 56.2, down (-1.4) from August’s future prediction of 57.6. They are predicting seven of the eight index components to be between 50-70 (with Warehousing Prices just barely over 70 at 70.6). This rate of growth would be down significantly from what we have seen since the start of 2020 and might suggest a “return to normal” for the logistics industry.
Inventory Levels
The Inventory Level value is 71.9, up (+4.3) from August’s reading of 67.6. this is down 8.3 from the index’s all-time highest value in February but is still 13.3 points higher than the same time last year, and 10.5 points higher than two years ago. This means that seasonally speaking, inventories remain quite elevated. Current higher-than-usual inventory growth may reflect earlier than usual efforts to be prepared for the holiday season, in case of production or shipping delays. The well-publicized retailer over-estimations of demand by retailers may still be playing a role. In recent months, we have said it seemed likely the index value may remain high, but will likely continue to decline, closer to the long-term average. The same prediction would also seem prudent this month. Respondents feel Inventory Levels will continue to grow, but the growth levels will decline in the future. However, if additional increases are made to interest rates, it would not be surprising if inventory levels would decline, and the Inventory Level Index were to fall below 50, at least temporarily. However, heading into the holiday season, it seems likely levels will continue to represent increasing levels for the end of the year, even if the index values do decline.
When asked to predict what conditions will be like 12 months from now, the average value is 60.4, virtually unchanged from last month’s value (60.0). Downstream is slightly higher (60.2 vs 60.0). Last month, downstream was slightly lower (59.7 vs 62.3). Interestingly, the average value of the previous two Septembers was 60.1, almost exactly equal to the average estimate.
Inventory Costs
The current Inventory Costs index value represents a stabilization after a recent downward trend. The value of 77.2 is an increase (+0.4) from August’s reading of 76.8. The previous several months have experienced a steady decline from the record high value in March, although values are still a bit high, above the long-term average of 74.9. Given the high Inventory Levels index value, it is not surprising that Inventory Costs remain high. Although it should be noted that this metric is down 9.4 points from the value last year, and up 11.4 points compared to two years ago. of 0.4 from last month. We saw above that inventory levels are likely to continue to rise but at a slower rate.
Given the expected increases in interest rates, it would seem likely that the Inventory Cost index will continue to reflect high values, even if the growth of inventory levels does moderate. Responses from participants are consistent with this prediction and predict strong increases in inventory costs. Downstream respondents were a slight 0.9 points higher than upstream (65.3 vs 66.2), giving an average value of 66.1. Putting all of these factors together, it seems very likely that the Inventory Cost index will continue to remain high, and whether it will remain high will likely largely depend on expectations about the economy, moving forward.
Warehousing Capacity
The September 2022 Warehousing Capacity index registered at 44.3 points this month, a 2.1-point increase from the month prior, is down 3.6 points from the reading one year ago, and up nearly 2 points from the reading two years ago. The continued contraction in capacity, though slightly ameliorated this month, has gone on for over 2 years now. Demand continues to outpace supply, despite recent reports of warehousing availability entering the market. Interestingly, the Upstream vs. Downstream breakdown for Warehousing Capacity shows that the Upstream capacity is nearly 10 percentage points higher than its Downstream counterparts, indicating that retailers are likely driving demand in this space. This increase could be due to a rise in inventory as retailers prepare for the holiday season which is likely to lead to an increase in demand for storage.
Looking forward to the next 12 months, respondents continue to expect moderate rates of growth, predicting an expansionary rate of 58.3, which is up (+5.7) from the relatively meager future growth rate of 52.6 predicted in August. As we will see below, respondents have become cautiously optimistic that increased capacity will also lead to slowing cost growth over the next year, providing a welcome relief throughout supply chains.
Warehousing Utilization
The September 2022 Warehousing Utilization index registered at 76.8, reflecting an 11.5-point increase from the month prior, 10.4 point increase from the reading one year ago, and up 5.7 points from two years ago. This reading, taken together with the continued tightening in the capacity could be indicative of the glut in inventory that has been reported across numerous industries. When comparing the Upstream vs. Downstream values on this measure, it seems that utilization is virtually identical, which is noteworthy given the lopsided nature of capacity availability Upstream vs. Downstream. This rather sharp increase in utilization could also indicate preparations for the months to come, in addition to a preparation for a reverse flow of goods as returns are likely to increase as the holiday season begins.
Looking forward to the next 12 months, the predicted Warehousing Utilization index is 67.0, up (+2.8) from August’s future prediction of 64.2 and more in line with the higher rates of Utilization we observed this month. This gives further credence to the theory that firms will continue to look for as many efficiencies as they can with regard to storage space – even if more comes on the market over the next year.
Warehousing Prices
The September 2022 Warehousing Price index came in at 75.4 this month, reflecting a minor 0.4-point increase. This reading is down by over 14 points from the reading one year ago, and up just under 5 points from the reading two years ago. When comparing the Upstream vs Downstream pricing, it appears that there is virtually no difference and that the intensity of price increases in this space is homogenous across the board. As was noted above, this is also noteworthy given the disparity in capacity availability, as one would expect that because the capacity is lower in the Downstream space, prices to be marginally higher. Previously this report noted that a “perfect storm for warehouse pricing is at hand: decreased supply and ever-increasing demand”, which is a trend we do not expect to ebb any time soon.
Future predictions suggest that respondents are expecting prices to continue to grow at a rate of 70.6, essentially identical (-0.2) to August’s future prediction of 70.8, Even if some warehousing space comes online, respondents are pessimistic that it will be enough to take significant pressure off of price growth.
Transportation Capacity
The Transportation Capacity Index registered 71.8 percent in September 2022. This constitutes an increase (+7.5) from the August reading of 64.3. This is a staggering 50.0-point increase from two years ago when we recorded an all-time record rate of contraction at 23.8 as supply chains lurched back to life after the first waves of lockdown. With this increase, the Transportation Capacity Index reaches a new 2-year high and its second-highest level ever, The swell in capacity reaches across the supply chain, with the upstream index indicating 70.6 and the downstream index indicating 73.5. This month’s reading only trails behind April 2019’s reading of 72.0 – a reading which marked the beginning of the freight recession of 2019. Whether or not a freight recession similar to what we saw in 2019 is imminent or not, it is clear that the snapback that was always going to come after two straight years of contraction is here.
The future Transportation Capacity Index also indicates expansion, registering 65.3, up (+1.0) from August’s future prediction of 64.3. Upstream firms indicate a future transportation capacity index of 71.3 while downstream firms indicate a future expectation of only 56.1. As such, capacity increase expectations remain greater for upstream firms than for downstream firms.
Transportation Utilization
The Transportation Utilization Index registered 61.1 percent in September 2022. This denotes a sharp increase (+9.5) from the 51.6 level registered in August. This represents an interesting outlier among the transportation metrics. Transportation Prices and Utilization generally trend together, so one might expect Utilization to drop as well, particularly as Capacity grows so quickly. This seeming aberration may be representative of the push to cut costs at many firms, potentially by combining loads as much as possible. Many of the cost-saving habits firms picked up in the 2008 recession carried over into the next decade, perhaps we are seeing the beginning of something similar here as firms retain some of the efficiencies they implemented during the tight freight market of 2020-2021. The downstream Transportation Utilization Index is at 64.3, while the upstream index is at 58.8. As such, the data indicates that the increase in transportation utilization is spread across the supply chain, with downstream firms reporting a greater utilization rate than downstream firms.
The future Transportation Utilization Index reads in at 58.9, which is also up (+2.6) from August’s future projection of 56.3. The moderate expectations of future growth are also dispersed across the supply chain, with the downstream future index indicating 61.2 and upstream indicating 57.4.
Transportation Prices
The Transportation Prices Index read in at 44.5, once again increasing the rate of decline (-3.5) from August’s reading of 48.0. With this drop, the Transportation Prices Index sets a new 2-year low. This is the second-lowest reading for Transportation Prices in the history of the index, above only the 37.7 observed in April 2020 at the height of lockdowns. The nearly 43.5-point drop in Transportation Prices contrasts with the 50.0-point spike we observed in Transportation Capacity, providing more evidence of the new reality carriers are observing as some market power shifts back towards shippers. The price index drop is slightly more pronounced for Upstream supply chain firms, where the price index is at 43.5, and the Downstream transportation price index is at 45.9.
The future index for Transportation Prices remain is at 50.4, down (-5.7) from August’s reading of 56.1, indicating expectations of relatively flat transportation prices for the next year. These price expectations are evenly dispersed across the supply chain.
About This Report
The data presented herein are obtained from a survey of logistics supply executives based on information they have collected within their respective organizations. LMI® makes no representation, other than that stated within this release, regarding the individual company data collection procedures. The data should be compared to all other economic data sources when used in decision-making.
Data and Method of Presentation
Data for the Logistics Manager’s Index is collected in a monthly survey of leading logistics professionals. The respondents are CSCMP members working at the director level or above. Upper-level managers are preferable as they are more likely to have macro-level information on trends in Inventory, Warehousing and Transportation trends within their firm. Data is also collected from subscribers to both DC Velocity and Supply Chain Quarterly as well. Respondents hail from firms working on all six continents, with the majority of them working at firms with annual revenues over a billion dollars. The industries represented in this respondent pool include, but are not limited to: Apparel, Automotive, Consumer Goods, Electronics, Food & Drug, Home Furnishings, Logistics, Shipping & Transportation, and Warehousing.
Respondents are asked to identify the monthly change across each of the eight metrics collected in this survey (Inventory Levels, Inventory Costs, Warehousing Capacity, Warehousing Utilization, Warehousing Prices, Transportation Capacity, Transportation Utilization, and Transportation Prices). In addition, they also forecast future trends for each metric ranging over the next 12 months. The raw data is then analyzed using a diffusion index. Diffusion Indexes measure how widely something is diffused, or spread across a group. The Bureau of Labor Statistics has been using a diffusion index for the Current Employment Statics program since 1974, and the Institute for Supply Management (ISM) has been using a diffusion index to compute the Purchasing Managers Index since 1948. The ISM Index of New Orders is considered a Leading Economic Indicator.
We compute the Diffusion Index as follows:
PD = Percentage of respondents saying the category is Declining,
PU = Percentage of respondents saying the category is Unchanged,
PI = Percentage of respondents saying the category is Increasing,
Diffusion Index = 0.0 * PD + 0.5 * PU + 1.0 * PI
For example, if 25 say the category is declining, 38 say it is unchanged, and 37 say it is increasing, we would calculate an index value of 0*0.25 + 0.5*0.38 + 1.0*0.37 = 0 + 0.19 + 0.37 = 0.56, and the index is increasing overall. An index value above 0.5 indicates the category is increasing, a value below 0.5 indicates it is decreasing, and a value of 0.5 means the category is unchanged. When a full year’s worth of data has been collected, adjustments will be made for seasonal factors as well.
Logistics Managers Index
Requests for permission to reproduce or distribute Logistics Managers Index Content can be made by contacting in writing at: Dale S. Rogers, WP Carey School of Business, Tempe, Arizona 85287, or by emailing [email protected] Subject: Content Request.
The authors of the Logistics Managers Index shall not have any liability, duty, or obligation for or relating to the Logistics Managers Index Content or other information contained herein, any errors, inaccuracies, omissions, or delays in providing any Logistics Managers Index Content, or for any actions taken in reliance thereon. In no event shall the authors of the Logistics Managers Index be liable for any special, incidental, or consequential damages, arising out of the use of the Logistics Managers Index. Logistics Managers Index, and LMI® are registered trademarks.
About The Logistics Manager’s Index®
The Logistics Manager’s Index (LMI) is a joint project between researchers from Arizona State University, Colorado State University, University of Nevada, Reno, Rochester Institute of Technology, and Rutgers University, supported by CSCMP. It is authored by Zac Rogers Ph.D., Steven Carnovale Ph.D., Shen Yeniyurt Ph.D., Ron Lembke Ph.D., and Dale Rogers Ph.D.