- LMI® at 70.5%
- Growth is INCREASING AT AN INCREASING RATE for Inventory Levels, Inventory Costs, Warehousing Utilization, Warehousing Utilization, Warehousing Prices, Transportation
- Utilization, and Transportation Prices
- Warehousing Capacity and Transportation Capacity are CONTRACTING AT AN INCREASED RATE.
Growth rates in the logistics industry are roaring. Continuing its swift recovery from April’s all-time low overall score of 51.3, the LMI registered at 70.5 in September, its first entry in the ’70s since October 2018. September’s robust readings are driven primarily by the tightening capacity in both transportation and warehousing as the demand for logistics services increases ahead of Q4. The tight capacity has resulted in subsequent increases in all prices and utilizations, with Transportation Prices, in particular, up sharply, matching a two-year high at 87.9. Ecommerce is expected to be at record-high levels during the holidays and retailers are restocking their inventories, especially those coming from international suppliers that had seen difficulty making regular deliveries early on during lockdown. As mentioned last month, digital-heavy retail methods allow concerned shoppers to avoid in-person stores but are also more logistics resource intensive. Logistics-intensive commerce becoming a more significant proportion of retail activity explains why the metrics tracked in the LMI are increasing at rates not seen since mid-2018, in spite of the relatively modest overall economic growth. It is also important to point out that the LMI measures change rates, not overall productivity. So, while the Transportation Prices reading of 87.9 in September 2020 matches the reading from October 2018, It does not necessarily mean that prices now are equal to prices then, only that they’re growing at a similar rate.
Researchers at Arizona State University, Colorado State University, Rochester Institute of Technology, Rutgers University, and the University of Nevada, Reno, and in conjunction with the Council of Supply Chain Management Professionals (CSCMP) issued this report today.
Results Overview
The LMI score is a combination of eight unique components that make up the logistics industry, including inventory levels and costs, warehousing capacity, utilization, and prices, and transportation capacity, utilization, and prices. The LMI is calculated using a diffusion index, in which any reading above 50 percent indicates that logistics is expanding; a reading below 50 percent is indicative of a shrinking logistics industry. The latest results of the LMI summarize the responses of supply chain professionals collected in September 2020. As we have seen all summer, this month’s LMI displays rapid growth in price and utilization metrics and a drop-off in available capacity. Due to these factors, the cost of holding inventory remains high.
Overall, the LMI is up (+4.5) from August’s reading of 66.0. After three consecutive readings in the ’60s, the overall index is back into the ’70s for the first time since October of 2018. This is only the sixth time in the four-year history of the LMI that the overall index has been this high – indicating that the logistics industry is currently in the midst of a significant expansion. As discussed in August’s report, logistics services are in higher demand as consumers rely more heavily on e-commerce due to the COVID-19 pandemic. The growth has been significant, with e-commerce up 44% as a percentage of total retail in the U.S.[1].
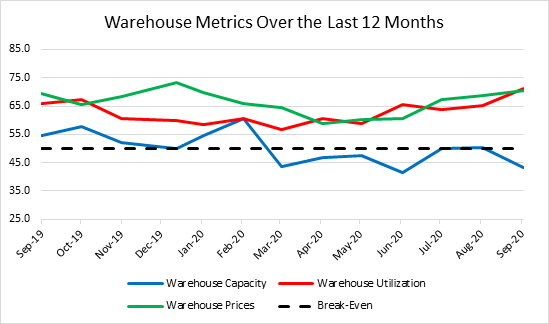
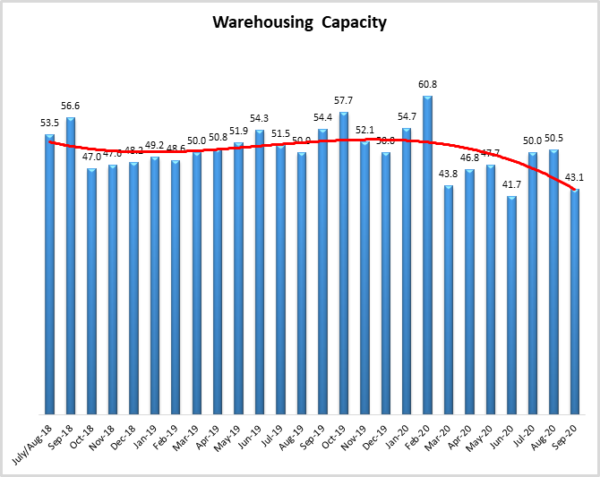
The strains this rapid shift to e-commerce has put onto firms are most visible in our warehousing metrics. Available Warehousing Capacity has been intensely restricted, dropping 7.4 points down to a reading of 43.1. Speedy last-mile delivery requires urban or urban adjacent facilities with high storage capacity. Because of this, demand is particularly pronounced for large, “big box” warehouses[2] that are close enough to provide the majority of consumers with the same- or next-day delivery. The crunch on capacity has led to subsequent spikes in both Warehousing Utilization and Warehousing Prices, which both found themselves in the ’70s for the first time this year (and for Warehousing Utilization, the first time in 2 years). Utilization rates were higher (+13.1) for downstream, consumer-facing respondents, corroborating the notion that much of the push is being driven by retailers attempting to position their goods as close to consumers as possible. The graph below tracks the movement of the three warehouse metrics over the past year. Warehouse Capacity was growing consistently in the back half of 2019 through February 2020. But since the onset of the pandemic-related lockdowns in March available capacity has either contracted or broke even, with the high-water mark being 50.5 in August. While firms like Amazon are bringing new facilities online at a record pace[3], respondents expressed doubts that available supply will be able to meet demand anytime soon. When asked, they project a Warehouse Capacity value of 49.5 12 months from now, indicating that any new capacity will be gobbled up as soon as it comes online.
 Similar to the trends we observe in our warehousing metrics, the transportation sector has tightened considerably. Transportation Capacity is down (-7.7) to 23.8, the lowest metric we have recorded for this or any metric in the four-year history of the LMI. It is even more pronounced for downstream firms, with consumer-facing respondents registering an astonishing 16.3. Clearly, consumer-facing firms are struggling to find the capacity needed to meet the increasing consumer appetite for home-delivery. This is reflected in the premium firms are paying, with Transportation Prices up (+4.1) to a rate of 87.9, which is the highest rate of growth since October 2018. Transportation Utilization rates are also up (+4.5) to 74.1. It is interesting that logistics capacity is already this pressed at the end of Q3. Traditionally Q4 is when we see peak logistics demand, so the fact that it’s already close to maximum utilization calls into question whether or not missed or late deliveries will become an issue through peak retail times in November and December.
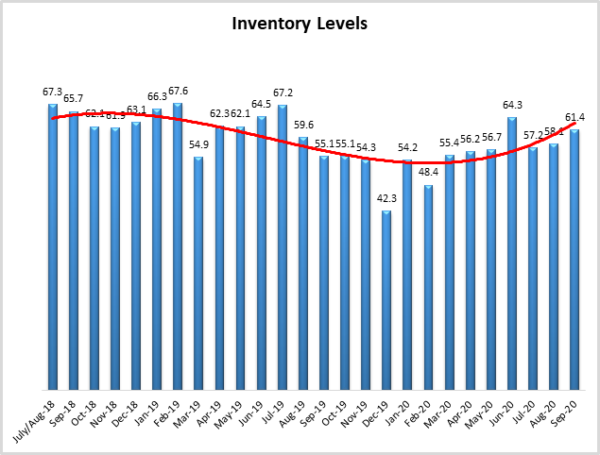
Finally, we continue to track steady growth in our inventory metrics. Inventory Levels are up (+3.3) to 58.1, reflecting reports of bustling port activity as firms move to replenish the inventory from international suppliers that they were unable to procure early in the summer[4]. The costs to hold inventory continue to increase as well (+1.1) to 65.8, a significant level of growth.
The index scores for each of the eight components of the Logistics Managers’ Index, as well as the overall index score, are presented in the table below. Six of the eight metrics show signs of growth, with both capacity metrics actively contracting. The overall LMI® index score is at its highest level in 23 months.
| LOGISTICS AT A GLANCE | |||||
| Index | August 2020 Index | August 2020 Index | Month-Over-Month Change | Projected Direction | Rate of Change |
| LMI® | 70.47 | 66.00 | +4.5 | Growing | Increasing |
| Inventory Levels | 61.39 | 58.08 | +3.3 | Growing | Increasing |
| Inventory Costs | 65.84 | 64.74 | +1.1 | Growing | Increasing |
| Warehousing Capacity | 43.14 | 50.51 | -7.4 | Contracting | From Increasing |
| Warehousing Utilization | 71.08 | 65.15 | +5.9 | Growing | Increasing |
| Warehousing Prices | 70.50 | 68.62 | +1.9 | Growing | Increasing |
| Transportation Capacity | 23.79 | 31.48 | -7.7 | Contracting | Increasing |
| Transportation Utilization | 74.06 | 69.63 | +4.4 | Growing | Constant |
| Transportation Prices | 87.85 | 83.80 | +4.1 | Growing | Increasing |
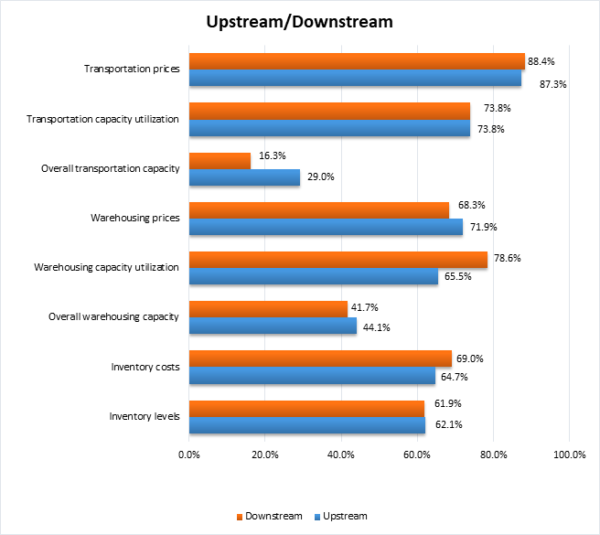
This month, upstream firms (represented by the orange bars) reported tighter transportation capacity, but similar levels of price and utilization. Upstream firms are also utilizing more of the warehouse space available to them as they work to accommodate the steady flow of inventory. Holding inventory is also more expensive for downstream firms, likely reflecting their position closer to consumers.
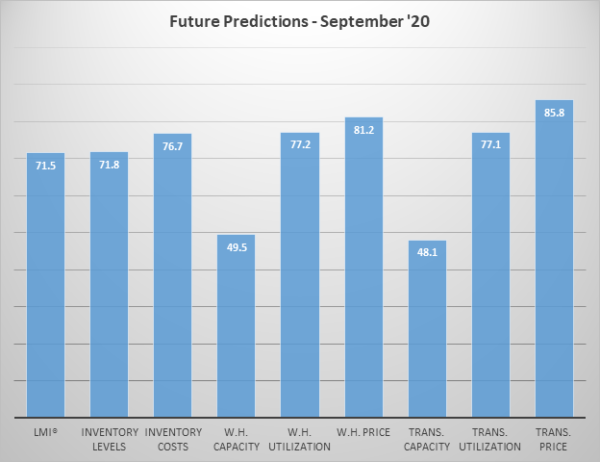
Respondents were asked to predict movement in the overall LMI and individual metrics 12 months from now. Their predictions for future ratings are presented below. Respondents predict continued tightness throughout the logistics industry, with costs increasing across the board and Transportation Capacity and Warehousing Capacity unable to keep up with anticipated high levels of demand throughout the next 12 months.
Historic Logistics Managers’ Index Scores
This period’s along with prior readings from the last two years of the LMI is presented table below. The values have been updated to reflect the method for calculating the overall LMI:
| Month | LMI | Average for previous readings – 61.7
High – 75.7 Low – 51.3 Std. Dev – 6.26
|
| Sep ‘20 | 70.5 | |
| Aug ‘20 | 66.0 | |
| July ‘20 | 63.0 | |
| June ‘20 | 61.7 | |
| May ‘20 | 54.5 | |
| Apr ‘20 | 51.3 | |
| Mar ‘20 | 58.9 | |
| Feb ‘20 | 52.6 | |
| Jan ‘20 | 54.1 | |
| Dec ‘19 | 54.0 | |
| Nov ‘19 | 54.4 | |
| Oct ‘19 | 54.4 | |
| Sep ‘19 | 56.6 | |
| August ‘19 | 56.6 | |
| July ‘19 | 57.2 | |
| June ‘19 | 56.0 | |
| May’19 | 56.7 | |
| April ‘19 | 57.9 | |
| March ‘19 | 60.41 | |
| February ‘19 | 61.95 | |
| January ‘19 | 63.33 | |
| December ‘18 | 63.54 | |
| November ‘18 | 66.98 | |
| October ‘18 | 71.20 | |
| September ‘18 | 70.80 | |
| July/August ‘18 | 70.80 | |
| May/June ‘18 | 72.55 |
LMI®
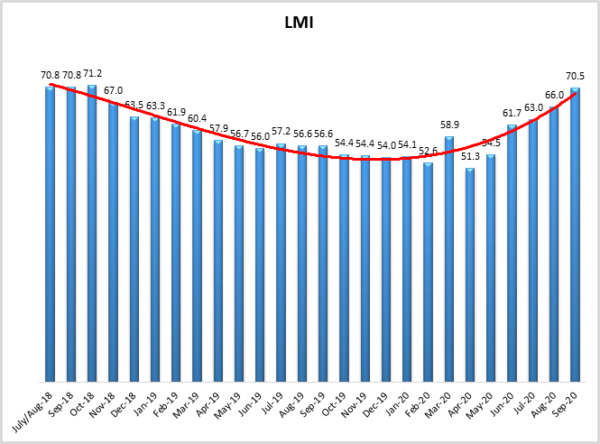
The overall LMI index is up (+4.5) to 70.5 from August’s reading of 66.0. This is the fifth consecutive increase after hitting April’s all-time low of 51.3. This is the first reading in the 70’s and the highest overall score since October 2018, indicating that, at least through September, the logistics industry is to be coming back strong. The long-term U-shape of this metric demonstrates how, after an extended period of slow expansion, growth rates roared back in the summer of 2020. As noted above, this growth seems to be primarily driven by a large increase in transportation demand, possibly reflecting the increased consumer appetite to e-commerce and on-demand services. At this point it seems likely that these high rates of growth will continue event if the overall economy is slow in Q4. The dramatic reliance on logistics services due to the pandemic may insulate the industry from moderate economic downturns in the near future.
Respondents predict that over the next year, the LMI will be at 71.5, up (+5.1) from August’s future prediction of 66.0. This suggests that respondents are anticipating increasing rates of growth in the logistics industry over the next 12 months.
Inventory Levels
The Inventory Levels value is 61.4 up (+3.3) from August’s reading of 58.1. This is considerably higher (+6.3) than the same time last year, Since last September, there has been fairly consistent low growth, with nine of twelve values within 2.3 points of 55.8. The current value represents an increase outside of this range. Against the backdrop of the pandemic, the current value being so much higher than last year at this point is a significant increase.
When asked to predict what conditions will be like 12 months from now, the average value is 71.8. This is quite a bit above the current inventory level growth of 61.4. But it is significantly lower than last month’s year ahead prediction of 58.9. Thus, expectations have shifted slightly indicating that respondents anticipate that inventory values will continue to increase significantly over the next year.
Inventory Costs
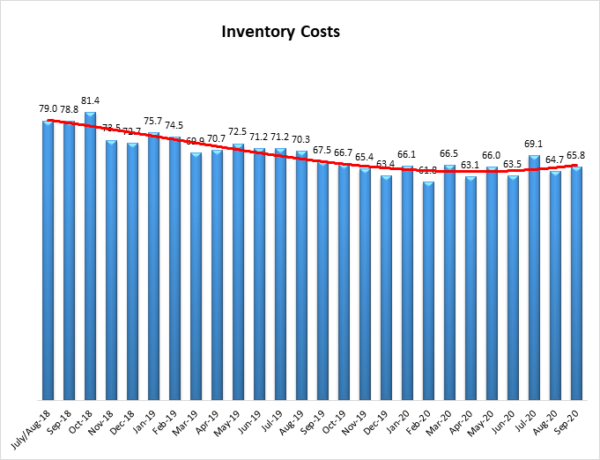
Given the continued increases in inventory levels, it is not surprising that inventory costs have continued to increase. The current value is 65.8, up slightly (+1.1) from August’s reading of 64.7. These continued high levels indicate strong continued growth in inventory costs, although the current value is below the long-term average of 70.0. The trend line showed a very stable rate of decline in the inventory cost index over the past two years but then stabilized for a period of six months. Downstream respondents show inventory costs increasing more quickly when two months ago, we saw upstream costs increasing more quickly. Given the significant increase in inventory levels seen above and consistent increases in warehousing costs, it seems quite likely that inventory costs will continue to rise.
Responses from participants seem consistent with this hypothesis. When asked about what they expect inventory costs to be like 12 months from now, the index value is 76.7 up significantly (+ 12.2) from August’s future prediction of 65.5. This value reflects the expected continued inventory cost growth. Respondents clearly expect inventory costs to continue to be high for the next 12 months.
 Warehousing Capacity
The Warehousing Capacity Index registered 43.1 percent in September 2020, which indicates that warehouse capacity is decreasing. This reading is rather sharply down from last month by 7.4 points. In addition, this reading is down over 11 percentage points from the reading one year ago (September 2019 registered in at 54.4). In previous months it was the team’s contention that the shock to the warehousing had been “priced in” to the rate at which these values were registering. This month, however, we view these numbers in light of recent reports that indicate that e-commerce retailers are bracing for a historical holiday season. Thus, in anticipation, we suspect that capacity is being taken up with safety stock to prepare for this increased demand.
Looking forward to the next 12 months, the predicted Warehousing Capacity index is 49.5, down slightly (-0.5) from August’s future prediction of 50.0. This is a far cry from May’s future prediction of 60.4. Respondents appear to be growing increasingly pessimistic that large quantities of additional Warehousing Capacity will come online over the next 12 months.
Warehousing Utilization
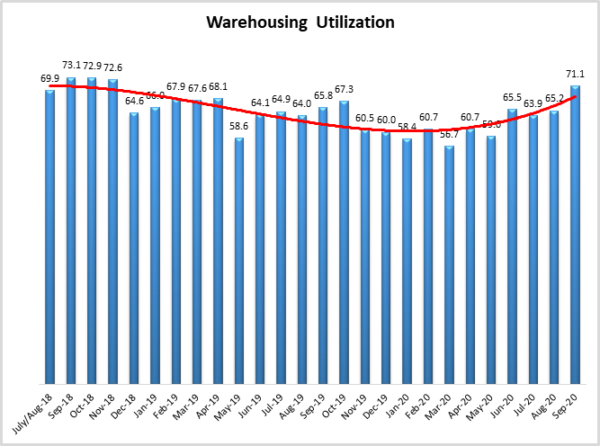
The Warehousing Utilization Index registered 71.1 percent in September 2020. This represents a modest 5.9 percentage point increase from last month and is up by 5.3 percentage points from the September 2019 reading of 65.8. This sharp increase in the rate at which utilization is increasing is congruent with the decrease in capacity noted previously. Previously in this report, the team noted that the reasoning for the growth in utilization was being driven by “1. The increased re-opening of the economy driving the need for fulfillment/storage of products; and 2. The increased reliance on and shift to e-commerce. In addition, as schools and universities re-open the corresponding supply chains that support them are likely relying on the logistics system to support this operation.” It appears that these were accurate, and now the driving force behind the increase is also being fueled by the expected size of the holiday shopping season.
Looking forward to the next 12 months, the predicted Warehousing Utilization index is 77.2, up significantly (+12.8) from August’s future prediction of 64.4. This seems to support the notion that respondents do not expect significant amounts of warehousing to come online in the next year, and therefore anticipate the need to utilize more of the currently available space.
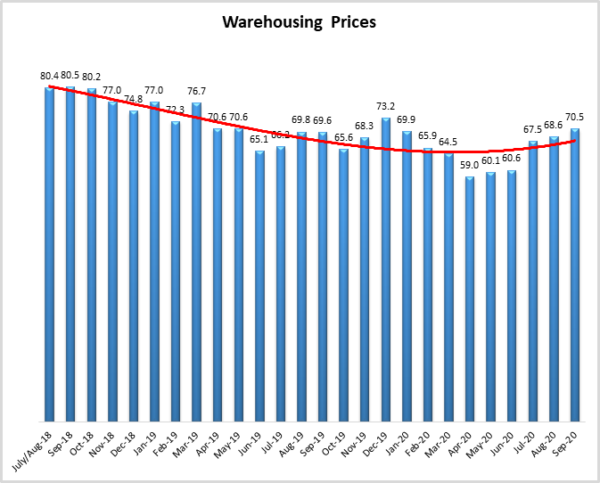
Warehousing Prices
Warehousing Prices Index registered 70.5 percent in September 2020. This reading represents a rather small increase of just under 2 percentage points from last month, which continues the trend of the sixth straight month of an increased growth rate in warehousing prices amid the COVID-19 disruption(s). This reading is approximately equal to the reading from one year ago (<1 percentage point off). This is in contrast to the warehousing capacity and utilization numbers presented above. Typically, in previous readings, there is somewhat of a lag in the relationship between pricing and capacity/utilization. The rather tepid rate of the increase reflected in pricing this month could be a harbinger of increases in pricing to come in the following months. Indeed, as the forecasts indicate that e-commerce systems will be pushed to the brink, the pricing of warehousing will likely adjust to reflect this.
Future predictions suggest that respondents are expecting prices to continue to grow at a rate of 81.2, up significantly (+13.0) from August’s future prediction of 68.2. Clearly, respondents are anticipating a significant increase in costs (and a continuation of current trends) over the next 12 months.
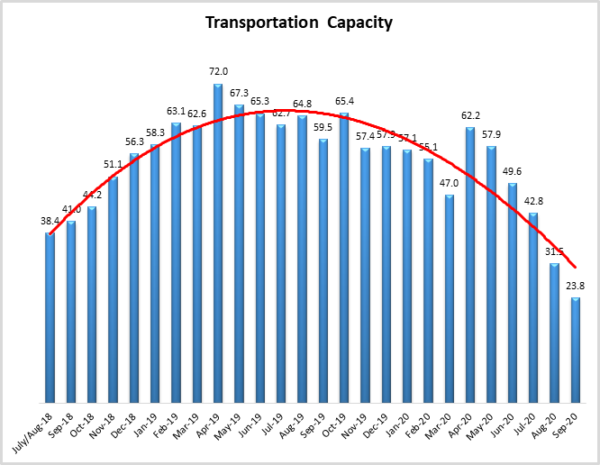
Transportation Capacity
The Transportation Capacity Index registered 23.8 percent in September 2020. This constitutes a sharp decrease of 7.7 percentage points from the August reading of 31.5. The Transportation Capacity Index continued to drop further under 50 and registered a new record low, indicating an acceleration in the contraction of capacity. As mentioned above, this is largely driven by downstream firms, who reported a Transportation Capacity reading of 16.30. Downstream firms are likely to have an increased need for transportation, particularly around last-mile delivery in Q3 and Q4, it will be interesting to see whether or not the capacity that is currently available will be sufficient.
Future predictions suggest that respondents are expecting the capacity to continue to contract at a rate of 48.1, up significantly (+16.4) from August’s future prediction of 31.7. This suggests that respondents expect Transportation Capacity to continue to contract throughout the next 12 months, though not at the rate which they predicted previously.
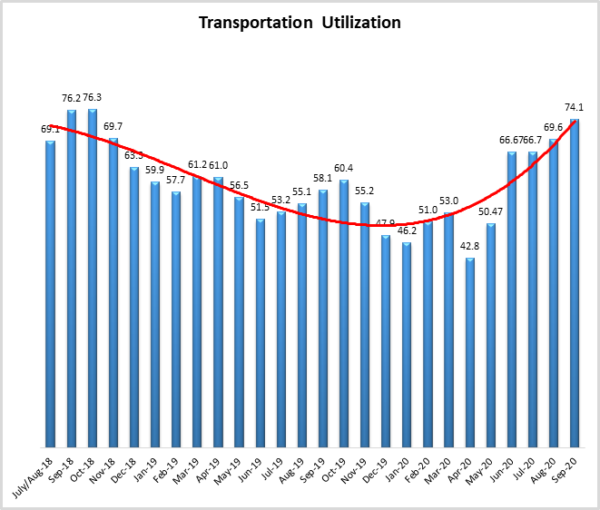
Transportation Utilization
The Transportation Utilization Index registered 74.1 percent in September 2020. This number denotes a 4.5 points increase from the August reading of 69.6. The Transportation Utilization Index continued to increase, reaching a score in the 70’s for the first time since October 2018.
Future predictions suggest this trend will continue, with this month’s future reading coming in at 77.1, up (+8.1) from August’s future prediction of 69.0. This is consistent with the prediction that Transportation Utilization will continue to be strained over the next 12 months, and that as a result firms will have to utilize more of what is available.
Transportation Prices
The Transportation Prices Index registered 87.9 percent in September 2020. This constitutes an increase (+4.1) from August’s reading of 83.8. This indicates that transportation prices are continuing their increasing trend and is the highest reading since October 2018. Transportation Prices have grown rapidly, up 50.2 points since reaching their nadir of 37.7 in April. Observing the last two years of Transportation Prices shows a “u-shaped” trend, with September’s rate of growth representing a return to the heady days of mid-to-late 2018.
Future predictions suggest that respondents expect more of the same, forecasting future Transportation Prices to grow at a rate of 85.8, up slightly (+1.7) from August’s future prediction of 84.1. Respondents clearly expect the continued tightness in the freight market to result in increasing costs – with no relief in sight.

About This Report
The data presented herein are obtained from a survey of logistics supply executives based on information they have collected within their respective organizations. LMI® makes no representation, other than that stated within this release, regarding the individual company data collection procedures. The data should be compared to all other economic data sources when used in decision-making.
Data and Method of Presentation
Data for the Logistics Manager’s Index is collected in a monthly survey of leading logistics professionals. The respondents are CSCMP members working at the director-level or above. Upper-level managers are preferable as they are more likely to have macro-level information on trends in Inventory, Warehousing and Transportation trends within their firm. Data is also collected from subscribers to both DC Velocity and Supply Chain Quarterly as well. Respondents hail from firms working on all six continents, with the majority of them working at firms with annual revenues over a billion dollars. The industries represented in this respondent pool include, but are not limited to: Apparel, Automotive, Consumer Goods, Electronics, Food & Drug, Home Furnishings, Logistics, Shipping & Transportation, and Warehousing.
Respondents are asked to identify the monthly change across each of the eight metrics collected in this survey (Inventory Levels, Inventory Costs, Warehousing Capacity, Warehousing Utilization, Warehousing Prices, Transportation Capacity, Transportation Utilization, and Transportation Prices). In addition, they also forecast future trends for each metric ranging over the next 12 months. The raw data is then analyzed using a diffusion index. Diffusion Indexes measure how widely something is diffused, or spread across a group. The Bureau of Labor Statistics has been using a diffusion index for the Current Employment Statics program since 1974, and the Institute for Supply Management (ISM) has been using a diffusion index to compute the Purchasing Managers Index since 1948. The ISM Index of New Orders is considered a Leading Economic Indicator.
We compute the Diffusion Index as follows:
PD = Percentage of respondents saying the category is Declining,
PU = Percentage of respondents saying the category is Unchanged,
PI = Percentage of respondents saying the category is Increasing,
Diffusion Index = 0.5 * PD + 0.5 * PU + 1.0 * PI
For example, if 25% say the category is declining, 38% say it is unchanged, and 37% say it is increasing, we would calculate an index value of 0*0.25 + 0.5*0.38 + 1.0*0.37 = 0 + 0.19 + 0.37 = 0.56, and the index is increasing overall. For an index value above 0.5 indicates the category is increasing, a value below 0.5 indicates it is decreasing, and a value of 0.5 means the category is unchanged. When a full year’s worth of data has been collected, adjustments will be made for seasonal factors as well.


