- Growth is INCREASING AT AN INCREASING RATE for: Inventory Levels, Warehousing Utilization, Warehousing Prices, Transportation Utilization, and Transportation Prices
- Growth is INCREASING AT A DECREASING RATE for: Inventory Costs
- Warehousing Capacity and Transportation Capacity are CONTRACTING
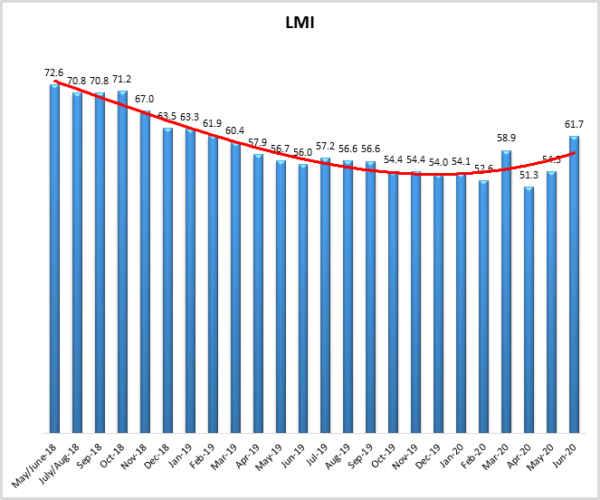
The logistics industry continues to recover from April’s all-time low overall score of 51.3, following up May’s reading of 54.5 with an overall LMI score of 61.7, the highest reading since February 2019. The reopening of the economy has clearly played a role here, with downstream firms reporting a significant surge in retail on-hand. This, combined with the already high levels of stock have driven up inventory metrics, and put an unprecedented in the history of the LMI premium on warehousing space. The readings in inventory and warehousing are continuations of trends observed last month, the major difference in June was the comeback of transportation, with both Transportation Utilization and Transportation Prices up by double digits. With the new round of COVID-19 outbreaks and the potential to re-shutter portions of the economy, whether or not this upswing will continue is anyone’s guess. For the moment however, the LMI is reporting growth levels not seen since late 2018.
Researchers at Arizona State University, Colorado State University, Rochester Institute of Technology, Rutgers University, and the University of Nevada, Reno, and in conjunction with the Council of Supply Chain Management Professionals (CSCMP) issued this report today.
Results Overview
The LMI score is a combination eight unique components that make up the logistics industry, including: inventory levels and costs, warehousing capacity, utilization, and prices, and transportation capacity, utilization, and prices. The LMI is calculated using a diffusion index, in which any reading above 50 percent indicates that logistics is expanding; a reading below 50 percent is indicative of a shrinking logistics industry. The latest results of the LMI summarize the responses of supply chain professionals collected in May 2019. As mentioned above, this month’s LMI represents a tension between the growth in our Warehousing and Inventory metrics, and continued (albeit slowing) contraction in Transportation. This is interesting as this is only the second time that Transportation Prices and Warehouse Capacity have both been in a state of contraction (the first time was in April). Previously, these measures have been negatively correlated When demand for logistics services is high Warehouse Capacity decreases, and Transportation Prices increase. That they are moving in the same direction suggests that while demand is down for Transportation, inventories remain quite high and the demand for Warehousing is up.
The LMI is up (+7.2) from May’s reading of 54.5. This is the first reading in the 60’s in 15 months. The economy continues to show signs of recovery after the doldrums reached this Spring. However, this does not mean the economy is roaring the way it was in early 2019 or late 2018. Current levels of growth is measured from the all-time low scores established this Spring. LMI metrics are always relative to the month prior. So, a growth rate of 61 in June 2020 does not indicate the same level of expansion that the 61 in early 2019 represented as they represent growth increases from much different baseline levels. Still, growth of any kind is better than the near steady-state we measured earlier this Spring.
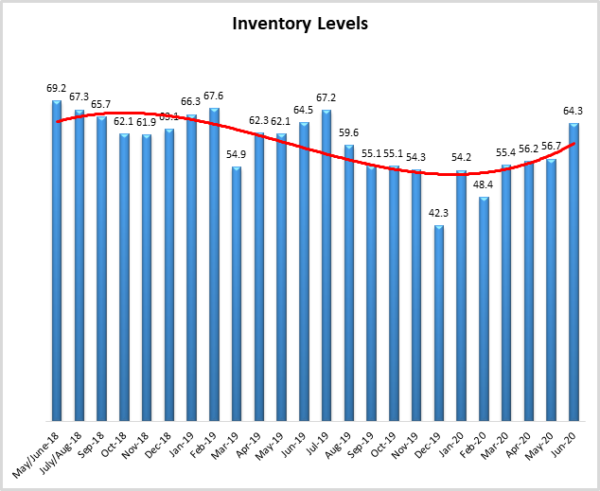
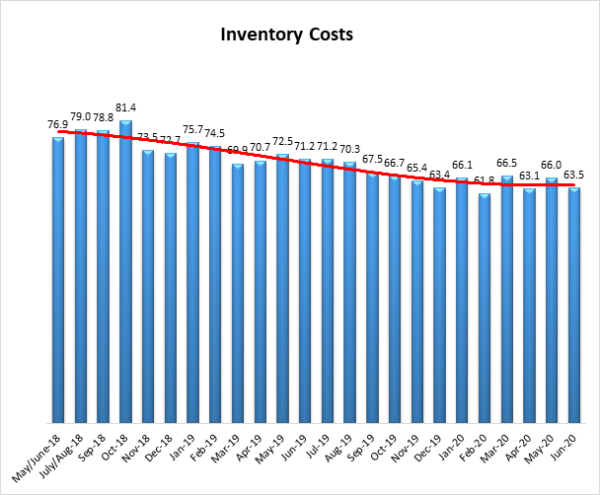
The increase in the overall LMI has been partially driven by increasing (+7.6) Inventory Levels. Upstream firms continue to have large stores of stock on-hand; however downstream retailers have greatly increased their stores of goods, up 15 points from 50.0 to 65.4. This growth is almost certainly driven by the partial-to-full reopening of the economy. The associated Inventory Costs, while down slightly from May (-2.6), are still growing at the rate of 63.5.
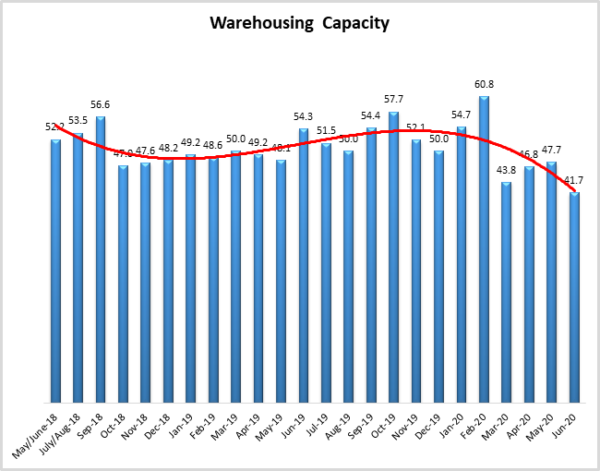
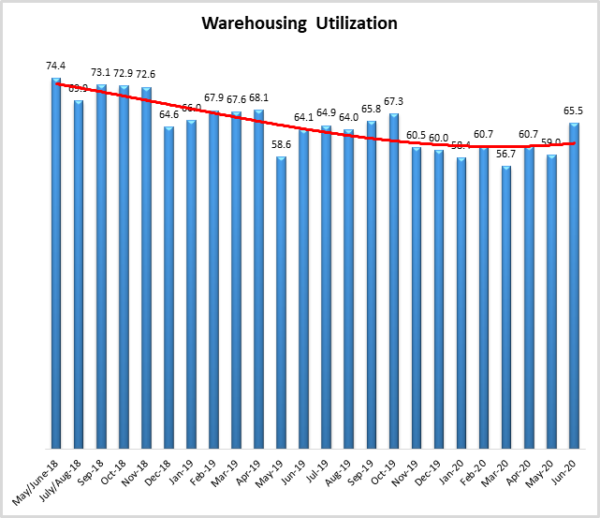
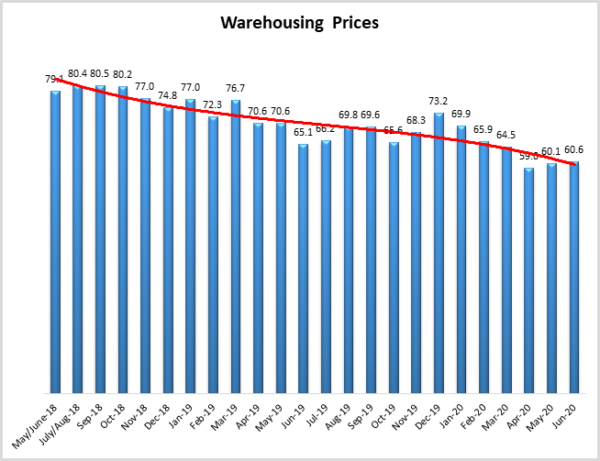
The growth in inventory has placed a heavy inventory burden on the warehousing sector. Warehousing Capacity is down (-6.0) to 41.7, the lowest rate we have recorded in the 46-month history of the LMI. The tightness in available capacity has driven up Utilization (+6.5) to 65.5, and Warehouse Prices (+0.5) to 60.6. Interestingly, respondents believe that there will be little relief from these pressures going forward, predicting Warehousing Prices to grow at relatively high level of 75.0 over the next 12 months. Part of the reason behind this high anticipated demand for warehousing is likely due to some firms deciding to hold this Spring’s unsold inventory over, instead of taking pennies on the dollar to liquidate it[1]. The current boom in the warehousing industry is corroborated by reports that 60,500 jobs have been added in this sector over the last month[2].
Finally, the Transportation industry has totally turned around from May, with both Transportation Utilization (+16.2 to 66.7) and Transportation Prices (+15.4 to 64.5) both up significantly. Transportation Capacity is down subsequently (-8.3) to 49.6, showing mild contraction. While the reopening of the economy has clearly played a role in transportation’s resurgence, it is not the only factor. In an interview conducted by one of the LMI researchers with APL Logistics CEO Bill Villalon suggested that some firms are supplementing the lack of available warehouse space by slow-rolling inventory on intermodal options, “storing” products on rail cars to take pressure off of warehouses. Perhaps spurred on by this lack of capacity over 15,000 Class 8 trucks were ordered in June[3]. It is important to note that while we are observing price growth and a spike in tender refection rates[4] LMI metrics are relative, and there are 95,000 fewer trucking jobs in the U.S. than at this time last year2. The logistics industry is coming back from the brink, but it is not yet fully recovered.
The index scores for each of the eight components of the Logistics Managers’ Index, as well as the overall index score, are presented in the table above. six of the eight metrics show signs of growth. The overall LMI® index score is up to levels not observed since early last year.
| LOGISTICS AT A GLANCE | |||||
| Index | June 2020 Index | May 2020 Index | Month-Over-Month Change | Projected Direction | Rate of Change |
| LMI® | 61.71 | 54.46 | +7.2 | Growing | Increasing |
| Inventory Levels | 64.29 | 56.67 | +7.6 | Growing | Increasing |
| Inventory Costs | 63.46 | 66.02 | -2.6 | Growing | Decreasing |
| Warehousing Capacity | 41.67 | 47.69 | -6.0 | Contracting | Decreasing |
| Warehousing Utilization | 65.46 | 58.96 | +6.5 | Growing | Increasing |
| Warehousing Prices | 60.55 | 60.10 | +0.5 | Growing | Increasing |
| Transportation Capacity | 49.56 | 57.87 | -8.3 | Contracting | From Growing |
| Transportation Utilization | 66.67 | 50.47 | +16.2 | Growing | Increasing |
| Transportation Prices | 64.47 | 49.07 | +15.4 | Growing | From Contracting |
The recovery in the logistics industry has been largely spurred by the reopening of downstream firms such as retailers. In a reverse of the last few months, downstream firms are reporting higher levels of inventory, higher Inventory Costs, and less Warehouse Capacity than their upstream counterparts. Whereas the majority of excess inventory was being stored upstream during the lockdown, with the partial reopening firms have rushed inventory forward towards consumers. The re-engagement of downstream firms seems to have been the major driver of logistics activity growth in June.
Respondents were asked to predict movement in the overall LMI and individual metrics 12 months from now. Their predictions for future ratings are presented below and, as has become a pattern, seem to be somewhat more optimistic than our current readings. Respondents seem to be predicting significantly increased demand in 2021, with four of the eight indices measuring in the 70’s, including both pricing metrics. The logistics industry getting to these levels in the next year is largely a function of whether or not the apparent secondary wave of COVID-19 infections centered in the southwest and Florida leads to further economic lockdowns.
Historic Logistics Managers’ Index Scores
This period’s along with prior readings from the last two years of the LMI are presented table below. The values have been updated to reflect the method for calculating the overall LMI:
| Month | LMI | Average for previous readings – 61.3
High – 75.7 Low – 51.3 Std. Dev – 6.3
|
| June ‘20 | 61.7 | |
| May ‘20 | 54.5 | |
| Apr ‘20 | 51.3 | |
| Mar ‘20 | 58.9 | |
| Feb ‘20 | 52.6 | |
| Jan ‘20 | 54.1 | |
| Dec ‘19 | 54.0 | |
| Nov ‘19 | 54.4 | |
| Oct ‘19 | 54.4 | |
| Sep ‘19 | 56.6 | |
| August ‘19 | 56.6 | |
| July ‘19 | 57.2 | |
| June ‘19 | 56.0 | |
| May’19 | 56.7 | |
| April ‘19 | 57.9 | |
| March ‘19 | 60.41 | |
| February ‘19 | 61.95 | |
| January ‘19 | 63.33 | |
| December ‘18 | 63.54 | |
| November ‘18 | 66.98 | |
| October ‘18 | 71.20 | |
| September ‘18 | 70.80 | |
| July/August ‘18 | 70.80 | |
| May/June ‘18 | 72.55 |
LMI®
The overall LMI index is up (+7.2) to 61.7 from May’s reading of 54.5. This is the second consecutive increase after hitting April’s all-time low of 51.3. This is the highest overall score since February 2019, indicating that, at least for June, the logistics industry seemed to be coming back strong. As noted in May, it remains to be seen whether this trend towards recovery will continue, or whether there will be a subsequent dip linked to the ongoing secondary outbreak. For the moment however, it appears that the logistics industry has begun to regain its footing.
Respondents predict that over the next year, the LMI will be at 64.6, up (+7.1) from May’s future prediction of 57.5. This suggests that respondents are anticipating growth in the supply chain industry, and potentially in the economy as a whole, over the next 12 months.
Inventory Levels
The Inventory Level value is 64.29, which is 7.62 points above the value last month of 56.67, and 15.89 points above the value four months ago, which indicates that levels are increasing more quickly now. Currently, both upstream and downstream respondents gave similar values, 65.4 for downstream, and 64.1 for upstream. This is up significantly for both upstream and downstream respondents. This is a change from past readings when upstream firms had much higher inventory levels than their downstream counterparts. This likely reflects that as states reopened across the US at different paces, and to different extents, downstream firms built=up their inventory in order to have product in position for when things re-opened.
When asked to predict what will conditions will be like 12 months from now, the average value is 60.3, indicating inventory levels are expected to grow slightly. This value is a decrease from last month’s year-ahead prediction of 56.7. This indicates that respondents expect inventory values to continue increase modestly over the next year.
Inventory Costs
The current value for Inventory Costs is 63.46, 2.56 points below the previous reading of 66.02. Given the significant increase in inventory levels, it is not surprising that inventory costs have continued to increase, although it is interesting that the index value for costs is smaller than last month’s reported value. As with Inventory Levels, the upstream and downstream respondents also show similar responses to inventory costs. 63.9 for upstream, 62.1 for downstream. Taking this graph and the previous graph of inventory values together, inventory levels continue to grow, but at a slowed pace relative to previous months. This likely reflects the re-opening of many retailers, and the renewed ability to sell goods on a larger scale. Whether our inventory metrics increase again with the potential shutdown of outbreak hotspots remains to be seen.
Looking forward at the next 12 months, the predicted Inventory Costs index is 71.4, a significant increase from last month’s value of 64.1. This value reflects expected continued inventory cost growth, and potential issues with selling off excess goods. Respondents clearly expect inventory costs to continue to be high for the next 12 months.
Warehousing Capacity
The Warehousing Capacity Index registered 41.67 percent in June 2020, its lowest reading in the history of the LMI. This represents a nearly 6-point decrease from the May 2020 reading of 47.69, and a substantial 13-point drop from the reading one year ago. This measurement for Warehousing Capacity is in conjunction with other components of the LMI (i.e. transportation capacity). The reading indicates that the capacity for warehousing continues to contract, now for four months in a row. With the build-up of inventories associated with the COVID lockdown and subsequent re-opening, retailers/wholesalers/manufacturers to need significantly more warehousing to simultaneously store excess inventory while also maintaining current service levels; hence the rapid drop in this measure.
Looking forward at the next 12 months, the predicted Warehousing Capacity index is 57.4, down (-3.0) from May’s future prediction of 60.4. Respondents appear to be optimistic that they will either be able to whittle down inventory storage requirements, or that more warehouses will come online over the next 12 months. However given the current readings, it is unclear whether or not this can happen.
Warehousing Utilization
The Warehousing Utilization Index registered 65.46 percent in June 2020. This represents a 7.5 percentage points increase from last month, and is up 1.36 points from the June 2019 reading of 64.1. The increase in utilization is likely attributable to the lack of available warehouse space and represents an increase in the efficiency with which firms are utilizing what space they have access to.
Looking forward at the next 12 months, the predicted Warehousing Utilization index is 60.0, down slightly (-0.7) from April’s future prediction of 60.7.
Warehousing Prices
Warehousing Prices Index registered 60.50 percent in June 2020. This reading represents a negligible .45 percentage point increase from last month, though it still represents significant increases in the grand scheme of things. This reading is also down by approximately 5 points from one year ago. Interestingly, while capacity is decreasing and utilization is rising at rather expeditious rates, pricing has yet to follow as sharply. The reading next month will confirm whether there is a lagged effect in pricing. Taken together with the increasing utilization and contracting capacity, this reading could suggest that the market is reflecting the price sensitivity in demand and adjusting as necessary, though perhaps not at the rate expected.
Future predictions suggest that respondents are expecting lagged prices to catch up with the lack of capacity, as the predicted Warehousing Prices index is 75.0, up 12.9 points from May’s future prediction of 62.1. This would represent a significant increase in Warehouse Prices, and is somewhat inconsistent with the prediction of increased future capacity.
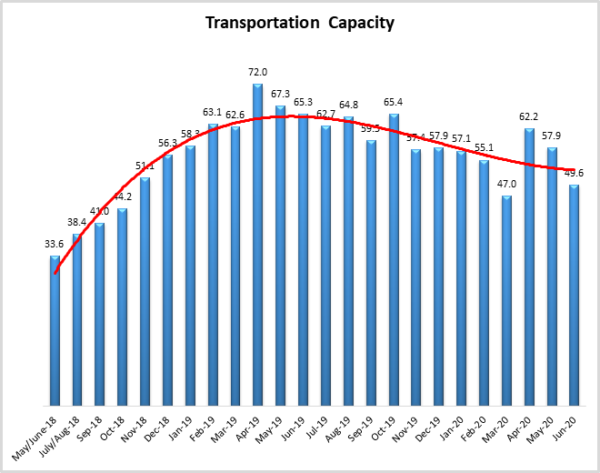
Transportation Capacity
The Transportation Capacity Index registered 49.6 percent in June 2020. This constitutes a decrease of 8.3 percentage points from the May reading of 57.9. The metric is technically contracting. However, it is very close to 50.0, and close to a steady state relative to May. This is a break from April and May when capacity was increasing. This may be indicative of both the shuttering of some fleets and the reopening of portions of the economy.
It should be noted the data indicates a score of 49.5 percent for the next year, projecting expectations of slightly decreasing transportation capacity in the next 12 months.
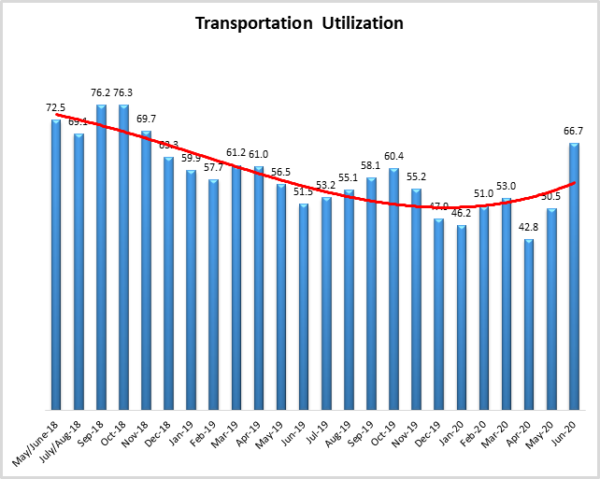
Transportation Utilization
The Transportation Utilization Index registered 66.7 percent in June 2020. This constitutes an increase of 16.2 percentage points from the May reading of 50.5. This is the highest reading for this metric November 2018. This increase in the utilization of available capacity seems to corroborate the reports that some forms of intermodal transportation (such as rail) are being used to supplement storage during the ongoing warehousing shortage.
It should be noted that the future Transportation Utilization Index indicates a 71.9 percent level for the next 12 months, indicating expectations that firms will need to continue utilizing a high volume of available capacity going forward.
Transportation Prices
The Transportation Prices Index registered 64.5 percent in June 2020. This constitutes an increase of 15.4 percent from the May transportation prices reading of 49.1. After the nadir realized in April, and the slow recovery reported in May, June’s reading seems to indicate that transportation has come back with force. The Transportation Price metric has always been the most sensitive to movements in the economy. This spike clearly reflects the reopening of both retail and manufacturing facilities, along with the move to use transportation to supplement warehousing space. It will be interesting to observe what impact, if any, the potential shutdown of hotspots such as Arizona or Florida have on Transportation Prices in July.
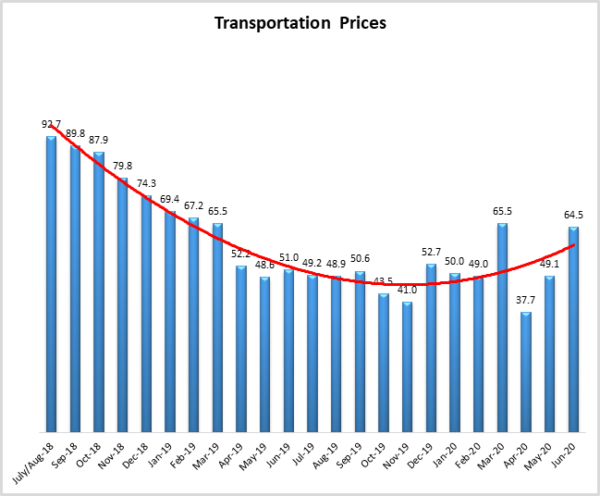
The future index for transportation prices remains elevated, with a future Transportation Prices Index value of 75.4 indicating optimism for return to form in both Transportation and the overall economy over the next 12 months.