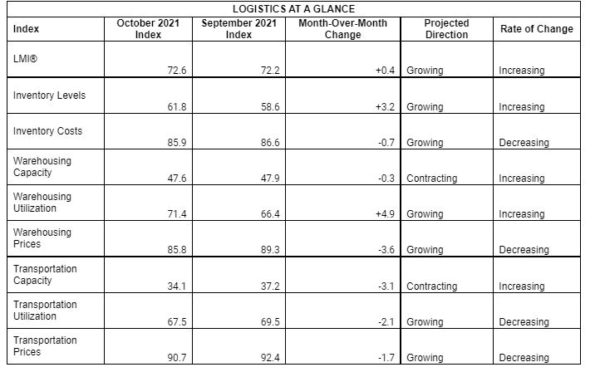
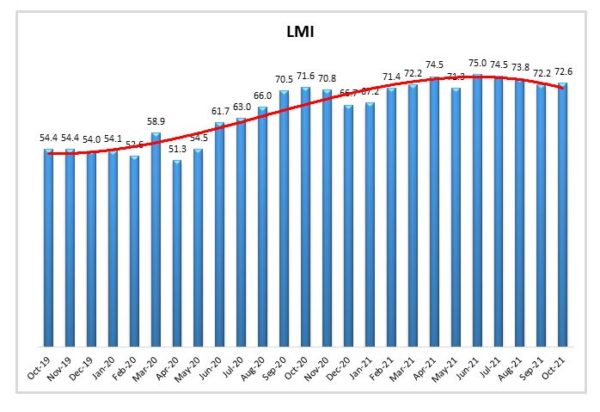
- LMI® at 72.6
- Growth is INCREASING AT A DECREASING RATE for Inventory Costs, Warehousing Prices, Transportation Utilization, and Transportation Prices
- Growth is INCREASING AT AN INCREASING RATE for Inventory Levels, and Warehousing Utilization, Warehousing Capacity, and Transportation Capacity are CONTRACTING
October’s reading of 72.6 continues the extended run of logistics expansion we have been tracking throughout the year. Overall growth has now been over 70.0 – a level we would classify as significant expansion – nine months in a row and 12 of the last 14 (only dipping down in December and January read in the mid-’60s which was partially a function of inventories being sold off during Q4). This month’s number is driven by many factors, including continual growth in cost metrics, and further contraction in available capacity. We also observe that after four consecutive periods of decreasing rate of growth, Inventory Levels are up again (+3.2) to 61.8. Analysis of upstream and downstream firms reveals that Inventory Levels are growing 10.3 points faster for upstream respondents – reflecting the difficulty retailers are having building up inventories to sufficiently meet consumer demand.
Researchers at Arizona State University, Colorado State University, Rochester Institute of Technology, Rutgers University, and the University of Nevada, Reno, and in conjunction with the Council of Supply Chain Management Professionals (CSCMP) issued this report today.
Results Overview
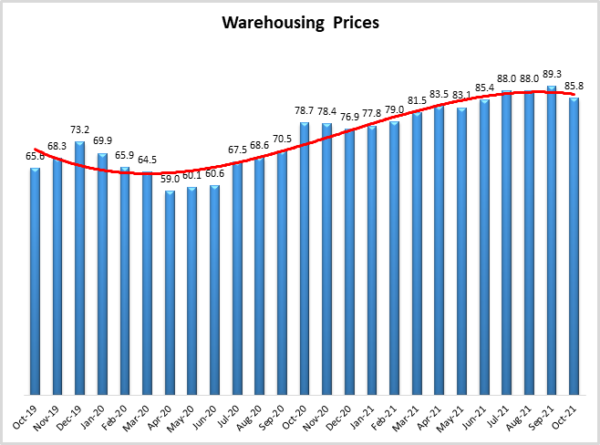
The LMI score is a combination of eight unique components that make up the logistics industry, including inventory levels and costs, warehousing capacity, utilization, and prices, and transportation capacity, utilization, and prices. The LMI is calculated using a diffusion index, in which any reading above 50 percent indicates that logistics is expanding; a reading below 50 percent is indicative of a shrinking logistics industry. The latest results of the LMI summarize the responses of supply chain professionals collected in October 2021. As we have seen for most of the last year, this month’s LMI displays continued expansion in the logistics industry. Overall, the LMI is up slightly (-+0.4) in from September’s reading of 72.2. The growth in this month’s index is fueled by metrics from across the index, primarily those involving capacity, cost, and upstream inventories. The transportation crunch remains particularly pronounced, with Transportation Prices reading in above 90.0 for the seventh time in the last eight months. For the fourth consecutive month, we observe an all-time high reading for Warehousing Prices, coming in this month at 89.3. Interestingly, this still comes in behind Transportation Prices, which read in at an astronomical rate of 92.7 – it’s the sixth out of seven readings to breach 90.0.
While the growth of the overall economy slowed to 2% in the third quarter – a reduction largely due to the prevalence of the Delta variant and supply chain issues that stymied potential consumer spending[1], consumer demand for durable goods has remained hot. The volume passing through the Port of Los Angeles was up 49.8% year-over-year through the first three quarters of the years[2]. 74 vessels were docked in the San Pedro Bay waiting to be unloaded in the last week of October – anchored an average of 13.4 days before they can be unloaded. Even firms like Apple who have remained well-positioned throughout the pandemic and have reported record profits over the last 12 months are warning of potential shortages[3]. Supply chain issues are a major driver behind consumer prices rising at their fastest pace in 30 years during September[4]. These shortages have been framed as a byproduct of “broken supply chains”. However, as Jason Miller of Michigan State points out, we are actually observing supply chains processing more goods than at any other point in history[5]. The San Pedro Bay ports are on track to process 20 million TEUs of cargo in 2021 – up 25% from 2020[6]. This sudden increase has had drastic impacts on systems designed for lean efficiency. The glut of inventory is creating a negative feedback loop in which firms stick inventory wherever they can, soaking up potential processing capacity. This is exemplified in the chassis problem that was highlighted in September’s report. Many chassis are acting as ad-hoc storage for inventory that has nowhere else to go, severely limiting the ability of dockworkers to move containers off the dock and towards customers[7]. The ports are attempting to clear this blockage in a few different ways. Long Beach waived the restrictions on stacking shipping containers, allowing them to be stacked 5 boxes high instead of 2. This should help get containers off of the ships more quickly. The Port of Long Beach is also working with the Union Pacific Railroad to ship cargo directly to the Utah Inland Port Authority. This cuts out steps for products moving to the US intermountain region and frees up capacity in Southern California[8]. to better utilize the 24-7 approach the ports are taking UP and BNSF railroads are offering incentives ($60 and $50 per container respectively) for containers that are in-gated on Saturday or Sunday through the ports in southern California[9].
More controversially, ports are also attempting to incentivize shippers to move containers more quickly by charging $100 per container per day, increasing in $100 increments in each successive day. Assessments will begin on November 15th and apply to containers that have been idle for more than nine days (a group that makes up 47% of the backlog at the Port of LA)[10]. The additive nature means that with this penalty cost will increase exponentially, so a container that sits for 30 days will garner penalties of $46,500. While this policy will provide clear economic incentives to firms to move containers off of chassis and other staging areas, it remains to be seen whether or not they will have the space to do so. Many shippers, including Walmart, Amazon, and Office Depot believe that the high fees will only increase costs, and not necessarily increase throughput due to the lack of capacity to move containers elsewhere and a debate rages as to whether carriers or shippers will ultimately pay the costs[11]. Making matters worse is the high number of empty containers that were unloaded in East Coast ports and are being shipped back to Asia via Southern California ports[12]. A Harbor Trucking Association survey of 46 trucking firms in October found that 6,592 chassis were currently holding empty containers waiting to be shipped back out7. It will be interesting to see if the creative solutions being enacted will help to ease the congestion as we move through the end of 2021.
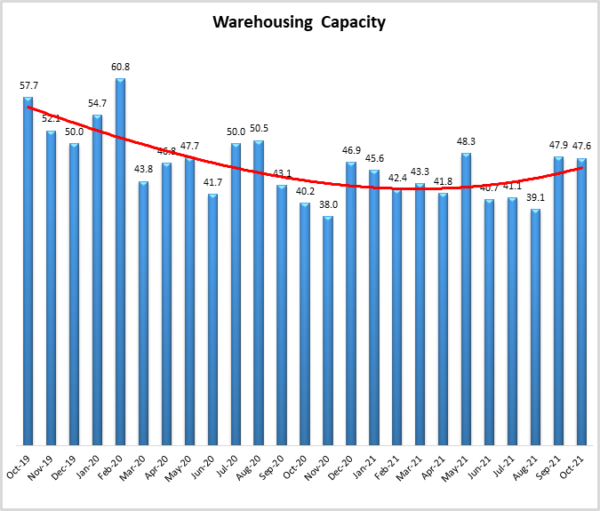
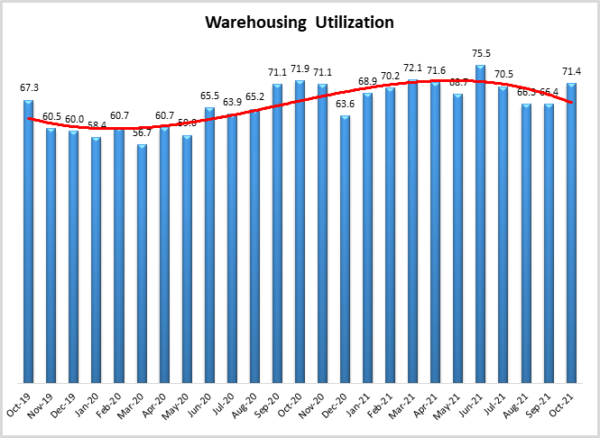
The primary reason for the growth in container dwell times is that there is nowhere else for inventory to go. In late October Prologis reported that logistics space is at an all-time low. The report states that U.S. net absorption (the net change in occupied space over a given period of time) reached 115 million square feet in Q3 and 280 million through the first nine months of 2021 – double the absorption of last year leaving a vacancy at 3.9% nationally[13]. This is reflected in the continuing contraction in Warehousing Space, which was down slightly (-0.3) to 47.6, marking the 13th consecutive month of contraction (and 17th of the last 19). As one might expect this has led to a continued increase in Warehousing Utilization up (+4.9) to 71.4, a level we classify as significant expansion. To cope with the lack of space large retailers such as Amazon and Costco are using the high levels of cash they currently have on hand to buy their own warehouse space. The top 25 retailers in the U.S. purchased 38 million new square feet over the last year, continuing the trend of firms being willing to pay for redundant logistics capacity as opposed to the outsourcing they may have preferred in the past[14]. Warehouse Prices had reached a new record level of growth in each of the previous four readings. The rate of growth is down (-3.6), but still quite elevated at 85.8 which is well above the all-time average of 72.7 for this metric.
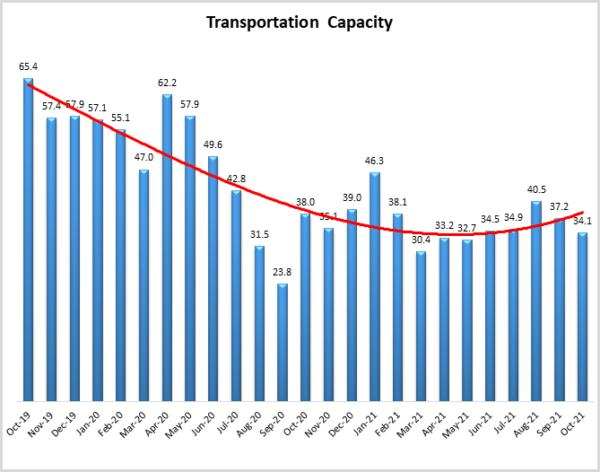
As mentioned in September’s report, the volume of goods coming through the Southern California ports has led to an imbalance between trucks moving from west to east and those moving east to west. Outbound demand moving out of California is 43% higher than inbound demand – meaning – leading to much higher margins for trucks moving west, leading to an increase in deadhead hauls and a lack of transportation capacity in other regions[15]. In addition to the issues with placing trucks, volume continues to be elevated beyond what fleets are prepared to handle. Pre-pandemic, experts predicted the U.S. would ship 100 million parcel packages per day by 2026, instead, we reached that milestone in 2021[16] (Frantz, 2021). These two factors are responsible for the continued slide in available Transportation Capacity which is down (-3.1) to 34.1 and has been contracting for 17 consecutive months – with scores below 40.0 in 13 of the past 15 readings. Due to semiconductor issues, it has been difficult to build new trucks and even the price of 3-year old trucks is up 50% over the last 12 months[17]. To increase Transportation Utilization – which is still growing (-2.1) at a rate of 67.5 – UPS is piloting a program to incentivize freight consolidation for loads going to the same consignee[18]. Amazon is taking a different tact, offering “Black Friday Level” deals throughout the Fall to attempt to smooth out demand[19]. Transportation Prices grew slightly slower (-1.7) in October but are still ascending rapidly at a rate of 90.7.
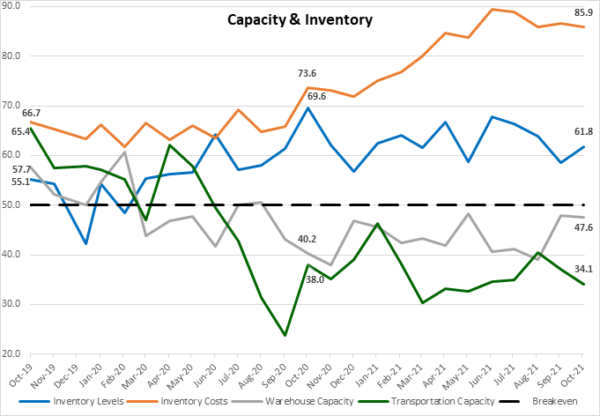
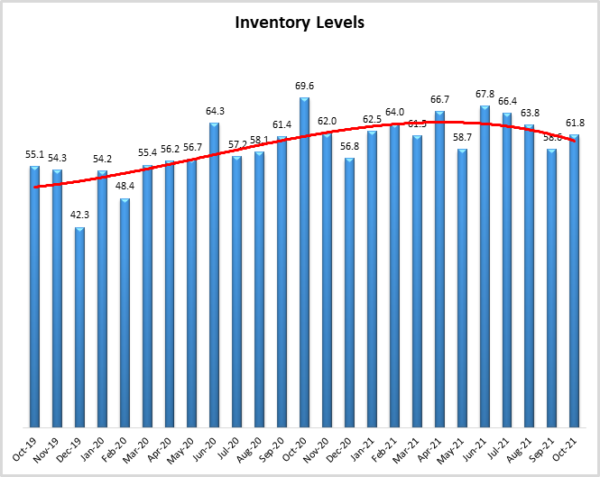
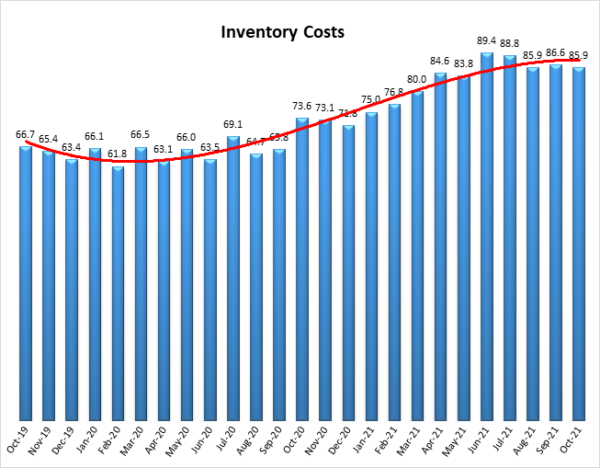
The lack of logistics capacity continues to impact our inventory metrics. Inventory continues to rush into the U.S. Inventory Levels are up (+3.2) to 61.8 but are still outstripped significantly by Inventory Costs (-0.7) which read in at 85.9. The relationship between capacity and inventory is explained in the figure below. The last two years of Transportation Capacity (green line), Warehousing Capacity (gray line), Inventory Levels (blue line), and Inventory Costs (orange line) are displayed. The two capacity metrics went from moderate growth two years ago, to more than a year of constant contraction. Transportation Capacity has been contracting since July 2021, and Warehousing Capacity has contracted or broke even in all but one month (August 2020) since the start of the COVID lockdowns. The lack of capacity makes it difficult to store or move inventory through supply chains. Because there is little warehousing space available, many firms are using intermodal containers or chassis as temporary storage because they have nowhere else to hold their inventory[20]. This in turn limits available transportation capacity to move goods. Inventory Costs are up 12.3 points from this time last year and up 19.2 points from October 2019. At the same time, the growth rate for Inventory Levels are down 7.8 points from this time last year. Traditionally Inventory Costs and Inventory Levels have been tracked together. Clearly however we hit a point of divergence in October of last year, as the lack of capacity combined with record levels of consumer spending on durable goods has made it both increasingly expensive and operationally difficult to have a sufficient supply of goods to meet demand. We will know that the economy and supply chains are beginning to normalize when the readings for Inventory Costs and Inventory Levels once again converge. It seems unlikely that stabilization will be any time soon. Prologis estimates that overall inventories will be up from 10-15% over the next few years[21], meaning both Warehousing and Transportation Capacity will need to increase in turn for prices to stabilize.
The index scores for each of the eight components of the Logistics Managers’ Index, as well as the overall index score, are presented in the table below. Six of the eight metrics show signs of growth, while both capacity metrics continue their runs of contraction. The logistics industry remains tight, and based on future predictions and industry experts, seems likely to stay that way through the rest of the year, the next, and possibly into 2023.
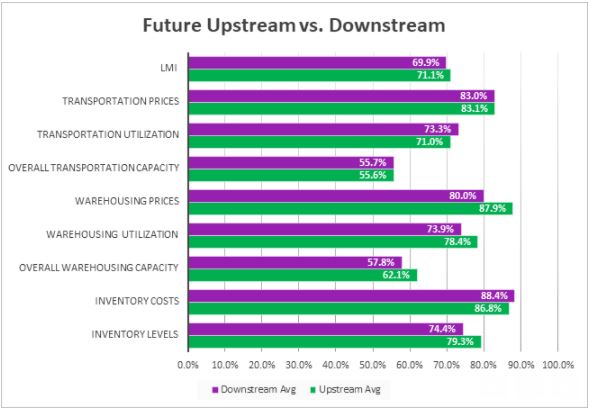
This month, both upstream (blue bars) and downstream (orange bars) firms reported considerable rates of continued growth in the utilization of logistics services. In a continuation from September, we observed significant differences between available Transportation Capacity, and Transportation Prices. We also see a marginal difference in Inventory Levels.
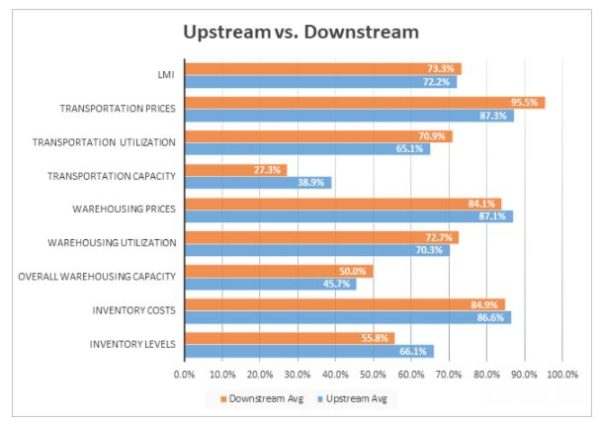
T-tests demonstrate that transportation remains particularly tough for downstream firms (i.e., retailers and other consumer-facing respondents). All respondents reported a contraction in Transportation Capacity in September, but downstream firms read in 11.6 points lower (similar to last month’s difference of 11.5), the key difference being that capacity is contracting more quickly for both groups (27.3 from 30.5 for downstream). Relatedly, downstream firms reported a rate of growth in Transportation Prices of 95.5 – 8.2 points higher than their upstream counterparts. As predicted last month, the disparity between transportation metrics has increased as we move into Q4 and increased consumer spending. Finally, while Inventory Levels are growing Interestingly, we observe that Inventory Levels are growing marginally faster for Upstream firms – reflecting the difficulties many Downstream firms are having keeping products on shelves.
Respondents were asked to predict movement in the overall LMI and individual metrics 12 months from now. Their predictions for future ratings are presented below. For the next year, respondents predict a growth rate of 70.6 for the overall LMI down three points from August’s future prediction of 73.6, the decreased estimate is largely due to increasing optimism regarding the availability of both Warehousing and Transportation Capacity in the next 12 months. The optimistic assessments of future capacity have led to slight downward modulations for price predictions, as they now register in the low- to mid-’80s, down from September when they were all predicted to be in the upper-80’s. While this does suggest some modicum of relief, and growth rate in the ’80s is reflective of significant price increases. Another year of strained supply chains is consistent with other future predictions of supply and capacity finally catching up to demand in late 2022 or 2023 [22].
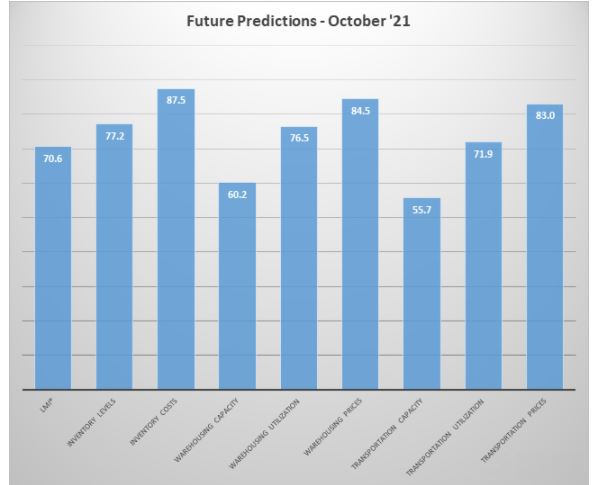
The exact nature of the future predictions varies by supply chain position. But this month we do not see a significant statistical divergence between the two groups for future predictions. T-tests show no significant difference between the expectations of Upstream or Downstream respondents. Both groups are expecting marginal growth in Warehousing and Transportation Capacity. They are also both anticipating continued price growth, ranging from the low- to mid-’80s over the next 12 months. Both groups predict the overall LMI will continue to expand at a rate of right around 70.0 – a significant rate of growth but down slightly from what we have observed over the Summer and Fall of 2021.
LMI®
The overall LMI index is 72.6, up slightly (+0.4) from September’s reading of 72.2. The first month of the first quarter continues the torrid pace of growth in the logistics industry we have seen throughout 2021. This increase is largely driven by decreases in available capacity – particularly downstream Transportation Capacity, along with increased Inventory Levels – particularly upstream. Taken together, we see that a glut of inventory is stuck upstream, as downstream retailers scramble to move goods to consumers. Given all of the hand-wringing being done in the media over “broken supply chains,” it may be counterintuitive that the logistics industry is actually expanding. However, supply chains have processed more goods than ever in 2021. This is not a failure of supply chains as it is a heroic effort in the face of an uphill battle against disruptions and a dramatic increase in consumer demand[23]. The current issues are predicted to subside in 2023 when capacity might eventually catch up to consumer demand.
Respondents are not anticipating any significant relief over the next 12 months, predicting a growth rate of 70.6, down from September’s future prediction (and October’s current prediction) by 2.0 points. Despite the predicted slowdown in growth, it would still be significantly higher than the all-time average of 64.4. This growth rate over the next 12 months would lead to a continued increase in prices as the supply of capacity continues to struggle to keep up with demand.
Inventory Levels
The Inventory Level value is 61.8, up (+3.2) from September’s reading of 58.6. Despite the short-term increase, the current value is 7.9 points lower than the same time last year. Additionally, this month upstream respondents returned a higher value (66.1), than downstream (55.8) indicating that inventories are growing 10.3 points quicker upstream. Inventory Levels being down overall – primarily due to slow growth with downstream retailers – reflects the difficulties with getting products to customers that are being experienced across multiple industries.
When asked to predict what conditions will be like 12 months from now, the average value is 77.3. This is much higher than the current inventory index value of 61.8. Respondents expect inventory values to continue increasing significantly over the next year. Upstream (79.3) are expecting greater increases in inventory than downstream (74.4) respondents.
Inventory Costs
The current Inventory Cost reading of 85.9 is down slightly (-.7) from September’s reading of 86.6. However, it is and 12.3 points above the value last October and is also 19.2 points above the value two years ago. Inventory cost values are much higher than this time in the past two years. This month, upstream respondents (86.6) experienced slightly greater cost growth than downstream (84.9). The greater cost growth for upstream is consistent with the greater increase in inventory levels experienced by upstream respondents, discussed above. Given the significant increase in inventory levels seen above and the near-record warehousing prices, it seems quite likely that inventory costs will continue to rise.
Responses from participants are consistent with this prediction. When asked about what they expect inventory costs to be like 12 months from now, the index value is 87.5, up (+05) from September’s future prediction of 87.0. Interestingly, downstream respondents predicted a slightly fast expansion of costs (88.4) than their upstream counterparts (86.8).
Warehousing Capacity
Warehousing capacity for the month of October clocked in at 47.6, which represents a minimal 0.3-point departure from last month’s value of 47.9. Notably, the value is up 7.4 points from the reading one year ago. This indicates that the market is trying to increase systemwide capacity to meet the unrelenting demand for storage. As of late, global supply chains have been put under enormous pressure globally, with raw material shortages and capacity constraints hampering the flow of goods.
Looking forward to the next 12 months, the predicted Warehousing Capacity index is predicted to increase at a rate of 60.2, up 6.3 from September’s future prediction and 11.9 points higher than August when a contraction was being predicted. 60.2 represents one of the most optimistic predictions in the last year. While this may not be enough to significantly decrease prices, any new capacity will be a welcome change.
Warehousing Utilization
The Warehousing Utilization Index registered at 71.4, which is an uptick (+5.0) from September’s value of 66.4 and is virtually unchanged from the value one year ago. The values for August and September indicated a flat utilization rate, though still in expansionary territory, yet the value for October shows increased growth. Fortunately, the increased capacity from this and previous months (though still seemingly insufficient and in a contraction) should help to meet this increasing demand. The likely cause of this continued rise in the rate of utilization is twofold: (1) the global supply chain challenges of late have caused many retailers to enter into a stockpiling phase to keep up with the demand for goods; and (2) the holiday season is less than two months away is likely going to put additional pressure on warehousing to maintain sufficient stock levels to meet demand.
Looking forward to the next 12 months, the predicted Warehousing Utilization index is 76.5, up (+2.6) from September’s future prediction of 73.9. Respondents continue to expect to utilize increasingly greater amounts of available warehouse space throughout the year as supply struggles to keep up with demand.
Warehousing Prices
Warehousing Prices Index registered at 85.8 in October of 2021, reflecting a 3.5 point drop from the previous month’s value, but still up from the value of 78.7 one year ago. This slight dip is likely being driven by increases in the capacity coming online, thereby easing (however marginally) the price pressures in this space. As/if capacity continues to come online, one should expect that the price pressures should continue in a downward trajectory. However, not once in the past two years has this index entered a contraction space, thus the likelihood that prices make a significant drop is highly unlikely. In addition, these pricing dynamics are also driven by overall demand in all parts of the global supply chain. Thus, unless and until aggregate demand for goods decreases and monumental increases to capacity are seen, these prices are likely to continue their upward trajectory.
Future predictions suggest that respondents are expecting prices to continue to grow at a rate of 84.5, down somewhat (-3.4) September’s future prediction of 87.9. Even with some potential Warehousing Capacity coming online over the next 12 months, respondents expect to be paying higher prices through the rest of the year and well into 2022.
Transportation Capacity
The Transportation Capacity Index registered 34.1 percent in October 2021. This constitutes a decrease of 3.1 percentage points from the September reading of 37.2. The Transportation Capacity Index remains historically low, indicating continued downward pressure on transportation capacity. Further, our data indicate that the downward pressure on transportation capacity remains extremely strong for downstream firms in the supply chain (downstream Transportation Capacity Index is down to only 27.3). Meanwhile, the upstream Transportation Capacity Index is also down to 38.9.
The future Transportation Capacity Index increased slightly from the previous reading, indicating 55.7 for the next year. The future index remains above the critical threshold of 50, indicating expectations of expanding transportation capacity for the next 12 months.
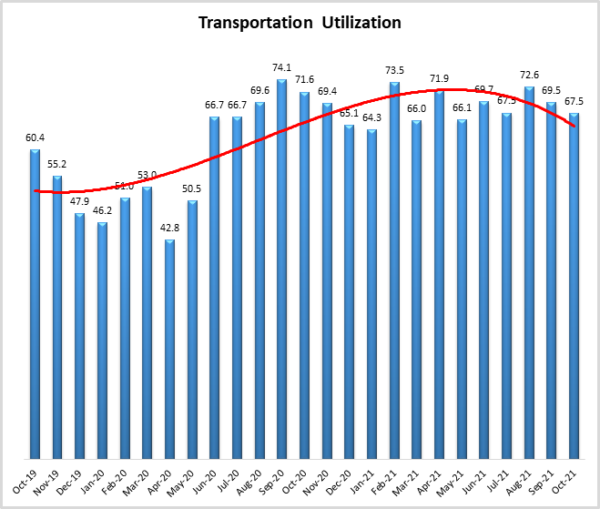
Transportation Utilization
The Transportation Utilization Index registered 67.5 percent in October 2021. This number denotes a decrease of 2 points from the September reading of 69.5. Despite this drop, the Transportation Utilization Index is still at elevated levels, indicating continued expansion in transportation utilization. The downstream Transportation Utilization index is even higher, at 70.9, while the upstream index is 65.1.
It should be noted that the future Transportation Utilization Index is up .6 points indicating a 71.9 percent level for the next 12 months. As such, the future transportation utilization index remains substantially above 50, indicating strong expectations of continued strong growth in transportation utilization.
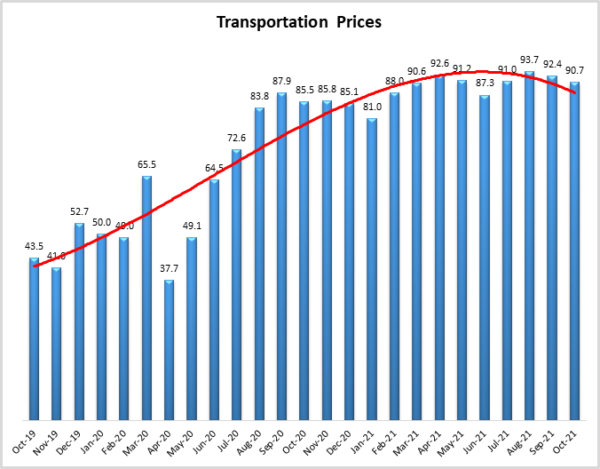
Transportation Prices
The Transportation Prices Index registered 90.7 percent in October 2021. This corresponds to a small decrease of 1.7 percent from the September transportation prices reading of 92.4. While the Transportation Prices index continued to retreat from the recent record high, it remains extremely elevated, indicating that the upward pressure on transportation prices remains very strong. The price pressure is significantly higher for downstream firms where the index is registering a 95.5.
The future index for transportation prices indicates a value of 83.0, which is 3.9 points lower than the previous month’s expectations of 86.9. Despite this small drop, the expectations of continued transportation price increases for the next 12 months remain strong, with the future index well above the critical level of 50 that indicates expansion.
About This Report
The data presented herein are obtained from a survey of logistics supply executives based on information they have collected within their respective organizations. LMI® makes no representation, other than that stated within this release, regarding the individual company data collection procedures. The data should be compared to all other economic data sources when used in decision-making.
Data and Method of Presentation
Data for the Logistics Manager’s Index is collected in a monthly survey of leading logistics professionals. The respondents are CSCMP members working at the director level or above. Upper-level managers are preferable as they are more likely to have macro-level information on trends in Inventory, Warehousing, and Transportation trends within their firm. Data is also collected from subscribers to both DC Velocity and Supply Chain Quarterly as well. Respondents hail from firms working on all six continents, with the majority of them working at firms with annual revenues of over a billion dollars. The industries represented in this respondent pool include, but are not limited to Apparel, Automotive, Consumer Goods, Electronics, Food & Drug, Home Furnishings, Logistics, Shipping & Transportation, and Warehousing.
Respondents are asked to identify the monthly change across each of the eight metrics collected in this survey (Inventory Levels, Inventory Costs, Warehousing Capacity, Warehousing Utilization, Warehousing Prices, Transportation Capacity, Transportation Utilization, and Transportation Prices). In addition, they also forecast future trends for each metric ranging over the next 12 months. The raw data is then analyzed using a diffusion index. Diffusion Indexes measure how widely something is diffused, or spread across a group. The Bureau of Labor Statistics has been using a diffusion index for the Current Employment Statics program since 1974, and the Institute for Supply Management (ISM) has been using a diffusion index to compute the Purchasing Managers Index since 1948. The ISM Index of New Orders is considered a Leading Economic Indicator.
We compute the Diffusion Index as follows:
PD = Percentage of respondents saying the category is Declining,
PU = Percentage of respondents saying the category is Unchanged,
PI = Percentage of respondents saying the category is Increasing,
Diffusion Index = 0.0 * PD + 0.5 * PU + 1.0 * PI
For example, if 25 say the category is declining, 38 say it is unchanged, and 37 say it is increasing, we would calculate an index value of 0*0.25 + 0.5*0.38 + 1.0*0.37 = 0 + 0.19 + 0.37 = 0.56, and the index is increasing overall. An index value above 0.5 indicates the category is increasing, a value below 0.5 indicates it is decreasing, and a value of 0.5 means the category is unchanged. When a full year’s worth of data has been collected, adjustments will be made for seasonal factors as well.


