- LMI® at 53.6
- Growth is INCREASING AT AN INCREASING RATE for: NOTHING
- Growth is INCREASING AT A DECREASING RATE for: Inventory Costs, Inventory Levels, Warehousing Prices Warehousing Utilization, Transportation Capacity, and Transportation Utilization
- Warehousing Capacity and Transportation Prices are CONTRACTING
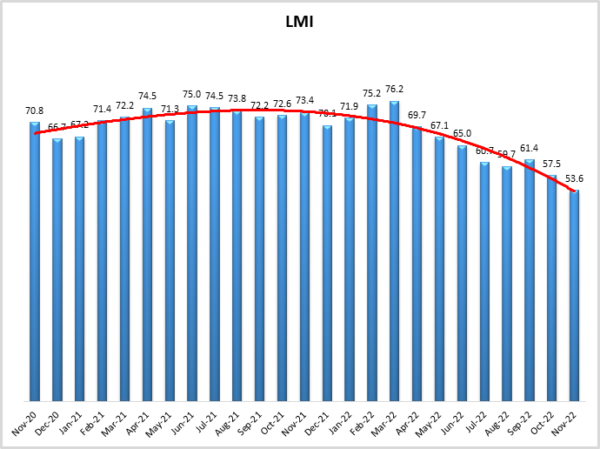
The Logistics Managers’ Index reads in at 53.6 in November, down (-3.9) from October’s reading of 57.5. This is the third month out of the last four that the overall index has read in below 60.0. It is also the second lowest overall reading in the history of the index, only surpassing the reading of 51.3 from April 2020 at the height of COVID-19 lockdowns, however, as the rating is over 50.0, we do still register a very moderate rate of growth.
In a change from what we have observed throughout 2022, inventory metrics are now settling into more sustainable rates of growth. Inventory Levels have decreased significantly, particularly for Upstream respondents. This is likely indicative of goods being positioned downstream for the holiday season, and more importantly for supply chains, being purchased by consumers. Despite the reductions in inventories, Warehousing Capacity remains tight, which in turn ensures continued expansion in Warehousing Prices. On the flip side, the transportation market continues to fall from the dizzying heights that had become the norm during 2021. This is epitomized by Transportation Prices, which read in at 37.4 – the most severe rate of contraction we have measured in the over six years of the Logistics Managers’ Index.
Researchers at Arizona State University, Colorado State University, Rochester Institute of Technology, Rutgers University, and the University of Nevada, Reno, and in conjunction with the Council of Supply Chain Management Professionals (CSCMP) issued this report today.
Results Overview
The LMI score is a combination of eight unique components that make up the logistics industry, including inventory levels and costs, warehousing capacity, utilization, and prices, and transportation capacity, utilization, and prices. The LMI is calculated using a diffusion index, in which any reading above 50.0 indicates September and October, transportation metrics continue to be a drag on the logistics industry, while warehousing remains strong, and inventories finally begin to moderate away from the record levels reached earlier this year.
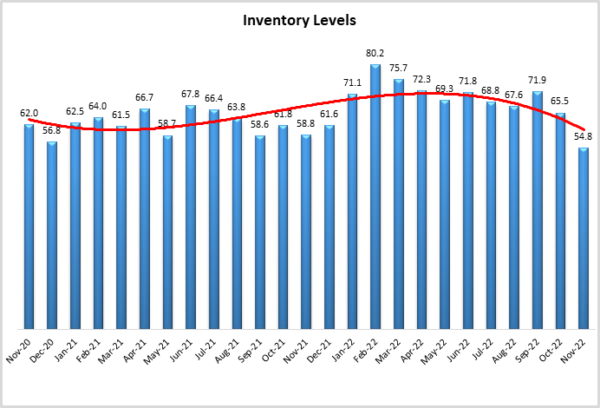
The slowdown in the overall index is largely due to the long-anticipated wind-down in inventories. Our Inventory Levels metric, which came in over 80.0 in February, reads in at 54.8 in November, down (-10.7) significantly from October’s reading of 65.5. This is indicative of two things: the movement of goods downstream towards retailers, and the sale of those goods as holiday spending picks up. Spending growth remained strong to kick off the holiday season. Online consumers spent just over $35 billion during the period from Thanksgiving to Cyber Monday. This shows a significant level of growth from 2021, although it should be noted that “buy now, pay later” transactions were up considerably – perhaps underlying the ongoing inflation issues[1], [2], [3]. The growth was not limited to eCommerce, as an estimated 196.7 million shoppers headed back to stores in-person during the holiday shopping weekend. The National Retail Federation expects overall holiday sales to be up 6-8% from 2021, although some of that increase will certainly be fueled by inflation[4]. In general, consumer spending – long one of the primary drivers of the US economy – remains strong, with spending up 0.8% in October, representing the strongest increase since June. This spending may have been somewhat tempered by inflation, which while still down read in at 6% year-over-year for personal consumption expenditures[5]. This capped a third quarter in which the U.S. economy grew at a revised rate of 2.9%, a marked shift from the contraction observed in the first half of 2022[6]. At the same time, the cost of holding inventories is still expanding significantly at a level of 73.4, but at a slower rate (-7.5) than what we saw in October. This is likely the result of the shifting of inventories downstream. Some retailers like Lowe’s and Walmart have built their stores of goods up in anticipation of strong holiday spending. Some of the inventory shed by primary retailers has also trickled down to secondary market retailers like TJX and Burlington[7].
There has been a lot of effort in 2022 to run inventories down after the overages we saw early this year. It will be very interesting to observe whether or not inventories build up again in a significant way in 2023. If one was only to observe international imports, one may lean towards “not”. The slowdown in inventory imports is somewhat unprecedented. In the first week of December, the price of a 40-foot container going from East Asia to the North American West Coast cost $1,426. This is approximately a third of the cost shippers were paying as recently as mid-September, and only a fraction of the $20,000 per container average observed in 2021[8]. The PMI’s manufacturing index fell into contraction territory (at 49.0) for the first time since May of 2020. This drop was fueled by the continued drops in new orders. The PMI measure of manufacturer inventory grew at a very slow rate of 50.9[9], if this number drops below 50 and new orders continue to lag, it will be a sign that manufacturers are indeed expecting some type of slowdown. This slowdown has led to the official declaration of the end of the backup that plagued the Ports of Los Angeles and Long Beach over the last few years. January’s queue of 109 ships – ships that carried the inventory that led to this year-long glut – down to zero in the last week of November[10]. It should of course be noted that some of the slowdown in traffic in the San Pedro Bay is due to ships being re-routed to other East and Gulf Coast ports. There are also several orders that cannot be filled due to China’s zero-Covid policy. Both Volkswagen and Honda were forced to halt production at their Chinese plants due to forced lockdowns. The slowdown is being felt in the electronics industry as well, with Apple warning investors that shipments of their most recent iPhone will be delayed by shutdowns at Foxconn assembly plants in China, potentially curbing sales of what would have otherwise been one of the holiday season’s more popular items. With reported outbreaks climbing to over 40,000 new cases per day in late November, it is likely that these issues will continue to plague supply chains through the near-term[11]. Supply chains continue to shift production away from China in response, resourcing to other Asian nations like Vietnam and Malaysia, or to nearby Central America or Mexico, the latter of which allows shippers to take advantage of duty-free imports through the USMCA[12]. Firms are taking advantage of some re-shored manufacturing as well. Apple recently announced it would be purchasing a third of the chips coming out of TSMC’s new foundry in Arizona when it comes online in 2024 (although the chips will still need to be sent to China or India for the final assembly)[13].
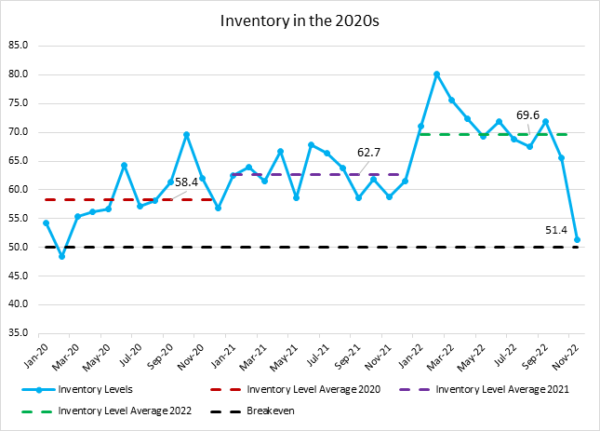
The shift in Inventory Levels from January 2020s to November 2022 (blue line) is presented in the figure below, with lines also denoting average inventories Inventory Levels averaged growth of 58.4 in 2020 (dashed red line), 62.7 in 2021 (dashed purple line), and 69.6 in 2022 (dashed green line). Clearly however the level of expansion has contracted sharply over the last few months, with the growth rate of 51.4 in November 2022 coming in well below the averages of every year in the 2020s and lower than every reading since the start of the pandemic in March of 2020. The bullwhip effect was probably inevitable given the sharp oscillations in supply and demand experienced over the last few years. The key now will be to observe whether supply chains have finally now right-sized their inventories, or if they have overcorrected back into a mild shortage. It is difficult to say now with so much of the holiday shopping season still in front of us. We should however have a much better idea of this in early 2023.
Despite the reduction in inventories warehousing remains tight. Warehousing Capacity read in at 46.6 (+2.1), marking the 28th consecutive month of contraction for this metric. As would be expected, Warehousing Prices continue to climb quickly as well, reading in at 74.4 (-1.1) and indicating a robust rate of growth. Warehousing Utilization continues to grow at a slightly reduced (-4.0) rate of 56.8. With these tight warehousing markets, firms continue to strive towards increased efficiency through automation – potentially culminating the in “dark warehouse”, which is a hypothetical facility where the lights do not need to be turned on because there are no human workers[14]. One of the barriers to the human-less fulfillment center has been the nuance associated with picking a multitude of different products and quickly being able to identify if any issues exist with the items being picked. Amazon’s “Sparrow”, which utilizes suction cups for picking and advanced AI and cameras to identify issues may end up being a significant advance towards fully automated fulfillment centers[15]. That being said, there are still many warehousing jobs that will need a human touch, as many high-end brands are now requiring employees to become expert gift wrappers with fancy handwriting to add a high-end feel to online packages[16].
Transportation continues to come down from the record heights we saw in 2021. Transportation Capacity is still growing rapidly at a rate of 71.4 which is down slightly (-1.7) from October’s all-time record of 73.1. This slack capacity is reflected in the most recent jobs report. The U.S. added 263,000 jobs in November, continuing the run of strong job growth and keeping the unemployment rate at 3.7%[17]. Despite this growth, transportation and warehousing jobs were down by 15,100 in November[18] – although wages continued to increase for the jobs in these sectors that remain. The LTL markets remain soft across the board, FedEx announced recently that it will be furloughing some drivers in December due to low rates of demand[19]. Some of the new capacity coming online will be electric. Tesla delivered several all-electric semi-trucks to PepsiCo at an event in Reno, NV (home or former home to four of this report’s five authors) on December 1st. These models are capable of running up to 500 miles per charge, addressing a primary concern about the viability of electric cargo trucks[20]. These electrified vehicles may be arriving just in time as California is planning to mandate fleets operating in the state switch to clean fuels starting in 2024, with the goal to have at least 30,000 in use by 2035. As the largest state by population and home to three of the ten busiest ports in the U.S. this will have an outsized impact on fleets. It will also require significant infrastructure upgrades, and at current prices add approximately $30,000 to the cost of a new rig[21]. In response, Prologis is installing dozens of electric charging stations at new properties in California and New York to facilitate the transition. The easier transition for electric vehicles will be as an option for last-mile delivery which requires shorter, more regular routes in dense areas that are more likely to have some form of charging infrastructure[22].
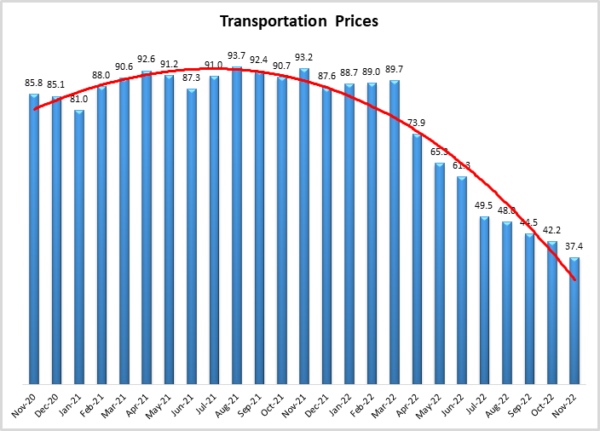
Transportation Prices continue to dip, down (-4.8) to 37.4. This is the sharpest rate of contraction we have read in the history of the LMI. The average retail price of a gallon of diesel fuel was down to $5.14 the last week of December, 20 cents lower than it read during the last week of October[23]. Large carriers are paying even lower rates, as wholesale diesel prices read in at $3.58 per gallon[24].
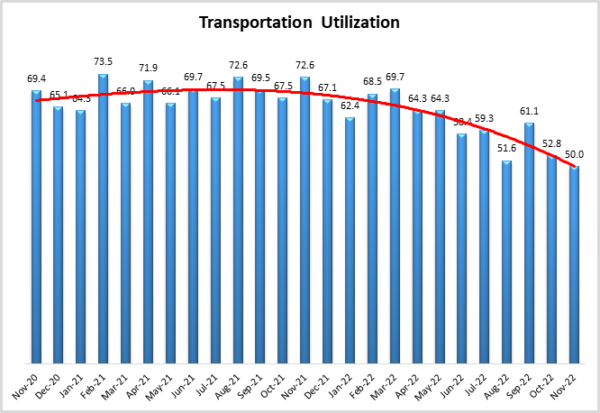
Transportation Utilization is down as well (-2.8) coming in at an even 50.0, meaning that utilization of available capacity is no longer growing. Transportation Utilization had expanded every month since May 2020. There was some notion that a rail strike would push more volume to over-the-road trucking, with some shippers even reserving truck space to move in-demand microchips just in case intermodal shipping was no longer an option[25]. The big transportation story during the last week of November was the legislation to prevent a nationwide strike by railroad workers that would have led to an estimated $2 billion per day in losses to the U.S. economy[26] and likely caused further supply-related inflation issues. The bill will force four holdout unions to implement the contract agreed to by eight other rail unions earlier this year[27]. There are not many bills that have received bipartisan support from this congress, but the fact that the Railway Labor Act passed both chambers so quickly and overwhelmingly highlights the importance of intermodal logistics connections to U.S. and global economies writ large. To end on one bit of welcome news for carriers, legislation was introduced in the US Senate on December 1st to provide $755 million in grants to add parking spots for large trucks. Even with the slowdown in freight more spots are desperately needed, with Todd Spencer of the Owner-Operator Independent Drivers Association estimating that there is only 1 available parking spot for every 11 trucks on the road[28].
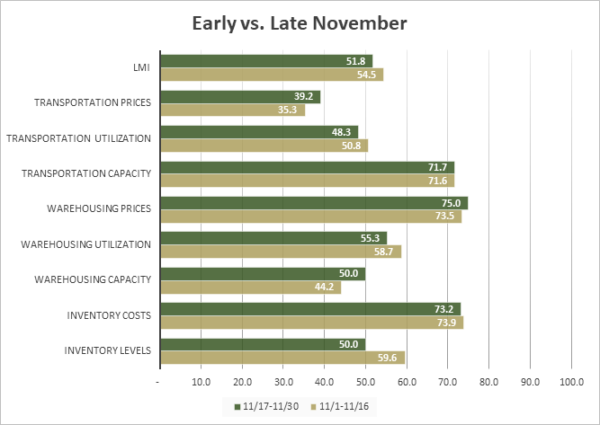
Responses were generally consistent between early and late November. The exception to this was the Inventory Levels, which were down significantly from 59.6 to an even 50.0 in the second half of the month (and actually contracted for Upstream retailers after November 17th). This suggests that many firms have successfully threaded the needle and worked through the bulk of the goods that have plagued them throughout the year. The only other notable move is that we saw Warehousing Capacity move from contraction in early November to breaking even at the end of the month. If Warehousing Capacity was to move into expansion in the next month, it would truly be a sign that the logistics industry has shifted and would likely trigger an eventual decline in Warehousing Prices (something which is projected in our future predictions).
| Inv. Lev. | Inv. Costs | WH Cap. | WH Util. | WH Price | Trans Cap | Trans Util. | Trans Price | LMI | |
| November 1-16 | 59.6 | 73.9 | 44.2 | 58.7 | 73.5 | 71.6 | 50.8 | 35.3 | 54.5 |
| November 17-30 | 50.0 | 73.2 | 50.0 | 55.3 | 75.0 | 71.7 | 48.3 | 39.2 | 51.8 |
| Delta | 9.6 | 0.7 | 5.8 | 3.4 | 1.5 | 0.0 | 2.5 | 3.9 | 2.7 |
| Significant? | Marginal | No | No | No | No | No | No | No | No |
The index scores for each of the eight components of the Logistics Managers’ Index, as well as the overall index score, are presented in the table below. Six of the eight metrics show signs of growth. Warehousing Capacity has now tightened for 27 consecutive months. Transportation Prices are down for the fifth consecutive month, contracting more quickly in November than they did in October. Conversely, the six metrics in expansion territory are all growing more slowly than they did in October, suggesting that the slowdown we have observed across the logistics industry has continued in earnest through the first two months of Q4.
| LOGISTICS AT A GLANCE | |||||
| Index | November 2022 Index | October 2022 Index | Month-Over-Month Change | Projected Direction | Rate of Change |
| LMI® | 53.6 | 57.5 | -3.9 | Growing | Slower |
| Inventory Levels | 54.8 | 65.5 | -10.7 | Growing | Slower |
| Inventory Costs | 73.4 | 80.9 | -7.5 | Growing | Slower |
| Warehousing Capacity | 46.8 | 44.7 | 2.1 | Contracting | Slower |
| Warehousing Utilization | 56.8 | 60.8 | -4.0 | Growing | Slower |
| Warehousing Prices | 74.4 | 75.5 | -1.1 | Growing | Slower |
| Transportation Capacity | 71.4 | 73.1 | -1.7 | Growing | Slower |
| Transportation Utilization | 50.0 | 52.8 | -2.8 | Growing | Slower |
| Transportation Prices | 37.4 | 42.2 | -4.8 | Contracting | Faster |
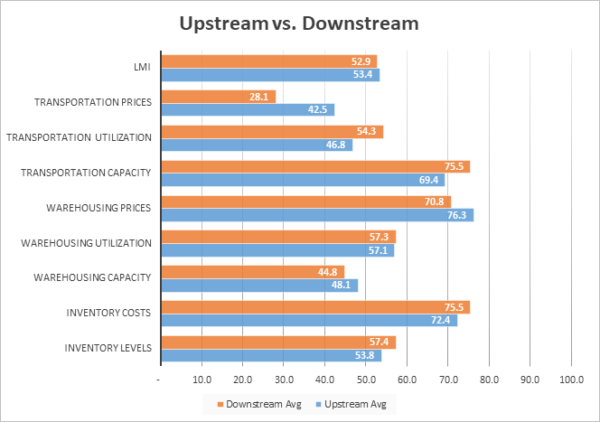
This month, Downstream firms (orange bars) reported significantly faster rates of Inventory Level growth than their Upstream counterparts (blue bars). The most significant difference was in the gulf between movement in Transportation Prices. Both groups saw prices decreasing, but Downstream respondents experienced a much more pointed contraction (reading in at 28.1 – 14.4 points lower than their Upstream counterparts’ 42.5). This suggests that the price of shipping to retail stores and to consumers is dropping fast, suggesting an easing in the last-mile delivery market that should be a boon to those who (like some of the authors of this report) buy holiday presents at the last minute. Relatedly, Downstream firms are observing fast rates of growth in Transportation Capacity and Utilization. So, they are seeing a lot of capacity coming onto the market and utilizing it to ship products to consumers at low prices. Warehousing Prices are also growing slightly faster Upstream, perhaps indicating a lack of capacity at the B2B level.
| Inv. Lev. | Inv. Costs | WH Cap. | WH Util. | WH Price | Trans Cap | Trans Util. | Trans Price | LMI | |
| Upstream | 53.8 | 72.4 | 48.1 | 57.1 | 76.3 | 69.4 | 46.8 | 42.5 | 53.4 |
| Downstream | 57.4 | 75.5 | 44.8 | 57.3 | 70.8 | 75.5 | 54.3 | 28.1 | 52.9 |
| Delta | 3.6 | 3.2 | 3.3 | 0.2 | 5.5 | 6.2 | 7.5 | 14.4 | 0.6 |
| Significant? | No | No | No | No | No | No | No | Yes | No |
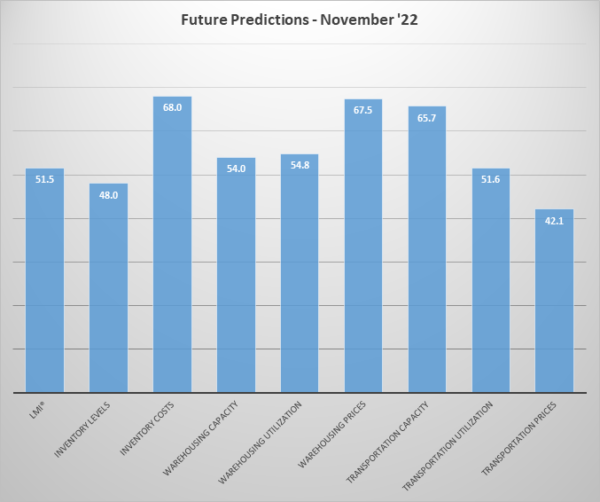
Respondents were asked to predict movement in the overall LMI and individual metrics 12 months from now. Their predictions for future ratings are presented below. November’s future predictions present somewhat muted expectations for logistics in 2023. The overall growth expectation of 51.5 is down (-3.7) from October’s prediction and is dragged down by the prediction of contraction for Inventory Levels and Transportation Prices. Contraction for the may be due to a combination of selling off some goods during Q4 and getting back to “normal” levels of inventory. The other six metrics are all expected to fall within “normal” growth ranges in the ’50s and ’60s. this is the first future prediction to not include expectations expansion in the 70s for any metric in over two years. Whether or not this represents a return to normal growth or anticipation of recession remains to be seen. What is clear however is that respondents do not expect a significant rate of growth across any metric over the next 12 months.
The exact nature of the future predictions varies by supply chain position[29]. In November we observe a marginally significant difference in the expectation of Transportation Price growth over the next 12 months. Both respondent groups are anticipating contraction over the next year, but Downstream firms are expecting the rate of contraction to be 9.1 points more severe than their upstream counterparts. Conversely, we also see that Downstream firms anticipate Inventory Levels to grow over the next 12 months, while Upstream firms expect a moderate contraction. This suggests that Downstream firms expect to restock inventory after the current glut is worked through, but Upstream respondents, possibly expecting continued supply issues, reduced industrial demand, or both, plan to continue reducing inventories.
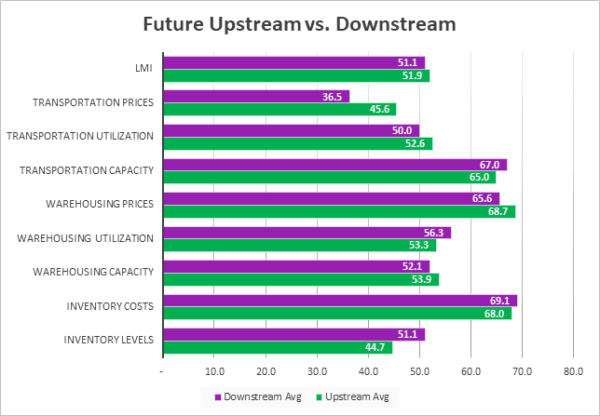
| Futures | Inv. Lev. | Inv. Costs | WH Cap. | WH Util. | WH Price | Trans Cap. | Trans Util. | Trans Price | LMI |
| Upstream | 44.7 | 68.0 | 53.9 | 53.3 | 68.7 | 65.0 | 52.6 | 45.6 | 51.9 |
| Downstream | 51.1 | 69.1 | 52.1 | 56.3 | 65.6 | 67.0 | 50.0 | 36.5 | 51.1 |
| Delta | 6.3 | 1.1 | 1.8 | 3.0 | 3.0 | 2.0 | 2.6 | 9.1 | 0.8 |
| Significant? | No | No | No | No | No | No | No | Marginal | No |
Historic Logistics Managers’ Index Scores
This period along with prior readings from the last two years of the LMI is presented table below:
| Month | LMI | Average for last 3 readings – 57.5
All-time Average – 64.7 High – 76.5 Low – 51.3 Std. Dev – 7.1
|
| Nov ‘22 | 53.6 | |
| Oct ‘22 | 57.5 | |
| Sep ‘22 | 61.4 | |
| Aug ‘22 | 59.7 | |
| July ‘22 | 60.7 | |
| June ‘22 | 65.0 | |
| May ‘22 | 67.1 | |
| Apr ‘22 | 69.7 | |
| Mar ‘22 | 76.2 | |
| Feb ‘22 | 75.2 | |
| Jan ‘22 | 71.9 | |
| Dec ‘21 | 70.1 | |
| Nov ‘21 | 73.4 | |
| Oct ‘21 | 72.6 | |
| Sep ‘21 | 72.2 | |
| Aug ‘21 | 73.8 | |
| July ‘21 | 74.5 | |
| June ‘21 | 75.0 | |
| May ‘21 | 71.3 | |
| Apr ‘21 | 74.5 | |
| Mar ‘21 | 72.2 | |
| Feb ‘21 | 71.4 | |
| Jan ‘21 | 67.2 | |
| Dec ‘20 | 66.7 | |
| Nov ‘20 | 70.8 |
LMI®
November’s overall Logistics Manager’s Index reads in at 53.6, falling from October’s reading of 57.9 and down 3.9 points for the second consecutive month. One of the drivers behind the overall drop is the dip in inventory levels and costs as firms not only shift inventories downstream but begin to wind them down through holiday sales. Warehousing Capacity remains tight, and prices are high, but these forces are counteracted by the continued slide in transportation metrics, with top-5 all-time Transportation Capacity expansion and the quickest rate of Transportation Price growth in the history of the LMI. It will be crucial to observe whether or not transportation metrics begin to bounce back at all in the new year, once the glut of inventory has been wound down further.
Respondents seem to expect a meager rate of expansion over the next 12 months, predicting a growth rate of 51.5, down (-3.7) from October’s future prediction of 55.2. The weak levels of expansion are pulled down by expected contractions in both Inventory Levels and Transportation Prices.
Inventory Levels
The Inventory Level value is 54.8, down (-10.7) from October’s reading of 65.5, and down a staggering 25.4 from the index’s all-time highest value in February of this year. For the first time in a year, the current reading is below the all-time average value for this metric of 62.7. Since November 2016, there has been a consistent trend of inventory growth (50 or higher), with only two values indicating a contraction in inventory levels (i.e., below 50). Downstream respondents reported greater inventory growth by 3.6 pts, (57.4 vs 53.8). Last month, Downstream respondents reported greater inventory growth by 9.8 pts, (72.1 vs 62.3) as Downstream inventories continue to increase faster than downstream in anticipation of holiday sales. The current value indicates that Inventory Levels are up from last month, but only slightly. It is also worth noting that in the past when the index value has fallen significantly, it is typically followed by a positive increase in the subsequent period, so there is a chance the inventory level index will bounce back up somewhat, post-holiday.
When asked to predict what conditions will be like 12 months from now, the average value is 47.2, down from last month’s value (57.8). Downstream is slightly higher (51.1 vs 44.7). The average predicted value for next year of 47.2 is lower than the current actual value of 54.8 and would mean respondents – particularly those upstream – expect inventory levels to decline over the next year.
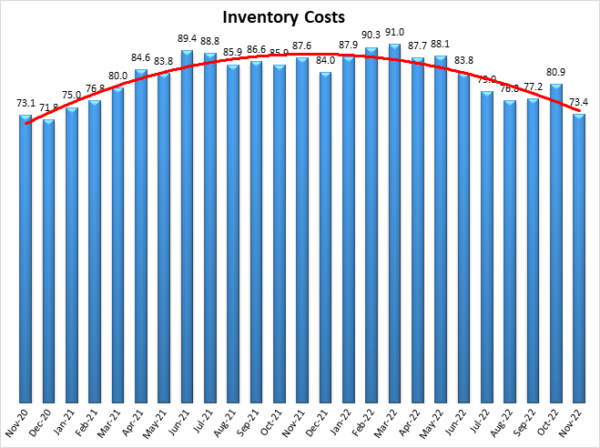
Inventory Costs
The current Inventory Costs index value represents a decrease, continuing the downward trend. The value of 73.4 was down (-7.5) from October’s reading of 80.9, but roughly back in line with the three previous readings from July-September, suggesting that last month’s spike was indeed an aberration (as we had postulated) stemming from the movement of goods downstream for the holiday shopping season. With this recent decline, Inventory Levels are now below the long-term average of 75.0. The Inventory Levels index value has been declining, so it is not surprising that the Inventory Cost index value has also been falling. This month, Downstream respondents reported higher inventory cost numbers by 3.2 points, (75.5 vs 72.4). It is not surprising that Downstream costs are higher because as we saw in the previous section, Downstream Inventory Levels increased 3.6 points faster.
Above, we saw that respondents expect inventory levels to decrease over the next 12 months. Normally, one might expect inventory costs over the same 12 months to also decline. However, respondents predict that inventory costs will continue growing significantly (68.4) over the next 12 months with Upstream and Downstream respondents very much in agreement (68.0 vs 69.1). This may be representative of the continued high cost of warehousing, which will be slower to move due to long-term contract rates.
Warehousing Capacity
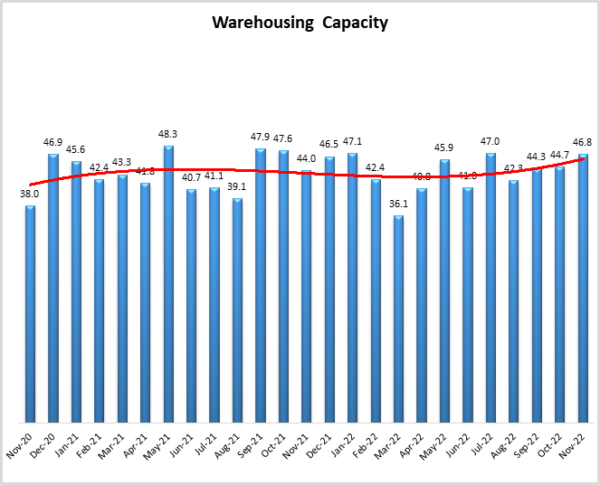
The November 2022 Warehousing Capacity registered in at 46.8, up (+2.1) from October’s reading of 44.7. This reading is up 2.8 percentage points from the reading one year ago and up 8.2 points from the reading two years ago. However, even with the slowing rate of contraction, the fact remains that this metric has contracted every month since August 2020. Further examining this number, we see that when split between Upstream and Downstream. Upstream is showing a further easing with a value of 48.1 vs 44.8 on the Downstream. Thus, it appears that the inventory has begun to work its way down to the final mile portion of the supply chain (i.e. retail). With the holiday shopping season in full force, this softening of the already tight capacity market could be a welcome sign.
Looking forward to the next 12 months, respondents continue to expect moderate rates of growth, predicting an expansionary rate of 54.0, with is down (-8.0) from October’s future prediction of 62.0. Despite the optimism that some capacity may come online, respondents are still expecting cost increases (as we will see below).
Warehousing Utilization
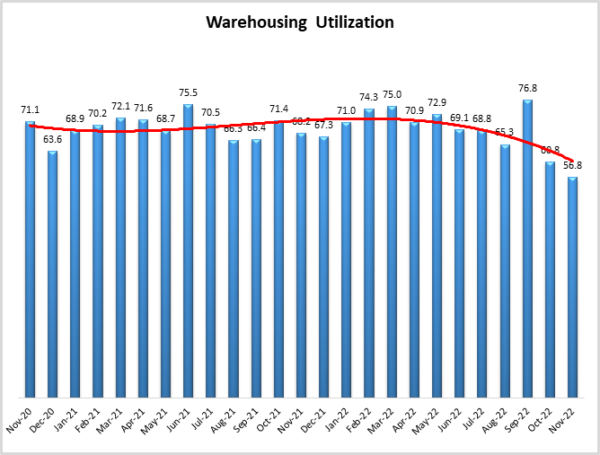
The Warehousing Utilization Index registered in at 56.8 in November, down (-4.0) from October’s reading of 60.8. This is also down 11.4 points from the reading one year ago, and down by over 14 points from two years ago. Interestingly, and unlike the numbers for Warehousing Capacity, the Upstream v. Downstream responses are virtually identical with 57.3 and 57.1 for Downstream and Upstream, respectively. A conclusion that can be drawn is that the softening that is being seen in inventory is having a commensurate effect on warehousing. Alternatively, the larger macroeconomic environment in which firms are operating could be driving hesitancy in consumption. Inflationary pressures combined with interest rate increases will continue to shape consumption, and the supply chain will adapt accordingly.
Looking forward to the next 12 months, the predicted Warehousing Utilization index is 54.8, down (- 8.9) from October’s future prediction of 63.7. This represents a much more moderate rate of growth than we have seen lately, giving some credence to the above prediction that Inventory Levels will continue to moderate over the next year.
Warehousing Prices
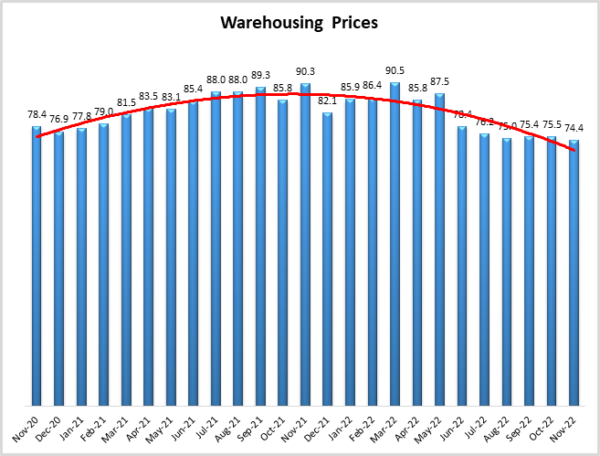
The warehousing Prices Index registered in at 74.4, down (-1.1) from October’s reading of 75.5. This is a 15.9-point decrease from the reading one year ago, and a 4-point reduction from the reading two years ago. The slowdown in growth is likely due to the shift of inventories downstream. One caveat to make, however, is that traditionally there has been a 1-3 month lag in the impact of capacity and utilization on pricing in the warehouse space. Thus, this reading should be taken with a grain of salt, as there have been confounding patterns in the past. Interestingly, there is a rather substantial difference between Upstream and Downstream pricing, where Upstream is registering at 76.3 and Downstream at 70.8. This split, in conjunction with the capacity numbers on the Upstream/Downstream split, is consistent with the differences we observe in price.
Future predictions suggest that respondents are expecting prices to continue to grow at a rate of 67.5, down (-6.5) from October’s future prediction of 74.0. With this reduction, all of the future metrics that are predicted to expand now read in the 50s or 60s, representing much more moderate or “normal” rates of expansion which may be more sustainable.
Transportation Capacity
The Transportation Capacity Index registered 71.4 in November 2022. This constitutes a decrease of 1.7 points from the October reading of 73.1. With this decrease, the Transportation Capacity Index retreated slightly from an all-time high but remains very elevated. The slowdown is more pronounced Upstream, with the Upstream Transportation Capacity index indicating 69.4 and the Downstream index indicating 75.5.
The future Transportation Capacity Index also continues to indicate expansion, registering 65.7, which is 1.4 points lower than the previous reading. Upstream firms indicate a future Transportation Capacity index of 65.0 while Downstream firms indicate a future expectation of 67.0. As such, it can be concluded that the expectations of continued transportation capacity expansion are diffused relatively evenly across the supply chains.
![]()
Transportation Utilization
The Transportation Utilization Index registered 50.0 in November 2022. This denotes a retreat of 2.8 from the 52.8 level registered in October. With this decrease we are down to the critical level of 50 that separates expansion and contraction. Given that later submissions were slightly more negative, we may be seeing the beginning of a contraction period in transportation utilization. The downstream Transportation Utilization Index is at 54.3, while the upstream index is at 46.8.
The future Transportation Utilization Index decreases 5 points from the previous reading and indicates a 51.6 level for the next 12 months. The expectations of future growth are slightly lower for Downstream firms where the future Transportation Utilization index is indicating 50.0 and while the Upstream firms are registering 52.6. As such, it can be concluded that overall, the Transportation Utilization expectations for the future are relatively flat.
Transportation Prices
The Transportation Prices Index continued to decrease and registered 37.4 in November 2022. This corresponds to a drop of 4.8 points from the October Transportation Prices reading of 42.2. With this drop, the Transportation Prices Index pushes further down into contraction territory and registers a brand new 2-year low. The price index drop is much stronger for Downstream supply chain firms, with the Upstream price index at 42.5 and the downstream transportation price index at only 28.1.
The future index for Transportation Prices continues to slide below the critical 50.0 level, registering 42.1, now indicating expectations of further decreasing Transportation Prices for the next year. These lower price future expectations are stronger for Downstream firms, with a future Downstream Transportation Price index at 36.5 and an Upstream future Transportation Price index at 45.6.
About This Report
The data presented herein are obtained from a survey of logistics supply executives based on information they have collected within their respective organizations. LMI® makes no representation, other than that stated within this release, regarding the individual company data collection procedures. The data should be compared to all other economic data sources when used in decision-making.
Data and Method of Presentation
Data for the Logistics Manager’s Index is collected in a monthly survey of leading logistics professionals. The respondents are CSCMP members working at the director level or above. Upper-level managers are preferable as they are more likely to have macro-level information on trends in Inventory, Warehousing, and Transportation trends within their firm. Data is also collected from subscribers to both DC Velocity and Supply Chain Quarterly as well. Respondents hail from firms working on all six continents, with the majority of them working at firms with annual revenues over a billion dollars. The industries represented in this respondent pool include, but are not limited to Apparel, Automotive, Consumer Goods, Electronics, Food & Drug, Home Furnishings, Logistics, Shipping & Transportation, and Warehousing.
Respondents are asked to identify the monthly change across each of the eight metrics collected in this survey (Inventory Levels, Inventory Costs, Warehousing Capacity, Warehousing Utilization, Warehousing Prices, Transportation Capacity, Transportation Utilization, and Transportation Prices). In addition, they also forecast future trends for each metric ranging over the next 12 months. The raw data is then analyzed using a diffusion index. Diffusion Indexes measure how widely something is diffused, or spread across a group. The Bureau of Labor Statistics has been using a diffusion index for the Current Employment Statics program since 1974, and the Institute for Supply Management (ISM) has been using a diffusion index to compute the Purchasing Managers Index since 1948. The ISM Index of New Orders is considered a Leading Economic Indicator.
We compute the Diffusion Index as follows:
PD = Percentage of respondents saying the category is Declining,
PU = Percentage of respondents saying the category is Unchanged,
PI = Percentage of respondents saying the category is Increasing,
Diffusion Index = 0.0 * PD + 0.5 * PU + 1.0 * PI
For example, if 25 says the category is declining, 38 says it is unchanged, and 37 says it is increasing, we would calculate an index value of 0*0.25 + 0.5*0.38 + 1.0*0.37 = 0 + 0.19 + 0.37 = 0.56, and the index is increasing overall. An index value above 0.5 indicates the category is increasing, a value below 0.5 indicates it is decreasing, and a value of 0.5 means the category is unchanged. When a full year’s worth of data has been collected, adjustments will be made for seasonal factors as well.
[1]Adobe. (2022, November 29). 2022 Holiday Shopping Trends & Insights Report | Adobe for Business. Holiday Shopping Report. https://business.adobe.com/
[2] Capoot, A. (2022, November 26). Black Friday online sales top $9 billion in new record. CNBC. https://www.cnbc.com/2022/11/
[3] James, D. (2022, November 29). Cyber Monday spend reaches $11.3B with a surge in BNPL usage: Report. Retail Dive. https://www.retaildive.com/
[4] Repko, M. (2022, November 29). Shopper turnout hit record high over Black Friday weekend, retail trade group says. CNBC. https://www.cnbc.com/2022/11/
[5] Torry, H. (2022, December 2). Consumer Spending Jumped in October as Inflation Eased. WSJ. https://www.wsj.com/articles/
[6] Mena, B., & Torry, H. (2022, November 30). Third-Quarter U.S. Growth Was Stronger Than Previously Thought. WSJ. https://www.wsj.com/articles/
[7] Young, L. (2022b, December 1). Some Retailers Are Learning to Love Bulked-Up Inventories. Wall Street Journal. https://www.wsj.com/articles/
[8] Freightos. (2022, December 2). FBX | Freightos Baltic Index | World Freight Container Index. China/East Asia to North America West Coast, December 2 2022. https://fbx.freightos.com
[9] Fiore, T. (2022). ISM Report On Business—Manufacturing PMI. ISM. https://www.ismworld.org/
[10] Berger, P. (2022a, October 21). Southern California’s Notorious Container Ship Backup Ends. Wall Street Journal. https://www.wsj.com/articles/
[11] Cheng, S. (2022, November 30). Volkswagen, Honda Halt Production at China Plants Due to Covid-19 Curbs. WSJ. https://www.wsj.com/articles/
[12] DC Velocity Staff. (2022, December 1). Global supply chain disruption, rising costs driving interest in nearshoring production to Mexico | DC Velocity. https://www.dcvelocity.com/
[13] Wuerthele, M. (2022, December 1). Apple will take one-third of TSMC chips made in Arizona. AppleInsider. https://appleinsider.com/
[14] Ames, B. (2022, December 2). Human workers take on new roles in a world of warehouse robots | DC Velocity. https://www.dcvelocity.com/
[15] Young, L. (2022a, November 18). Amazon Looks to Sparrow to Carry its Robotics Ambitions. Wall Street Journal. https://www.wsj.com/articles/
[16] Berger, P. (2022c, November 25). Warehouse Packing Help Wanted, Excellent Penmanship Required. Wall Street Journal. https://www.wsj.com/articles/
[17] Cambon, S. C. (2022, December 2). November Employment Report Shows U.S. Economy Added 263,000 Jobs. WSJ. https://www.wsj.com/articles/
[18] Pound, J. (2022, December 2). Here’s where the jobs are for November 2022—In one chart. CNBC. https://www.cnbc.com/2022/12/
[19] Solomon, M. (2022, November 12). FedEx Freight to begin driver furloughs next month. FreightWaves. https://www.freightwaves.com/
[20] Elliott, R. (2022, December 1). Tesla Delivers Semi Trucks to PepsiCo, Expanding Beyond Passenger Vehicles. WSJ. https://www.wsj.com/articles/
[21] Berger, P. (2022b, November 20). California Looks to Ban Diesel Trucks at Ports by 2035. Wall Street Journal. https://www.wsj.com/articles/
[22] Straight, B. (2022, December 1). Last-mile operations slow to adopt EVs, lack sustainability measurement tools. FreightWaves. https://www.freightwaves.com/
[23] U.S. Energy Information Administration. (2022, November 28). Gasoline and Diesel Fuel Update. Gasoline and Diesel Fuel Update November 28, 2022. https://www.eia.gov/petroleum/
[24] Kingston, J. (2022, November 28). DOE/EIA benchmark diesel price sees biggest 1-week drop since August. FreightWaves. https://www.freightwaves.com/
[25] LaRocco, L. A. (2022, November 28). Tech companies begin rerouting critical chip supplies to trucks with rail strike looming. CNBC. https://www.cnbc.com/2022/11/
[26] Sherman, N. (2022, November 29). US rail strike 2022: What would be affected if it happens? BBC News. https://www.bbc.com/news/
[27] Ferek, K. S., & Parti, T. (2022, December 2). Biden Signs Legislation Preventing Railroad Strike. WSJ. https://www.wsj.com/articles/
[28] – Gallagher, J. (2022, December 1). Senate proposes $755 million for truck parking. FreightWaves. https://www.freightwaves.com/
[29] Note that not all respondents identify their industry, so some responses are missing from the Upstream/Downstream calculations.