- LMI® at 47.3
- Growth is INCREASING AT AN INCREASING RATE for: Warehousing Capacity
- Growth is INCREASING AT AN DECREASING RATE for: Inventory Costs, Warehousing Utilization, Warehousing Prices, and Transportation Capacity
- Inventory Levels, Transportation Utilization, and Transportation Prices ARE DECREASING
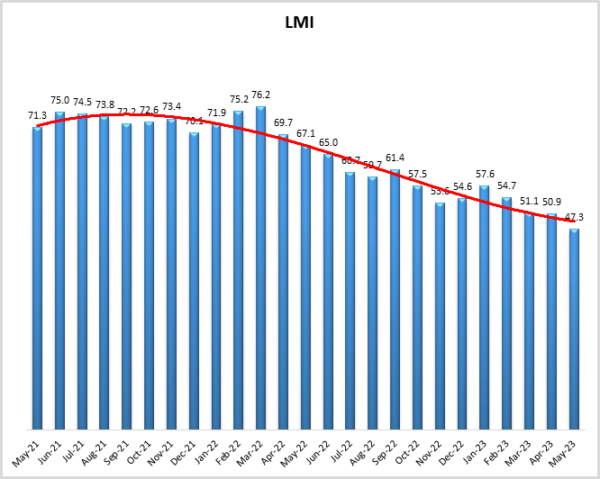
For the third consecutive month the Logistics Managers’ Index has reached a new all-time low and for the first time in its 6.5-year history it has moved into contraction territory, reading in at 47.3 in May – down 3.6-points from April’s reading of 50.9. The biggest factor behind this drop is the continued softening of the freight market. Transportation Utilization was down (-9.5) to 45.5, indicating contraction and signaling that shippers are using even less of the available space than they did a month ago. Relatedly, Transportation Prices are down (-8.9) to 27.9, which is the sharpest rate of contraction that we have ever observed for this metric. Taken together, it would appear that the glut of available capacity has driven down utilization and prices. There is little hope of a reprieve for carriers in the form of restocking inventories. Inventory Levels dropped (-1.5) to 49.5 which is the first time inventories have been in contraction territory since February of 2020. It should be noted however that downstream retail inventories do continue to grow at a rate of 54.4, it is the upstream manufacturer and wholesaler inventories that are contracting (46.7) and bringing the overall number down. Warehousing Prices are still growing at a rate of 62.8 but are down (7.0) from last month and at their lowest level since June 2020. These are likely to continue to come down as more long-term contracts signed during 2020 and 2021 continue to come off the books.
Researchers at Arizona State University, Colorado State University, Florida Atlantic University, Rutgers University, and the University of Nevada, Reno, and in conjunction with the Council of Supply Chain Management Professionals (CSCMP) issued this report today.
Results Overview
The LMI score is a combination of eight unique components that make up the logistics industry, including: inventory levels and costs, warehousing capacity, utilization, and prices, and transportation capacity, utilization, and prices. The LMI is calculated using a diffusion index, in which any reading above 50.0 indicates that logistics is expanding; a reading below 50.0 is indicative of a shrinking logistics industry. The latest results of the LMI summarize the responses of supply chain professionals collected in May 2023.
As has been the case for the last year, the overall economy continues to be a product of shifting interest rates. The Federal Reserve has signaled that they will pause their cycle of interest rate increases at their June meeting. Officials caution that this does not mean that their campaign has finished for this cycle, but they felt that a slowdown was necessary given the recent issues with the banking industry. It should be pointed out that the current interest rates of 5.25% are lower than the 5.5% rates that Jerome Powell thought would be required to get inflation down to 2%[1]. Another factor likely to weigh on interest rates is the latest JOLTS report which suggested that the U.S. had 10.1 million job openings in April. While this is up from the 9.7 million that were available in March, it is a far cry from the 12 million positions that were available a year ago. Transportation and warehousing are among the industries that saw an increase in available positions[2]. Job growth continued to be a source of strength in the U.S. economy with a seasonally adjusted 339,000 new positions added in May (along with an upward revision of 93,000 for March and April). Jobs were added in a variety of sectors pertinent to the logistics industry including construction, engineering, transportation, and warehousing[3]. When dissecting the industries where jobs are being added, it would appear that the federal reserve’s program of interest rates has done little to slow down growth in the service sector. As pointed out by Sachin Mehra, CFO of Mastercard, lower unemployment leads to more paychecks for consumers, which in turn leads to more spending[4]. This is evident in consumer spending increasing 0.8% in April. This is a much larger jump than the 0.1% increases observed in February and March[5]. Increased rates do however appear to be impacting manufacturing and in turn transportation. ISM’s manufacturing index read in at 46.9 in May, down from April’s reading of 47.1. This marks the seventh straight month of decline for this metric. It is unlikely production will increase before firms have more certainty regarding the future of interest rates[6].
The international picture remains mixed as well. Inflation is also down in the Eurozone in May, declining to 6.1% year-over-year which is its lowest rate of growth in 15 months. Analysts believe that the ECB is likely to continue raising interest rates, but could be nearing the end of, or at least a break from, their program of increases[7]. Conversely, the rapid recovery seen in China in Q1 seems to have slowed in recent months. Suggesting that the burst of spending spurred by the end of COVID lockdowns has run into some of the underlying issues in the Chinese economy which include a bleak real estate market, large government debt, and low consumer confidence. These issues combined with geopolitical tensions caused direct foreign investment in China to be $180 billion in 2022 which was down 48% year-over-year. Those hoping that a restart of the Chinese manufacturing machine would jumpstart international logistics will have to continue waiting a while longer[8].
The negatives seem to outweigh the positives in the logistics industry as the overall LMI declined to 47.3 in May, down (-3.7) from April’s reading of 50.9. This is the first time in the 82 months of the LMI that the overall index has contracted. The rate of contraction was stronger for Upstream firms than for their Downstream counterparts at a rate of 45.3 to 48.2. While contraction is taking root throughout the supply chain, it continues to be sharper for the upstream players such as wholesalers, manufacturers, and the B2B carriers that connect them – likely because those entities are more impacted by uncertainty regarding interest rates. We also see that contraction was sharper in late May (44.1) than it was in the first half of the month (49.4), meaning that logistics activity declined more rapidly later in the month.
This late May decline was largely driven by shifts in inventories. Inventory Levels were only down mildly (-1.5) to 49.5 in May. However, the shift becomes much more drastic when splitting the month in two. From May 1-18, Inventory Levels actually expanded at a rate of 59.8; but from May 19-31, they contracted at a rate of 41.5. Similar dynamics were at play with Inventory Costs, which went from a robust expansion of 72.0 in early May to a more moderate growth rate of 58.5 later in the month. Inventories are clearly down across the board. Target and Walmart reported year-over-year inventory decreases of 16% and 9% respectively in recent earnings calls. Many consumer goods firms have achieved the inventory wind down they strove for throughout 2022. However, the swift restocking that some had expected has not materialized. J.B. Hunt reports that their customers engage in conversations about restocking, but so far it has not materialized[9]. Back-to-school season is one of the busiest times in the freight industry. Generally, many associated goods come into the U.S. in May. ImportGenius data shows that May 2023 imports of lunchboxes, backpacks, and notebooks were all down year-over-year. However, they did come in at a higher rate than in 2019-2021[10]. This suggests that some inventories are being replenished but are unlikely to get back to the levels we saw last year. This is reflected in overall volumes. U.S. seaport activity is down by double digits from 2022 but is still several percentage points up from the volumes seen in 2019. It will be interesting to observe whether a similar pattern holds for holiday inventories later in the Summer.
Consumers continue to spend on services like dining as well as on items like apparel and cosmetics. Big-ticket items however continue to be slow, with demand for items like furniture, high-end electronics, and DIY construction materials being quite low relative to the last few years. We also see that demand for higher-end apparel and accessories has slowed, with demand shifting to lower-cost goods. This is reflected in the simultaneous slowdown in sales at places like Macy’s and ramp-up at Walmart and BJ’s Wholesale Club[11]. Essentially, anything tied to the housing market or something with a large interest rate remains slow, while consumables and lower-end items, such as though sold in dollar stores, continue to chug along[12].
A potential ramp-up of goods could be hamstrung by port issues. Operations halted at the Port of Oakland during the first week of June as dockworkers failed to show up for work on June 1-2. There were similar labor shortages up and down the west coast ports, as the International Longshore and Warehouse Union has been working without a contract since last Summer. With the reduced volume coming through ports so far in 2023, it remains to be seen what labor’s leverage will be in these negotiations[13]. That being said, while overall volumes are down, firms are behaving similarly to 2022 in that they continue to utilize East and Gulf Coast ports, eschewing their pre-pandemic strategy of routing almost everything through the ports of Los Angeles and Long Beach[14].
While Inventory Costs did decline slightly (-0.7), their reading of 64.4 still indicates a healthy rate of expansion. Essentially, we are seeing the amount of inventory on-hand decrease in many places, but the cost of holding it in stock is still high. This may be partially because larger bulk goods are not moving quickly, and static inventories can be expensive. Another likely factor behind Inventory Cost expansion may be the cost of storage and warehousing. Warehousing Prices are still growing at a rate of 62.8 but are down (-7.0) from April’s reading of 69.8. This is down 24.7-points from May 2022’s reading of 87.5 as the rate of expansion for this metric continues to trend downwards. This metric will likely continue on its downward trajectory as contracts that were signed in the boom times of 2020-2022 expire and newer, cheaper deals are made. We also see that the types of firms leasing space are shifting rapidly. Ecommerce leases are down 66% year-over-year as consumers continue the shift back towards services. One bright spot for the industrial real estate sector is the uptick in renewable energy companies using the space to produce items such as batteries and solar panels. Ecommerce leases in Q1 2023 accounted for 4.7 million square feet, down from 13.7 million the year before. As a result of the slowdown in ecommerce retailers are increasingly investing in decreasing returns, with some even charging consumers for returns by mail – something that would have been unthinkable a few years ago, and is leading to less returned inventory clogging up warehouses and reverse logistics channels[15]. There have also been anecdotal reports of firms like Big Lots and Walmart shuttering distribution centers in a bid to right-size their distribution networks for evolving consumer demand[16]. Conversely, electric vehicle manufacturers and component producers more than doubled their leases from 1.5 to 3.7 million square feet over the same period of time[17]. At the same time that demand is changing Warehousing Capacity continues to come online at a rate of 56.7. This is up (+2.0) from April’s reading of 54.7 and marks four consecutive months of expansion coming after 2.5 years of contraction. As the result of more space being available, the rate of expansion for Warehousing Utilization is down slightly (-0.5) to 54.7. This is the second-lowest rate of expansion ever for this metric – only behind the 54.5 registered in June/July of 2017. Warehousing Utilization has never contracted in our metrics. If the seasonal restocking of goods does not happen later this year, crossing into negative territory will become a distinct possibility.
Without an influx of inventory for the holiday season, the freight market will continue to struggle. Whether or not a new wave of inventory is coming is unclear, with different groups holding different opinions. With the reduced volumes many brokers and carriers, such as Landstar Systems, lowered their guidance[18]. Landstar System. DHL and SEKO logistics report that they have not seen their usual peak season bookings through June or July, but are “cautiously optimistic” that volumes will return in the second half of the year as we build towards the holiday season[19]. There will be capacity available should inventories come in. Transportation Capacity continued to grow (-1.3) at a rate of 69.3 in May. While this is the first reading below 70.0 – which we classify as a significant rate of growth – since September 2022, it still shows robust expansion and a mismatch of supply and demand. This is reflected in Transportation Utilization which has dropped (-9.5) to 45.5 which is firmly into contraction territory and is the lowest reading in this metric since April 2020 (a time no one in the freight industry would ever want to be compared to).
The situation is most dire for Transportation Prices, which are down (-8.9) to an all-time low of 27.9. This is the first time this metric has read in the 20’s and indicates a highly significant rate of contraction. Beyond the lack of demand, U.S. diesel prices are now down $1.68 from a year ago, averaging $3.85 per gallon at retail prices[20]. Interestingly, the price of oil did rise slightly in the first week of June after the U.S. passed a bill agreeing to increase the debt ceiling and avoiding default[21]. Despite this, Saudi Arabia did announce another cut of one million barrels per day starting July 1st in the OPEC meeting held on June 4th. When combined with other recent cuts, oil production is now down 4.6 million barrels a day since October (McHugh, 2023).
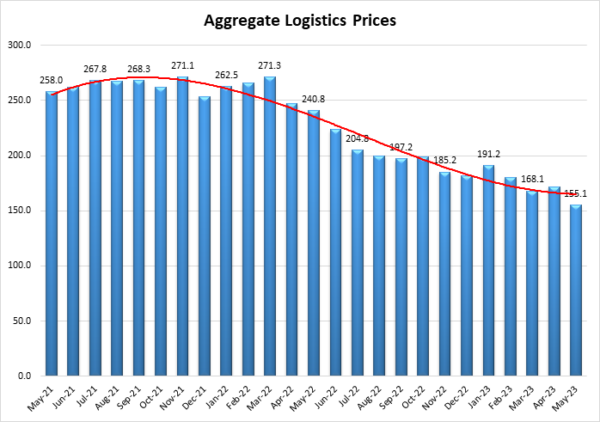
Much of the slowness we observed in May can be summarized in our Aggregate Logistics Prices metric. This metric is a composite of Inventory Costs, Warehousing Prices, and Transportation Prices. It ranges from 0-300 with any reading over 150.0 signaling expansion and a number under 150.0 signaling contraction. Keeping with the theme of the rest of this month’s report, May’s aggregate number was the lowest in the history of the index, reading in at 155.1 which is close to the breakeven level. This is 85.7-points down from this time a year ago and 116.2 down from the all-time high reached in March 2022. If we continue on this trajectory we may see aggregate prices move towards contraction at some point soon. While the continued contraction has been tough on carriers, there is strong evidence that decreased logistics costs have contributed significantly to the slowdown in overall U.S. inflation. As logistics prices come down and eventually moderate we could see inflation continue to moderate, which may lead to a slowdown in interest rates and eventual recovery in the freight market. It appears that we will have to hit the bottom before a rebound can occur. The questions now are where that bottom is, and whether or not we are getting close to it?
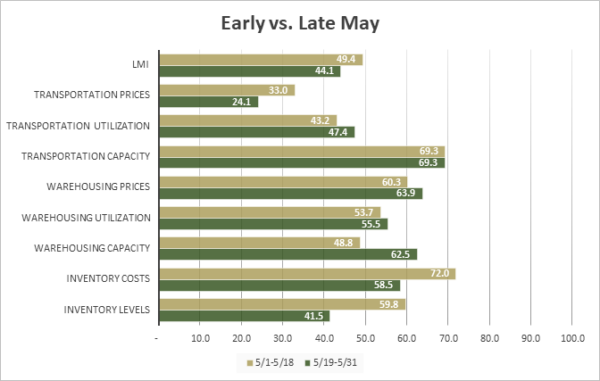
In a repeat of what we observed in April, the logistics industry was markedly slower in the second half of May (5/19-5/31, represented by green bars) than in the first half of the month (5/1-5/18, represented by gold bars). The overall index was 5.3- points lower (49.4 to 44.1) in the second half of the month as contraction accelerated. This is largely attributable to shifts in inventory. Inventory Levels dropped 18.2-points – veering into contraction (59.8 to 41.5) and Inventory Costs were down significantly as well (72.0 to 58.5), leading to a shift from contraction to expansion (48.8 to 62.5) in available Warehousing Capacity. We also observed a marginal decrease in Transportation Prices, as their rate of contraction moved from 33.0 to 24.1. If the trends observed in late May continue into June it is possible we will reach yet another new nadir in the overall index.
| Inv. Lev. | Inv. Costs | WH Cap. | WH Util. | WH Price | Trans Cap | Trans Util. | Trans Price | LMI | |
| May 1-18 | 59.8 | 72.0 | 48.8 | 53.7 | 60.3 | 69.3 | 43.2 | 33.0 | 49.4 |
| May 19-31 | 41.5 | 58.5 | 62.5 | 55.5 | 63.9 | 69.3 | 47.4 | 24.1 | 44.1 |
| Delta | 18.2 | 13.5 | 13.7 | 1.8 | 3.6 | 0.0 | 4.2 | 8.8 | 5.3 |
| Significant? | Yes | Yes | Yes | No | No | No | No | Marginal | Marginal |
The index scores for each of the eight components of the Logistics Managers’ Index, as well as the overall index score, are presented in the table below. Most strikingly, the overall LMI index is contracting for the first time in the nearly seven-year history of the index. Three of the eight sub-metrics are contracting this month, with Transportation Utilization and Inventory Levels moving away from expansion and joining Transportation Prices in contraction. Four of the five metrics that are expanding are doing so at a reduced rate. Only Warehousing Capacity is expanding at a faster rate than what we saw in May.
| LOGISTICS AT A GLANCE | |||||
| Index | May 2023 Index | April 2023 Index | Month-Over-Month Change | Projected Direction | Rate of Change |
| LMI® | 47.3 | 50.9 | -3.6 | Contracting | From Expansion |
| Inventory Levels | 49.5 | 50.9 | -1.5 | Contracting | From Expansion |
| Inventory Costs | 64.4 | 65.1 | -0.7 | Expanding | Slower |
| Warehousing Capacity | 56.7 | 54.7 | 2.0 | Expanding | Faster |
| Warehousing Utilization | 54.7 | 55.1 | -0.5 | Expanding | Slower |
| Warehousing Prices | 62.8 | 69.8 | -7.0 | Expanding | Slower |
| Transportation Capacity | 69.3 | 70.6 | -1.3 | Expanding | Slower |
| Transportation Utilization | 45.5 | 55.0 | -9.5 | Contracting | From Expansion |
| Transportation Prices | 27.9 | 36.8 | -8.9 | Contracting | Faster |
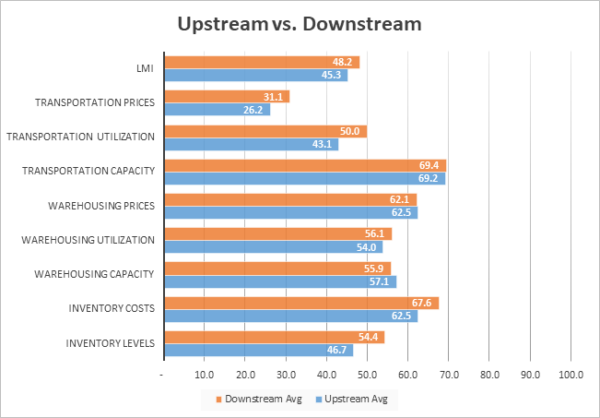
While there are no statistically significant differences between our Downstream (orange bars) and Upstream (blue bars) respondents in May, we do still see some interesting direction differences. The most important differences here are Inventory Levels and Transportation Utilization; Upstream firms reported contraction for both metrics while their Downstream counterparts reported expansion and no change respectively. This corroborates anecdotal data that retailers are continuing to rebuild Inventory Levels (we saw a similar dynamic in April) while Upstream firms hold steady and continue to wind their stocks down due to a lack of demand. This contrast spills over to Transportation Utilization where Downstream firms appear to be slightly busier and are not seeing drops in Transportation Prices as dramatic as Upstream firms. Despite these differences, both Upstream and Downstream firms report contraction in the overall index, indicating that there is slowness in the logistics industry regardless of supply chain position.
| Inv. Lev. | Inv. Costs | WH Cap. | WH Util. | WH Price | Trans Cap | Trans Util. | Trans Price | LMI | |
| Upstream | 46.7 | 62.5 | 57.1 | 54.0 | 62.5 | 69.2 | 43.1 | 26.2 | 45.3 |
| Downstream | 54.4 | 67.6 | 55.9 | 56.1 | 62.1 | 69.4 | 50.0 | 31.1 | 48.2 |
| Delta | 7.7 | 5.1 | 1.3 | 2.1 | 0.4 | 0.2 | 6.9 | 4.9 | 2.9 |
| Significant? | No | No | No | No | No | No | No | No | No |
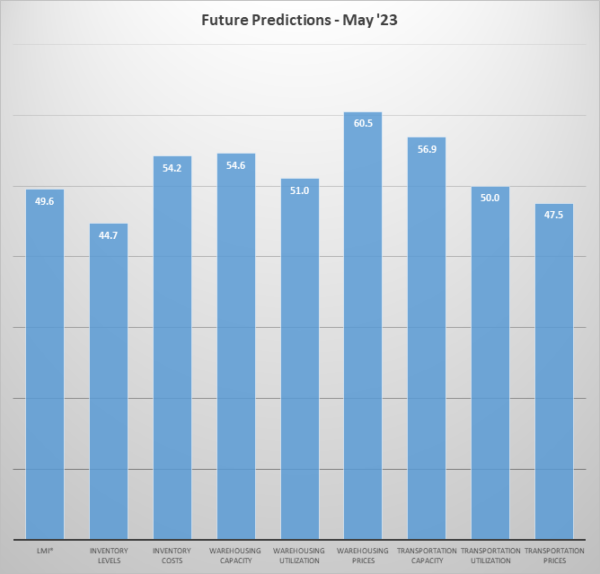
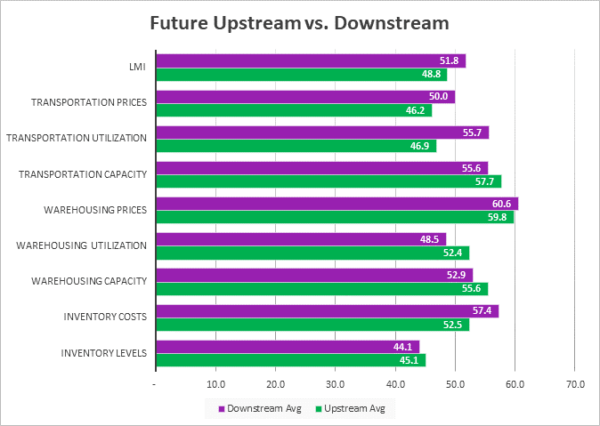
Respondents were asked to predict movement in the overall LMI and individual metrics 12 months from now. The future predictions for May continue the recent trend of respondents predicting relatively muted levels of growth across the logistics industry but see three metrics dip into contraction predictions for the first time since early on in COVID, including the overall index. Respondents are anticipating that Inventory Levels will contract over the next year, leading to a continuing slide in Transportation Prices and moderate scores for all other sub-metrics in the ‘s and 60’s. As discussed in last month’s report, the freight market seems likely to remain depressed until the program of interest rates slows down and more confident spending leads to volumes flowing more freely.
Much like what we observe with the current Upstream (green bars)/Downstream (purple bars) split, there are no significant differences reported by supply chain position this month. While there are no statistically significant differences, some patterns due emerge. Downstream firms reported mild growth or no change where their Upstream counterparts reported contraction for the overall index, Transportation Prices, and Transportation Utilization. This suggests that Downstream retailers are expecting a bit more activity for freight over the next 12 months. This dynamic is reversed for Warehousing Utilization, wherein it is the Upstream firms predicting a vision of growth contracting with expectations of contraction Downstream. Interestingly, both groups are anticipating that inventories will continue contracting over the next 12 months. Inventories are the root of all logistics activity, so i this prediction holds true it will hang a millstone around the neck of the industry.
| Futures | Inv. Lev. | Inv. Costs | WH Cap. | WH Util. | WH Price | Trans Cap. | Trans Util. | Trans Price | LMI |
| Upstream | 45.1 | 52.5 | 55.6 | 52.4 | 59.8 | 57.7 | 46.9 | 46.2 | 48.8 |
| Downstream | 44.1 | 57.4 | 52.9 | 48.5 | 60.6 | 55.6 | 55.7 | 50.0 | 51.8 |
| Delta | 1.0 | 4.9 | 2.6 | 3.9 | 0.8 | 2.1 | 8.8 | 3.8 | 3.0 |
| Significant? | No | No | No | No | No | No | No | No | No |
Historic Logistics Managers’ Index Scores
This period’s along with prior readings from the last two years of the LMI are presented table below:
| Month | LMI | Average for last 3 readings – 49.8
All-time Average – 63.7 High – 76.2 Low – 47.3 Std. Dev – 7.65
|
| May ‘23 | 47.3 | |
| Apr ‘23 | 50.9 | |
| Mar ‘23 | 51.1 | |
| Feb ‘23 | 54.7 | |
| Jan ‘23 | 57.6 | |
| Dec ‘22 | 54.6 | |
| Nov ‘22 | 53.6 | |
| Oct ‘22 | 57.5 | |
| Sep ‘22 | 61.4 | |
| Aug ‘22 | 59.7 | |
| July ‘22 | 60.7 | |
| June ‘22 | 65.0 | |
| May ‘22 | 67.1 | |
| Apr ‘22 | 69.7 | |
| Mar ‘22 | 76.2 | |
| Feb ‘22 | 75.2 | |
| Jan ‘22 | 71.9 | |
| Dec ‘21 | 70.1 | |
| Nov ‘21 | 73.4 | |
| Oct ‘21 | 72.6 | |
| Sep ‘21 | 72.2 | |
| Aug ‘21 | 73.8 | |
| July ‘21 | 74.5 | |
| June ‘21 | 75.0 | |
| May ‘21 | 71.3 |
LMI®
For the third consecutive month, the overall LMI has reached a new all-time low. For the first time however, we see a reading below 50.0 as the score of 47.3 puts the index firmly into contraction territory. This overall score is down (-3.6) from April’s reading of 50.9. It is also down 19.8-points from the reading of 67.1 that we recorded this time last year. This reduction was largely due to significant drops for all three transportation metrics as well as Inventory Levels moving from years of expansion to contraction. This contraction occurred for both Upstream and Downstream firms and was more pronounced in the second half of May than it was in the beginning of the month.
Respondents expect more of the same over the next 12 months, predicting a very moderate expansion (though bordering on no movement) of 49.6. This is down (-1.5) from April’s future prediction of rate of 51.1. The overall index had never contracted until this month, so if we do actually see contraction for the next year it would be a marked shift.
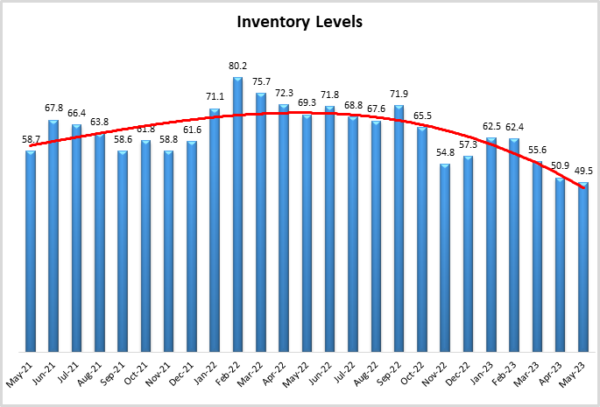
Inventory Levels
The Inventory Level value is 49.5, down (-1.4) but representing a move into slight contraction – the first contraction for this metric since February 2020. May’s reading is 19.8-points lower than the same time last year, and below the all-time average value for this metric of 62.1. If we compare the results from responses from the first half of the month against responses from the second half of the month, the first half of the month was 18.2 points higher, very similar to last month, when the first half was 20.7 points higher. This month, downstream respondents reported modest inventory growth, while upstream showed a similarly modest contraction (54.4 vs 46.7). Last month, downstream respondents reported modest inventory growth, while upstream showed a slight contraction (55.4 vs 49.3).
When asked to predict what conditions will be like 12 months from now, the average value is 44.7, indicating a more significant contraction in inventory levels, with a smaller value than the current index value of 49.5. Upstream returned 45.1, and downstream was very similar at 44.1. Last month, the prediction for next year was very close to the current index value, which means that on aggregate, respondents expect things to stay about where they were. The prediction for next year is 44.1, meaning respondents as a whole expect inventory to be lower next year. However, if traditional seasonality holds, we could see s inventories begin to tick upwards again late in the year.
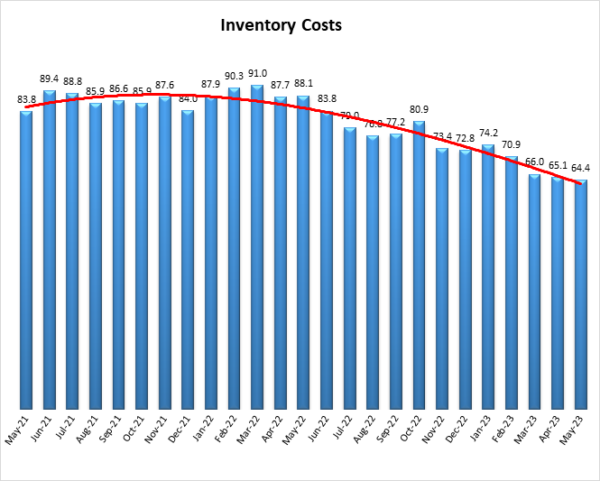
Inventory Costs
The current Inventory Costs index value reads in at 64.4, down (-0.7) from April’s reading of 65.1. This is down by 23.7 points from a year ago when Inventory Costs read in at 88.1. Over the last two years, the Inventory Cost numbers were consistently above the long-term average- of 74.5. However, as the graph shows, since reaching a peak in March of 2022, Inventory Cost values have had a strong, slow, downward trend. This month, earlier responses were 13.5 points higher than later responses and Downstream respondents reported higher inventory cost numbers (67.6 vs 62.5) – suggesting more activity is happening at the B2C than B2B level.
Above, we saw that respondents expect inventory levels to decrease slightly over the next 12 months, this is not the case for Inventory Costs which are predicted to expand at a rate of 54.2, down (-3.7) from April’s future prediction of 57.9. Upstream returned a value of 52.5, while Downstream respondents returned a value of 57.4. Either way, the average value of 54.2 is significantly lower than the current cost number of 64.4.
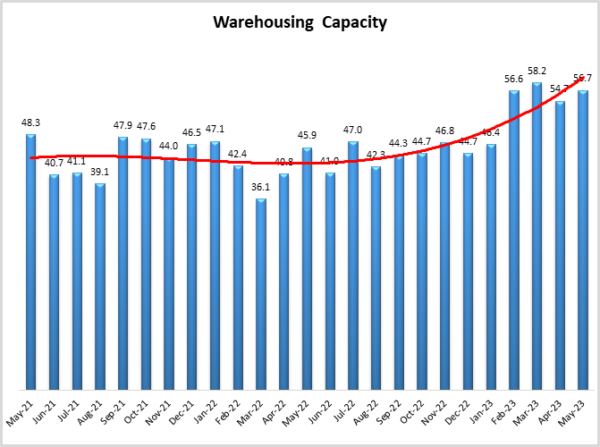
Warehousing Capacity
The Warehousing Capacity index reads in at 56.7, up (+2.0) from April’s reading of 54.7. This marks four consecutive months of expansion coming on the heels of 2.5 years of contraction. Much like last month, we saw Warehousing Capacity swing wildly during May as the metric registered in at 48.8 in early May and 62.5 in late May. This shift is likely due to the significant drop in inventory levels we saw over the same period of time. If this trend continues and there is no significant restocking at the end of the Summer, it is likely we will see Warehousing Prices begin to contract. While there is no statistically significant difference, we do see that Upstream respondents saw a faster rate of expansion than their Downstream counterparts (55.6 to 52.9) which is consistent with our inventory measures and provides further evidence that the B2B market is slower than B2C.
Looking forward at the next 12 months, respondents continue to expect available Warehousing Capacity to growth at a modest rate of 54.6, down (-2.4) from April’s future prediction of 57.0. We would expect the production of capacity to continue slowing as fewer leases are signed and some firms look to cut back on their warehousing footprint.
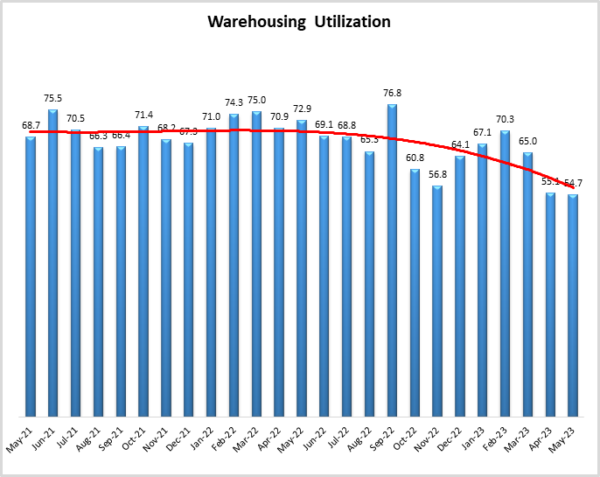
Warehousing Utilization
Warehousing Utilization reads in at 54.7 which is down slightly (-0.4) from April’s reading of 55.1. This is an 18.2-point decrease from the reading one year ago, and 14 points down from the reading two years ago. The difference between the upstream (54.0) vs. downstream (56.1) reading was not statistically significant, and while both of these measurements are above 50 and thereby indicate expansion, this represents the fourth month in a row where the rate of utilization seems to be slowing. This slowdown may indicate a decrease in demand for warehousing, despite capacity continuing to come online.
Looking forward at the next 12 months, the predicted Warehousing Utilization index is 51.0, down (2.8) from April’s future prediction of 53.8 and edging close to potential contraction territory. Downstream firms actually are expecting slight contraction (48.5) over the next 12 months, while their Upstream counterparts anticipate slight growth (52.4). If utilization were to eventually contract it would likely lead to a dip in prices – although that dip may take time to materialize given the length of many warehousing contracts.
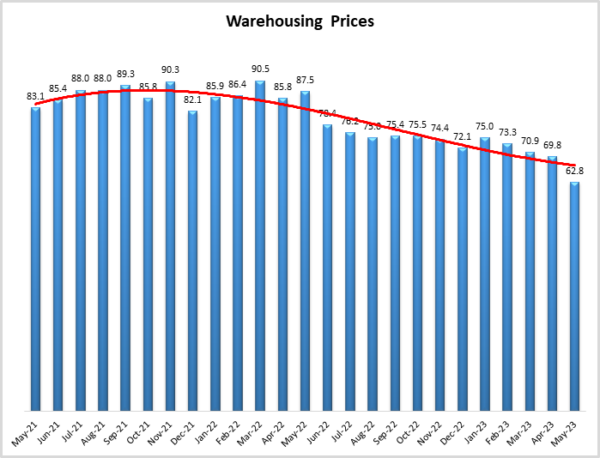
Warehousing Prices
The Warehousing Price index reads in at 62.8, down (-7.0) from April’s reading of 69.8. This is the second consecutive month that this metric reads in under 70.0, which it did last month for the first time since August of 2020. It will be interesting to observe whether this metric continues its current trajectory and dips down into the 50’s at any point. The only other time this metric has been in the 50’s was during the height of lockdowns in April of 2020.
Future predictions suggest prices growth will continue to slow down as respondents are expecting prices to continue to grow at a rate of 60.5, down slightly (-1.4) from April’s future prediction of 61.9. While this is still indicative of growth, the expected slowdown suggests that enough Warehousing Capacity will come online in 2023 to finally provide some relief to firms and consumers.
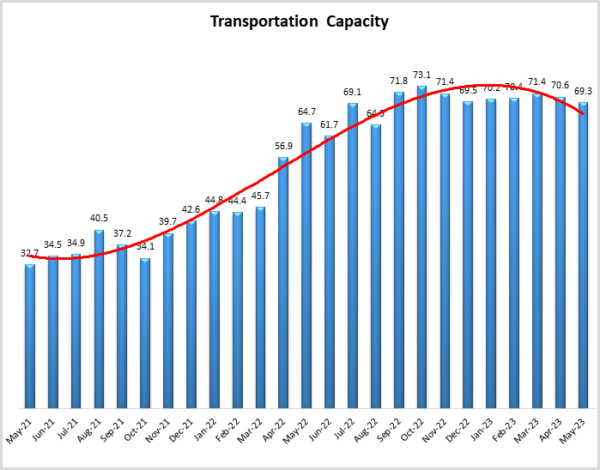
Transportation Capacity
The Transportation Capacity Index registered 69.3 in May 2023. This constitutes a small decrease of 1.3 points from the April reading of 70.6 and marks the first time it has been out of the significant expansion territory of 70.0 since December of 2022. Despite this second consecutive drop, the Transportation Capacity Index continues to remain elevated and near all-time highs. There is no significant difference between the Upstream Transportation Capacity index (69.2) and the Downstream index (69.4).
The future Transportation Capacity index indicates 56.9 corresponding to a drop of 5.7 points from the previous reading. The Downstream future Transportation Capacity index is at 55.6 while the Upstream future Transportation Capacity index is at 57.7, indicating that across the supply chain capacity is expected to increase at a much more moderate rate than what we’re seeing now. This might offer a glimmer of hope that fleets will begin to right-size again over the coming year.
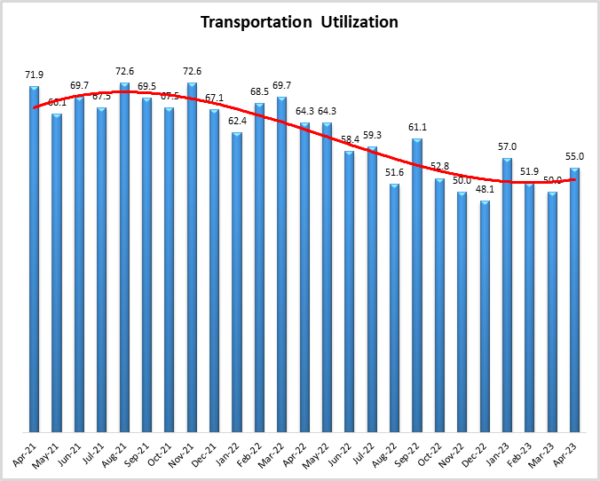
Transportation Utilization
The Transportation Utilization Index registered 45.5 in May 2023. This denotes a sharp drop of 9.5 points from the previous level, pulling the index into contraction territory. This drop was not universal as the Downstream Transportation Utilization Index is at 50 – or no movement, while the Upstream index moved firmly into contraction at 43.1. This is 18.8-points down from a year ago. It will be interesting to continue observing this metric and whether or not it moves further into contraction or bounces back up over time.
The future Transportation Utilization Index suggests that utilization may not move much, reading in at 50.0 which is down (-7.9) from April’s future prediction of 57.9. Once again, this number is buoyed by Downstream respondents as they predict expansion at 55.7, the Upstream Transportation Utilization index indicates contraction at 46.9.
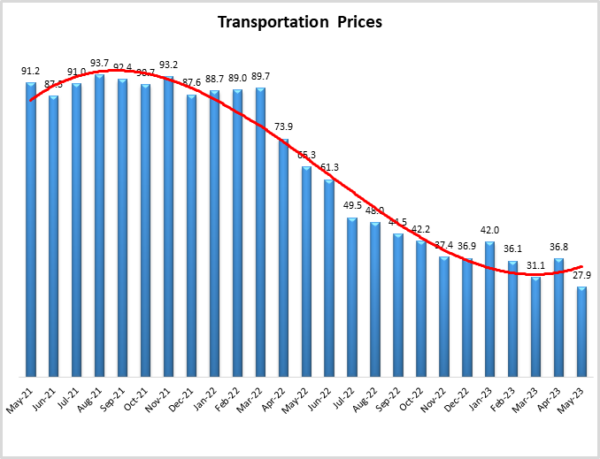
Transportation Prices
The Transportation Prices Index indicates a sharp decrease of 8.9 points this month, down from April’s reading of 36.9 and moving to an all-time low of 27.9 in May 2023. This is 37.4-points down from a year ago and a staggering 63.3-points lower than May 2021. No LMI metric is more reactive to movements in the macro economy than Transportation Prices, and the slowdown we’ve seen over the last two years is certainly reflective of the ongoing freight recession that was always going to be difficult to avoid after the runaway growth of 2020-20221. The Upstream Transportation Price index is lower at 26.2, while the Downstream is slightly higher but still in significant contraction territory (31.1).
The future index for Transportation Prices remains in contraction territory at 47.5, down slightly (-0.6) from April’s future prediction of 48.1. B2C respondents continue to be slightly more optimistic than B2B firms as the future Downstream Transportation Prices index is at 50 – or no movement while the Upstream Transportation Prices index is at 46.2 which indicates slight contraction. Either way however, respondents across the supply chain predict a much steadier pricing market than what we’re currently seeing, corroborating the hopes of potential rightsizing that we saw with the future Transportation Capacity predictions.
About This Report
The data presented herein are obtained from a survey of logistics supply executives based on information they have collected within their respective organizations. LMI® makes no representation, other than that stated within this release, regarding the individual company data collection procedures. The data should be compared to all other economic data sources when used in decision-making.
Data and Method of Presentation
Data for the Logistics Manager’s Index is collected in a monthly survey of leading logistics professionals. The respondents are CSCMP members working at the director-level or above. Upper-level managers are preferable as they are more likely to have macro-level information on trends in Inventory, Warehousing and Transportation trends within their firm. Data is also collected from subscribers to both DC Velocity and Supply Chain Quarterly as well. Respondents hail from firms working on all six continents, with the majority of them working at firms with annual revenues over a billion dollars. The industries represented in this respondent pool include, but are not limited to: Apparel, Automotive, Consumer Goods, Electronics, Food & Drug, Home Furnishings, Logistics, Shipping & Transportation, and Warehousing.
Respondents are asked to identify the monthly change across each of the eight metrics collected in this survey (Inventory Levels, Inventory Costs, Warehousing Capacity, Warehousing Utilization, Warehousing Prices, Transportation Capacity, Transportation Utilization, and Transportation Prices). In addition, they also forecast future trends for each metric ranging over the next 12 months. The raw data is then analyzed using a diffusion index. Diffusion Indexes measure how widely something is diffused or spread across a group. The Bureau of Labor Statistics has been using a diffusion index for the Current Employment Statics program since 1974, and the Institute for Supply Management (ISM) has been using a diffusion index to compute the Purchasing Managers Index since 1948. The ISM Index of New Orders is considered a Leading Economic Indicator.
We compute the Diffusion Index as follows:
PD = Percentage of respondents saying the category is Declining,
PU = Percentage of respondents saying the category is Unchanged,
PI = Percentage of respondents saying the category is Increasing,
Diffusion Index = 0.0 * PD + 0.5 * PU + 1.0 * PI
For example, if 25 say the category is declining, 38 say it is unchanged, and 37 say it is increasing, we would calculate an index value of 0*0.25 + 0.5*0.38 + 1.0*0.37 = 0 + 0.19 + 0.37 = 0.56, and the index is increasing overall. For an index value above 0.5 indicates the category is increasing, a value below 0.5 indicates it is decreasing, and a value of 0.5 means the category is unchanged. When a full year’s worth of data has been collected, adjustments will be made for seasonal factors as well.


