- LMI® at 67.1
- Growth is INCREASING AT AN INCREASING RATE for: Inventory Costs, Warehousing Utilization, Warehousing Prices, Transportation Capacity, and Transportation Utilization.
- Growth is INCREASING AT A DECREASING RATE for: Inventory Levels and Transportation Prices
- Warehousing Capacity is CONTRACTING.
The Logistics Managers’ Index reads in at 67.1- in May, as the logistics industry continues its regression towards the mean after nearly two years of rapid growth. The reading of 67.1 is slightly above the all-time average of 65.3 for the overall index, but down considerably (-9.1) from March’s all-time high reading of 76.2. The downward shift in the index continues to be driven by a loosening in the transportation market, as more capacity comes online (+7.8), and prices decrease (-8.7). Despite this slowdown, it should be noted that we are still observing a healthy rate of growth in transportation, but one that pales in comparison to the unsustainable growth rates observed in 2021. Warehousing and Inventory continue to grow at a similar pace to the one we have observed over the last 18 months. Inventory Levels are unseasonably high, packing warehouses to the gills and driving costs up for both inventory and warehousing.
Researchers at Arizona State University, Colorado State University, Rochester Institute of Technology, Rutgers University, and the University of Nevada, Reno, and in conjunction with the Council of Supply Chain Management Professionals (CSCMP) issued this report today.
Results Overview
The LMI score is a combination of eight unique components that make up the logistics industry, including inventory levels and costs, warehousing capacity, utilization, and prices, and transportation capacity, utilization, and prices. The LMI is calculated using a diffusion index, in which any reading above 50 percent indicates that logistics is expanding; a reading below 50 percent is indicative of a shrinking logistics industry. The latest results of the LMI summarize the responses of supply chain professionals collected in May 2022. Overall, the LMI is down (-2.6) from April’s reading of 69.3. The slowdown in the rate of expansion is the product of moderation in the transportation market. On the whole, however, the logistics industry continues to expand, driven primarily by strong growth in the inventory and warehousing metrics all-time high reading of 75.2. The dip is fueled by the first expansion of Transportation Capacity in nearly two years and a subsequent dip in the rate of growth for Transportation Prices. Inventory and Warehousing metrics remain are down slightly but still show high rates of growth as supply chains continue struggling to find the capacity needed to deal with high levels of inventory.
The mixed nature of our different logistics components epitomizes the nuances in the overall economy. Revised estimates now suggest that the US economy contracted at a rate of 1.5% (down from the previous estimate of 1.4%) in the first quarter of 2022. Despite the contraction, consumer spending remains strong, and a report released by the Congressional Budget Office in mid-May estimated that GDP will grow by 3.1% in 2022[1]. Some of this softness can be tied to issues abroad. For instance, the China PMI for May was 49.6, up from April’s 47.4 but still indicating slight contraction. China’s economy has contracted for three straight months due to lockdowns. Shanghai’s phased relief from COVID began on June 1st. As a result of this, only 11% of orders from Asia to North America arrived on time in May, down from 18% in May 2021 and from 59% in May 2020. This slowness has led to firms like Walmart, and Eastman Kodak significantly increasing their inventory levels. Some firms are dealing with this by moving in the other direction; Under Armour has cancelled approximately $200 million of orders, due to the unreliability of ocean shipping[2]. If the lockdowns do truly ease through the early Summer, China will likely move back into a state of growth, as the government increases new infrastructure spending the jumpstart the economy[3]. Conversely, the U.S. PMI came in at 56.1, up from the two-year lows of April and March and marking 24 consecutive months of growth. As is often the case, much of the strength of the U.S. economy can be attributed to the consumer. The NRF notes that consumer spending is up 3.1% year-over-year, and business investment is up 9.2%, predicting that the rate of overall economic expansion will slow, but that the US is unlikely to slip into contraction[4]. These mixed signals suggest an economy that is still growing steadily, but at a lower rate than the historic pace we observed in 2021, very similar to the picture painted by the logistics industry in May.
The fluctuations in the economy were reflected in the latest job report, which was particularly revealing when it comes to the logistics industry. An estimated 390,000 jobs were added in the US in May. Interestingly, retailers lost 61,000 jobs but leisure and hospitality were up 84,000 as the economy continues to shift back towards a heavier mix of services. While this is fewer jobs than were added in April, 1.2 million jobs have been added over the last three months[5] – which is important as this is the period that came after the Russian invasion of Ukraine and the issues that caused. trucking, warehousing, and parcel delivery added 32,900 jobs over the same period, down slightly from 44,700 in April. Trucking companies alone accounted for 13,300 jobs, with total employment up by over 70,000 in the past year. Some of this movement is likely from owner-operators signing on with larger firms that are less vulnerable to diesel costs and slides in the spot market. Warehousing and storage firms added 17,700 in May for a total of 176,700 new positions through the first five months of 2022[6]. Other than the dip of 2,700 positions in March, the transportation sector has added jobs every month since April 2020. Prior to this year, only three months since 2012 saw job gains over 10,000 – a number that has been doubled this year as three of the last four months saw gains of at least 10,000 jobs[7].
| Sector | May ’22 Change in Jobs |
| Retail | -61,000 |
| Leisure & Hospitality | +84,000 |
| Trucking | +13,300 |
| Warehousing & Storage | +17,700 |
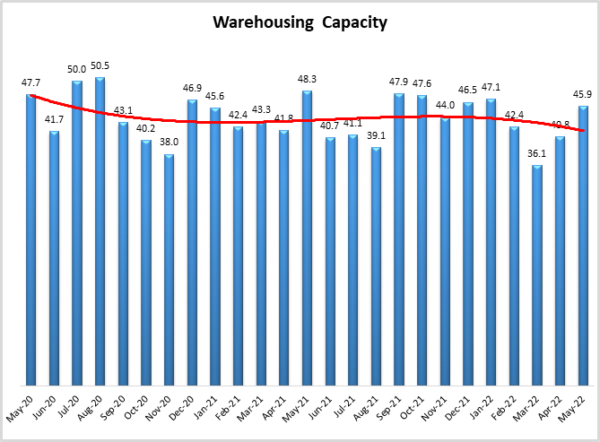
The warehousing sector may have had the capacity to add more jobs, but due to the ongoing labor shortage, North American firms across multiple industries spent $646 million on 11,595 robots through the first quarter of 2022. This expansion comes after an already significant 44.6% increase in 2021. Analysts predict a continued 20-30% growth of coworking robots, or “cobots”, through 2026[8]. Warehousing Capacity was up (+5.0) to 45.9, extending a streak of 21 consecutive months of contraction. The consequences of the lack of warehousing capacity ripple outward throughout supply chains. Despite approximately 8 million shipping containers being added to global inventories since the start of the pandemic (resulting in a total of 50.5 million), they continue to be a chokepoint as they sit on docks due to a shortage in available space[9]. Containers are sitting for an average of six days to be picked up by rail, during normal conditions this should only be two days. The Ports of Los Angeles and Long Beach report that there are now 37,500 containers of aging cargo sitting on their docks, this is down from 95,000 in late October just before they began penalizing aging cargo[10].
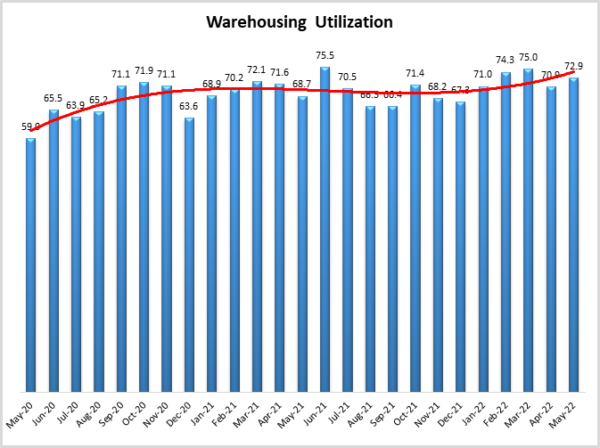
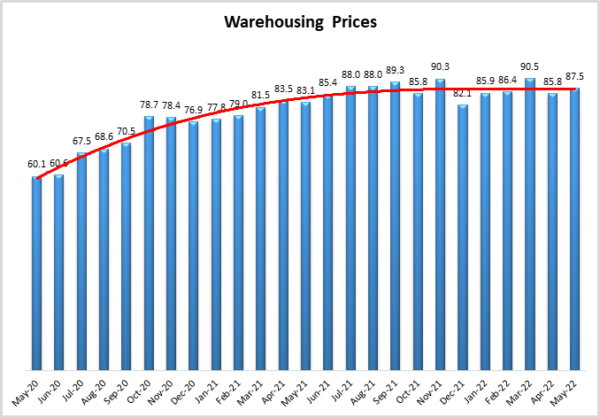
Interestingly, we do see some relief breaking through in late May. From May 1-16, Warehousing Capacity continued contracting at a rate of 38.1; but from May 17-31, it actually crossed over into a state of very mild expansion at a rate of 50.7. If this loosening in Warehousing Capacity continues into June, it would mark the first increase in available capacity since August of 2020. Some of the increase in capacity could be stemming from Amazon opening up 10 million square feet of warehousing space for lease as they work to right-size their network following the aggressive expansion of the last two years. Despite Amazon’s temporary pause, the industrial real estate sector remains hot as firms that may have been boxed out by Amazon and other large retailers now find an opportunity to acquire space of their own[11]. For instance, the same month Amazon signaled its slowdown Walmart announced the construction of four “next-generation” eCommerce fulfillment centers built with proprietary automation. These centers will potentially provide next-or two-day shipping to 75% of the U.S.[12]. Even with the potential increase in capacity Warehousing Utilization (+2.0 to 72.9) and Warehousing Prices (+1.7 to 87.5) were both up in May. Warehousing Prices have now been above 80.0 for Warehousing Utilization for 15 consecutive months. Warehousing Utilization has read in over 70.0 every month in 2022, likely a reflection of the high levels of inventory currently in the system.
The rate of growth for Inventory Levels was down (-3.0) to 69.3. This is the metric’s first reading in the 60s in 2022 but is still well above the all-time average of 62.2 for this metric. The elevated inventory levels are leading some large firms like Walmart and Costco (who reported a 26% increase in inventory in their most recent quarter, to consider discounting unsold goods to make way for the wave of imports that usually arrives during the second half of the year[13]. That being said, imports could deviate from their traditional seasonal patterns in 2022. The slowdown at Shanghai ports has given carriers and ports around the world a chance to work through their backlog. This has also made shipping much cheaper. The cost of a 40-foot container from Shanghai to Long Beach was $7,400 in April, down significantly from the $13,000 it cost in January. This may change soon though as the lockdowns in Shanghai ease in late May and early June[14]. Transpacific sailings have begun to pick up[15], but given the upstream impact of China’s shutdowns, it is unlikely we will an immediate wave of imports coming in, as the perpetual motion machine that is multi-tier global manufacturing may need some time to get back to optimal output levels. Complicating this is the fact that negotiations between west coast dockworkers and cargo-handling companies began in mid-May. The International Longshore and Warehouse Union represent 22,400 workers across 29 ports. Significant cargo delays came during the two most recent negotiations in 2002 and 2014 and might happen again if a deal is not reached before the current contract expires on July 1, 2022[16]. It is unlikely that east coast ports will be able to absorb much more volume. The Ports of Savannah, Charleston, and New York/New Jersey are currently backed up. Q1 imports into New York/New Jersey were up 12% year-over-year. Similar to what we see in other places, New York/New Jersey is saddled with twice the number of empty containers waiting to be shipped out of the U.S., significantly slowing operations[17]. Despite these delayed sailings, Inventory Costs remain elevated (+0.4) to 88.1. Interestingly, the costs are significantly higher for Upstream firms (+7.9) at a rate of 90.7 to 82.9. This is likely reflective of both the continued congestion in supply chains as firms struggle to get goods downstream, as well as the high volume of late-arriving holiday/winter goods that some firms are hoteling until they can be sold again in Q3/Q4.
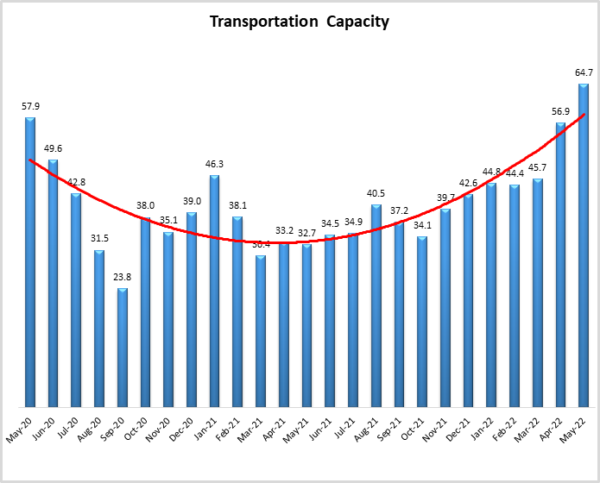
Fortunately, in a world of bottlenecks, transportation seems to be opening back up. Transportation Capacity continues to increase (+7.8), expanding at a rate of 64.7 – the fastest rate of expansion since October 2019. The rate of change for Transportation Capacity is up 20.3 points from February, which is the month the Russian invasion of Ukraine shifted the direction of fuel prices. This is reflected in tender rejection rates, which sat at 8.62% in the last week of May, down from 2021 but up from the same time in 2020[18]. The impact of newly available capacity is also seen in truck orders. Only 13,300 class 8 trucks were ordered in May, which is down 43% from the same time last year, likely reflecting the long lead time on production[19]. Truck tonnage was down 2% in April, but year-to-date totals are still up from 2021[20], and Transportation Utilization read in at 64.3 – identical to the level of utilization expansion we observed in April. Transportation Prices continued growing but at a notably slower (-8.7) rate of 65.3. We have speculated whether or not Transportation Prices will slide into contraction or stabilize at some new normal. The drop in price in 2022 is due to higher prices of diesel and an increase in capacity driving shippers away from the spot market and towards the (for now) more expensive contract market. Interestingly, the spot market has stabilized in recent weeks[21], and diesel averaged $5.54 per gallon during the last week of May, which is down slightly from the all-time high of $5.62 per gallon reached the week of May 9th. (although it is obviously still well above the average of $3.64 per gallon in December)[22]. It is still impossible to say for sure whether Transportation Prices will continue to dip or will stabilize soon, but we can say that some of the related factors have begun to stabilize.
Another hint of stabilization comes in the significant differences we observe between what was reported from May 1st-16th (gold bars) relative to May 17th-31st (green bars). In an inversion of what we saw in March where logistics activity trailed off in the second half of the month, we observe upward movement in transportation and warehousing metrics in the back half of May. We read a significant upward movement in both Warehousing Utilization and Warehouse Capacity. The latter is particularly interesting as it marks the first time in nearly two years that we have observed anything except contraction for the Warehousing Capacity Metric. Some of the increase in capacity could be stemming from Amazon opening up 10 million square feet of warehousing space for lease as they work to right-size their network following the aggressive expansion of the last two years. Despite Amazon’s temporary pause, the industrial real estate sector remains hot as firms that may have been boxed out by Amazon and other large retailers now find an opportunity to acquire space of their own[23]. The most notable movement is Transportation Price, which bumped up 16.1 points from a marginal growth rate of 55.4 to a much more robust 71.5. While there is often some seasonal contraction in capacity around Memorial Day, the size of the change suggests there could be more underlying the change. It will be important to continue observing transportation in the coming months to understand if the spike in prices and dip in capacity in late May are indicative of the freight market leveling off, or are just a reprieve in an ongoing dip.
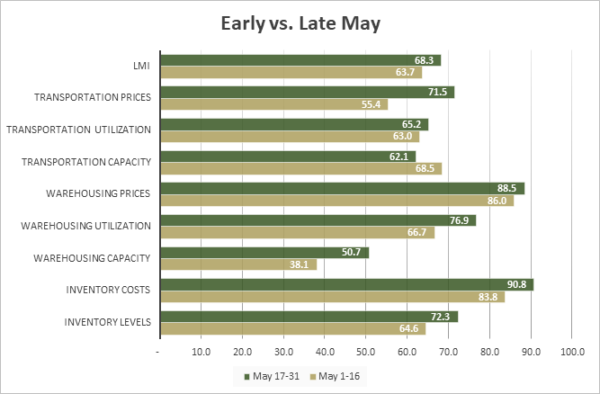
| Inv. Lev. | Inv. Costs | WH Cap. | WH Util. | WH Price | Trans Cap | Trans Util. | Trans Price | LMI | |
| Upstream | 64.6 | 83.8 | 38.1 | 66.7 | 86.0 | 68.5 | 63.0 | 55.4 | 63.7 |
| Downstream | 72.3 | 90.8 | 50.7 | 76.9 | 88.5 | 62.1 | 65.2 | 71.5 | 68.3 |
| Delta | 7.7 | 7.0 | 12.7 | 10.2 | 2.4 | -6.3 | 2.2 | 16.1 | 4.6 |
| Significant? | No | Marginal | Yes | Yes | No | No | No | Yes | Marginal |
The index scores for each of the eight components of the Logistics Managers’ Index, as well as the overall index score, are presented in the table below. Seven of the eight metrics show signs of growth. Warehousing Capacity continues contracting for the 22nd consecutive month (although it did come in just over 50.0 during the second half of May). For the moment, supply chains are flush with inventory which is keeping inventory and warehousing metrics high, while transportation continues to rebalance.
| LOGISTICS AT A GLANCE | |||||
| Index | May 2022 Index | April 2022 Index | Month-Over-Month Change | Projected Direction | Rate of Change |
| LMI® | 67.1 | 69.7 | -2.5 | Growing | Slower |
| Inventory Levels | 69.3 | 72.3 | -3.0 | Growing | Slower |
| Inventory Costs | 88.1 | 87.7 | 0.4 | Growing | Faster |
| Warehousing Capacity | 45.9 | 40.8 | 5.0 | Contracting | Slower |
| Warehousing Utilization | 72.9 | 70.9 | 2.0 | Growing | Faster |
| Warehousing Prices | 87.5 | 85.8 | 1.7 | Growing | Faster |
| Transportation Capacity | 64.7 | 56.9 | 7.8 | Growing | Faster |
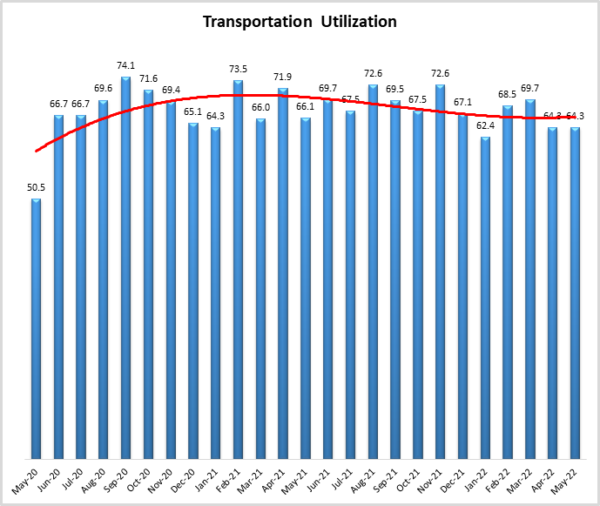
| Transportation Utilization | 64.3 | 64.3 | 0.0 | Growing | No Change |
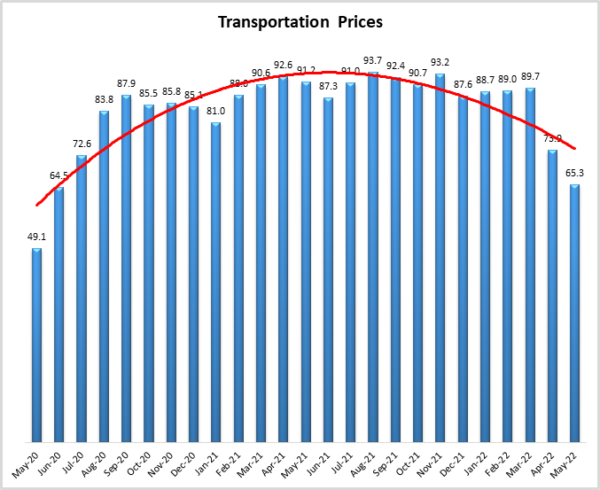
| Transportation Prices | 65.3 | 73.9 | -8.7 | Growing | Slower |
This month, both upstream (blue bars) and downstream (orange bars) firms reported considerable rates of continued growth in the utilization of logistics services. The only significant difference in May was in the rate of change for inventory costs. As we speculated in April, prices may be higher on the upstream side because there is no longer room downstream to transfer goods, and so stockpiles are building up – stockpiles that are being held in increasingly expensive (e.g. temporarily leased) space.
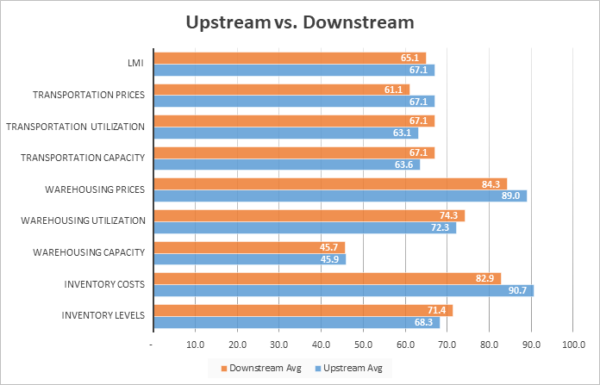
| Inv. Lev. | Inv. Costs | WH Cap. | WH Util. | WH Price | Trans Cap | Trans Util. | Trans Price | LMI | |
| Upstream | 68.3 | 90.7 | 45.9 | 72.3 | 89.0 | 63.6 | 63.1 | 67.1 | 67.1 |
| Downstream | 71.4 | 82.9 | 45.7 | 74.3 | 84.3 | 67.1 | 67.1 | 61.1 | 65.1 |
| Delta | 3.1 | 7.9 | 0.2 | 2.0 | 4.8 | 3.6 | 4.0 | 6.0 | 2.0 |
| Significant? | No | Yes | No | No | No | No | No | No | Marginal |
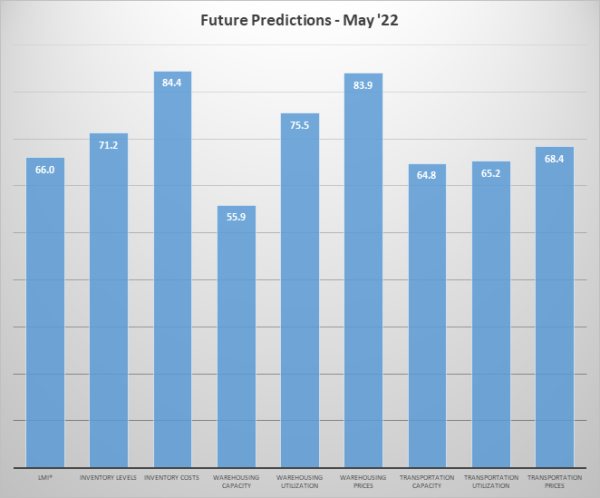
Respondents were asked to predict movement in the overall LMI and individual metrics 12 months from now. Their predictions for future ratings are presented below. Respondents predict that Inventory Levels and Costs will continue to rise over the next year, continuing to be particularly bullish on Inventory Costs, anticipating a growth rate of 84.4. As would be expected, the high predictions for inventories lead to a robust forecast for Warehousing Prices and Utilization. Interestingly, respondents due predict a modest increase in Warehousing Capacity, suggesting that the bump we observed in the latter half of May could point to a coming trend. Finally, respondents continue to predict more modest growth across all three transportation metrics, as we move away from the chaotic growth of the last two years and toward a more balanced market.
The exact nature of the future predictions varies by supply chain position. This month we see that most clearly in the predictions for future Inventory Costs, and Warehousing Prices both of which displayed significant differences in April as well.
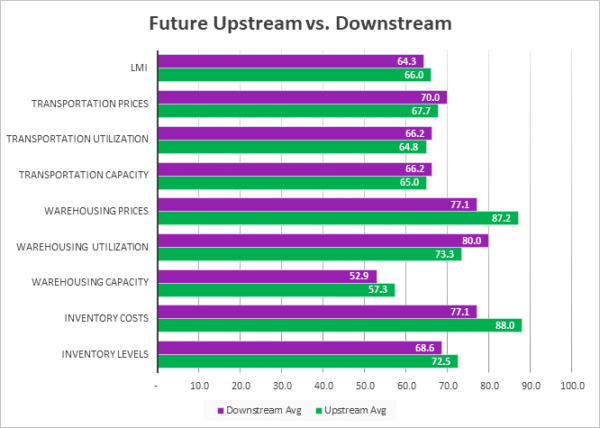
In May Upstream firms anticipated higher Inventory Costs and Warehousing Prices over the next 12. Firms across the spectrum are attempting to work through excess inventories, with the majority of those goods being stuck upstream and stored in expensive, temporarily leased facilities. It will be interesting to continue monitoring these differences to determine whether the cost disparity between upstream and downstream firms continues through the rest of the year.
| Futures | Inv. Lev. | Inv. Costs | WH Cap. | WH Util. | WH Price | Trans Cap. | Trans Util. | Trans Price | LMI |
| Upstream | 72.5 | 88.0 | 57.3 | 73.3 | 87.2 | 65.0 | 64.8 | 67.7 | 66.0 |
| Downstream | 68.6 | 77.1 | 52.9 | 80.0 | 77.1 | 66.2 | 66.2 | 70.0 | 64.3 |
| Delta | 4.0 | 10.9 | 4.5 | 6.7 | 10.0 | 1.2 | 1.4 | 2.3 | 1.7 |
| Significant? | No | Yes | No | No | Yes | No | No | No | No |
Historic Logistics Managers’ Index Scores
This period along with prior readings from the last two years of the LMI is presented table below. The values have been updated to reflect the method for calculating the overall LMI:
| Month | LMI | Average for last 3 readings – 71.0
All-time Average – 65.3 High – 76.5 Low – 51.3 Std. Dev – 7.17
|
| May ‘22 | 67.1 | |
| Apr ‘22 | 69.7 | |
| Mar ‘22 | 76.2 | |
| Feb ‘22 | 75.2 | |
| Jan ‘22 | 71.9 | |
| Dec ‘21 | 70.1 | |
| Nov ‘21 | 73.4 | |
| Oct ‘21 | 72.6 | |
| Sep ‘21 | 72.2 | |
| Aug ‘21 | 73.8 | |
| July ‘21 | 74.5 | |
| June ‘21 | 75.0 | |
| May ‘21 | 71.3 | |
| Apr ‘21 | 74.5 | |
| Mar ‘21 | 72.2 | |
| Feb ‘21 | 71.4 | |
| Jan ‘21 | 67.2 | |
| Dec ‘20 | 66.7 | |
| Nov ‘20 | 70.8 | |
| Oct ‘20 | 71.6 | |
| Sep ‘20 | 70.5 | |
| Aug ‘20 | 66.0 | |
| July ‘20 | 63.0 | |
| June ‘20 | 61.7 | |
| May ‘20 | 54.5 |
LMI®
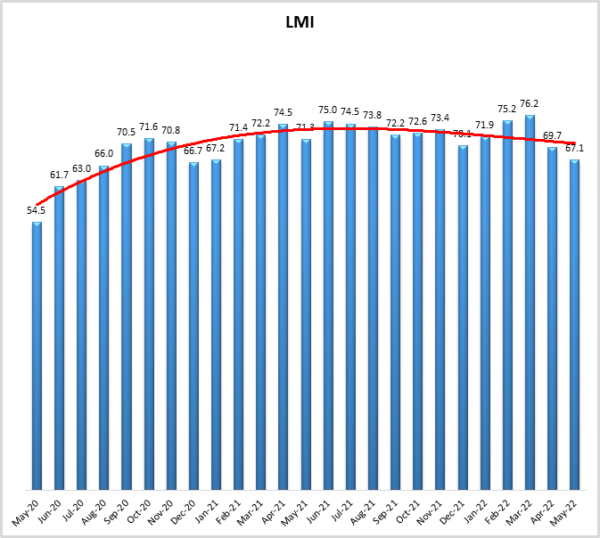
The overall LMI reads in at 67.1 in May, down (-2.6) from April’s reading of 69.7 and (-7.1) from March’s all-time high reading of 76.2. While this is the lowest reading of the overall index since December 2020, it is still above the all-time average of 65.3. The slowing rate of growth can be contributed to a softening in the transportation market. However, high inventories and a continued lack of sufficient warehousing space are keeping the overall index at a clear rate of expansion.
Respondents expect a steady rate of expansion over the next year, and anticipate a growth rate of 66.0, down slightly (-1.8) from April’s future prediction of 67.8. Much of this will depend on whether the transportation market continues to dip or (as the number are currently suggesting) stabilizes at a new steady state.
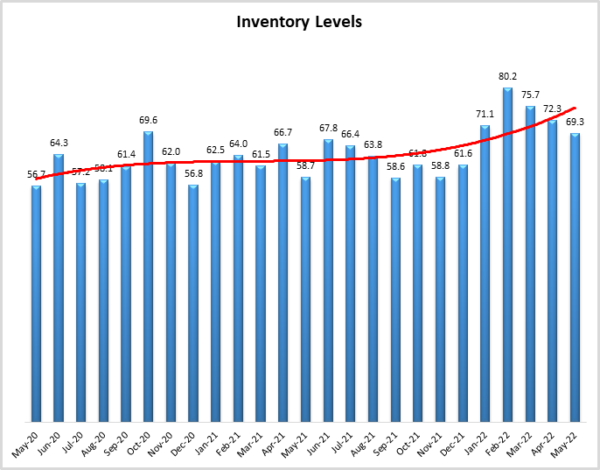
Inventory Levels
The Inventory Level value is 69.3, down (-3.0) from April and (-10.9) from February’s all-time high of 80.2. The current value is 10.6 higher than the same time last year and 12.6 points higher than two years ago. This means that seasonally speaking, inventories continue to increase more quickly than we would normally expect at this point of the year. downstream respondents reported greater inventory growth by 3.1 pts, (71.4 vs 68.3). Inventories often begin to build in June in anticipation of back-to-school and holiday shopping. It will be interesting to observe what happens this summer with inventories already at an elevated level.
When asked to predict what conditions will be like 12 months from now, the average value is 71.2, down slightly (-1.6) from April’s future prediction of 72.8. Upstream respondents are expecting higher increases in inventory than downstream (72.5 vs 68.6). The average is almost the same as the current inventory index value of 69.3, meaning expected inventory growth rates over the next year are very close to the current rate of change.
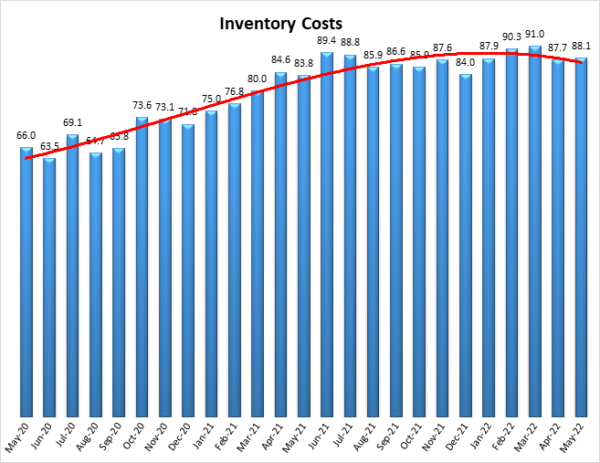
Inventory Costs
When asked to predict what conditions will be like 12 months from now, the average value is 71.2, down slightly (-1.6) from April’s future prediction of 72.8. Upstream respondents are expecting higher increases in inventory than downstream (72.5 vs 68.6). The average is almost the same as the current inventory index value of 69.3, meaning expected inventory growth rates over the next year are very close to the current rate of change. The current Inventory Costs index value is nearly unchanged. The value of 88.1 is a slight increase (+0.4) from April’s reading of 87.7. The value is up 4.3 points from the value last year, and up 22.1 points compared to two years ago. For the past year, Inventory Cost numbers have been much higher than previously. The shift is that in 2021 costs were high due to the velocity at which goods were moving, in 2022, the costs are due more to the static buildup of goods.
When asked to predict what conditions will be like 12 months from now, the average value is 84.4, down slightly (-2.2) from April’s reading of 86.6., very consistent (+0.1) from March’s future prediction of 86.5. In a continuation of March and April, Upstream respondents are more bullish on future cost growth, coming in 10.9 points higher (88.0 vs. 77.1) than their downstream counterparts.
Warehousing Capacity
The reading for May 2022’s warehousing capacity comes in at 45.9, reflecting a 5.1 point upward shift from the month prior, reflecting a three-month increased trend (though still in the contractionary territory). This reading is also quite close to the reading from May 2021 of 48.3, though is down 1.8 points from the reading two years ago (47.7). While the reading still indicates contraction in the market, the pressure seems to be slightly easing as respondents actually reported slight growth during the second half of May. This reading also may indicate that new capacity has come online in response to the increasing demand over the past several months/years, as utilization and pricing are also up. Previous reports suggested that “The respite, though only mildly attenuated this month, could be necessary for increased capacity to come online to prepare for this potentially increased demand” which, if continued may be the case. There are global factors, however, that may render this increased capacity insufficient (i.e. China and the War in Ukraine). Future readings will tell.
Looking forward to the next 12 months, respondents have shifted towards expecting some (albeit moderate) level of growth in Warehousing Capacity. The predicted Warehousing Capacity index is 55.9 in May, up (+6.6) from April’s future prediction of 49.3. Respondents have become cautiously optimistic that the additional space needed to meet demand will begin to come online.
Warehousing Utilization
The warehousing utilization reading came in at 72.9 for May 2022, which reflects a two-point increase from the month prior and a modest 4.2-point increase from the reading one year prior, though it is up nearly 14 points from May of 2020. The increased utilization, particularly in light of the increased capacity numbers is noteworthy. First, that the rate at which utilization is increasing is growing, amidst a modestly loosening capacity in this space, confirms that demand in this space will persist and grow, particularly as global commerce resumes in China. In addition, while the War in Ukraine has forced pricing to increase on fuel and other areas, consumer demand remains high, and global supply chains continue to be put under increased demand pressure. Finally, utilization is seemingly invariant (or at least mildly so) to price increases in this space, as the demand for it persists routinely.
Looking forward to the next 12 months, the predicted Warehousing Utilization index is 75.5, up (+2.4) from April’s future prediction of 73.1. Respondents continue to expect to utilize increasingly greater amounts of available warehouse space throughout the year as supply struggles to keep up with demand.
Warehousing Prices
Warehousing prices registered at 87.5 for the month of May, reflecting a 1.7-point upward shift from the month prior, and is up 4.4 points from the reading one year ago. This reading, however, is up over 27.5 points from the reading two years ago. The repartee between capacity, pricing, and utilization continues to be a dynamic one, as this month both utilization and pricing are up (which is consistent with the notion that as demand picks up, so too will pricing, assuming that supply is fixed). Yet, there was evidence of easing in the capacity space, all the while pricing continues to increase. This pernicious increase in pricing seems to contradict the notion that several firms have too much warehousing. China is also opening up to global trade, though rather modestly. In line with previous predictions of this report “If the volume of shipments from China increases considerably in the coming months, this may put pressure on demand for warehousing, and increase the rate at which the utilization is growing in addition to its prices (of other readings of the LMI, in addition to warehousing as well)”. Is this the case? The summer will be fruitful ground to analyze this question.
Future predictions suggest that respondents are expecting prices to continue to grow at a rate of 83.9, down (-2.8) from April’s future prediction of 86.7. All respondents expect increasing prices, but Upstream firms predict significantly higher growth than their Downstream counterparts at a rate of 87.2 to 77.1.
Transportation Capacity
The Transportation Capacity Index registered 64.7 percent in May 2022. This constitutes a jump of 7.8 percentage points from the April reading of 56.9. This increase continues the recent upward trend and keeps transportation capacity solidly above 50.0, indicating expansion. The Transportation Capacity expansion can be observed across the supply chain, with the Upstream index indicating 63.3 and the Downstream index indicating 67.1.
The future Transportation Capacity Index also indicates expansion, registering 64.8. Upstream firms have a future transportation capacity index of 65.0 while downstream firms indicate a future expectation of 66.2. Overall, it can be said that the capacity increase trend is widespread across the supply chain and is expected to continue over the next 12 months.
Transportation Utilization
The Transportation Utilization Index did not change from the previous month, registering 64.3 percent in May 2022. The downstream Transportation Utilization Index is at 67.1, while the upstream index is at 63.1. As such, the transportation utilization index remains elevated and continues to indicate expansion across the supply chain, both upstream and downstream.
The future Transportation Utilization Index indicates continuing expectations of expansion, at a 65.2 level for the next 12 months. The expansion expectations are distributed relatively uniformly across the supply chain, with the downstream future index indicating 66.2 and upstream indicating 64.8. Hence, the congestion observed in transportation is expected to continue over the next year, both upstream and downstream.
Transportation Prices
The Transportation Prices Index registered 65.3 percent in May 2022. This corresponds to a drop of 8.6 percent from the April transportation prices reading of 73.9. While the index remains above 50, indicating that prices are still increasing, the intensity is much lower and is now approaching levels last seen two years ago. If it had not been for the upturn in the back half of May, we would have seen the first sub-60.0 reading in two years. Further, the downward trend in price pressure is observed across the supply chains, with the upstream price index at 67.1 and the downstream price index at 61.1.
The future index for Transportation Prices indicates a value of 68.4, indicating continued expectations of price increases for the next year. The price increase expectations are slightly higher for downstream firms (index is at 70.0) than for upstream firms (index is at 67.7).
About This Report
The data presented herein are obtained from a survey of logistics supply executives based on information they have collected within their respective organizations. LMI® makes no representation, other than that stated within this release, regarding the individual company data collection procedures. The data should be compared to all other economic data sources when used in decision-making.
Data and Method of Presentation
Data for the Logistics Manager’s Index is collected in a monthly survey of leading logistics professionals. The respondents are CSCMP members working at the director level or above. Upper-level managers are preferable as they are more likely to have macro-level information on trends in Inventory, Warehousing, and Transportation trends within their firm. Data is also collected from subscribers to both DC Velocity and Supply Chain Quarterly as well. Respondents hail from firms working on all six continents, with the majority of them working at firms with annual revenues over a billion dollars. The industries represented in this respondent pool include, but are not limited to Apparel, Automotive, Consumer Goods, Electronics, Food & Drug, Home Furnishings, Logistics, Shipping & Transportation, and Warehousing.
Respondents are asked to identify the monthly change across each of the eight metrics collected in this survey (Inventory Levels, Inventory Costs, Warehousing Capacity, Warehousing Utilization, Warehousing Prices, Transportation Capacity, Transportation Utilization, and Transportation Prices). In addition, they also forecast future trends for each metric ranging over the next 12 months. The raw data is then analyzed using a diffusion index. Diffusion Indexes measure how widely something is diffused, or spread across a group. The Bureau of Labor Statistics has been using a diffusion index for the Current Employment Statics program since 1974, and the Institute for Supply Management (ISM) has been using a diffusion index to compute the Purchasing Managers Index since 1948. The ISM Index of New Orders is considered a Leading Economic Indicator.
We compute the Diffusion Index as follows:
PD = Percentage of respondents saying the category is Declining,
PU = Percentage of respondents saying the category is Unchanged,
PI = Percentage of respondents saying the category is Increasing,
Diffusion Index = 0.0 * PD + 0.5 * PU + 1.0 * PI
For example, if 25 say the category is declining, 38 say it is unchanged, and 37 say it is increasing, we would calculate an index value of 0*0.25 + 0.5*0.38 + 1.0*0.37 = 0 + 0.19 + 0.37 = 0.56, and the index is increasing overall. An index value above 0.5 indicates the category is increasing, a value below 0.5 indicates it is decreasing, and a value of 0.5 means the category is unchanged. When a full year’s worth of data has been collected, adjustments will be made for seasonal factors as well.