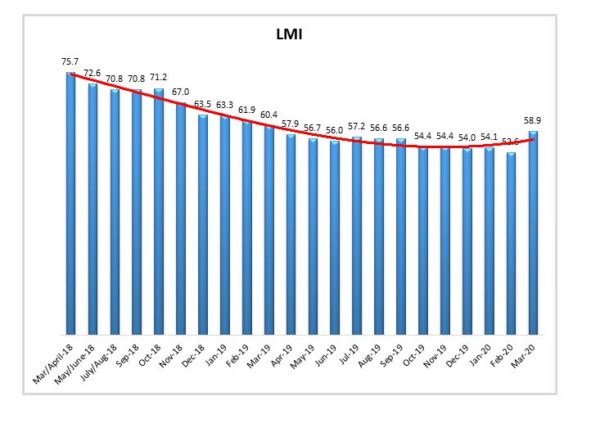
LMI® at 58.9%
Growth is INCREASING AT AN INCREASING RATE for: Inventory Levels, Inventory Costs, Transportation Utilization and Transportation Prices.
Growth is INCREASING AT A DECREASING RATE for: Warehouse Utilization and Warehousing Prices
Warehousing Capacity and Transportation Capacity are CONTRACTING.
Likely spurred on by the COVID-19 outbreak and the associated fallout, the March 2020 Logistics Managers’ Index (LMI) presents a marked change from the trends of the past year. While much of the global economy is in free-fall, the logistics (and particularly transportation) industry appear to be thriving. The overall LMI is up (+6.25) to its highest level in a year. This breaks a two-year trend of near-constant decreases in the overall index. While there is some evidence to suggest that this spike in logistics activity may not last, for the moment we are reporting significant resiliency across the logistics industry.
Researchers at Arizona State University, Colorado State University, Rochester Institute of Technology, Rutgers University, and the University of Nevada, Reno, and in conjunction with the Council of Supply Chain Management Professionals (CSCMP) issued this report today.
Results Overview
The LMI score is a combination of eight unique components that make up the logistics industry, including inventory levels and costs, warehousing capacity, utilization, and prices, and transportation capacity, utilization, and prices. The LMI is calculated using a diffusion index, in which any reading above 50 percent indicates that logistics is expanding; a reading below 50 percent is indicative of a shrinking logistics industry. The latest results of the LMI summarize the responses of supply chain professionals collected in March 2019. Six of the eight metrics are currently demonstrating growth. Only Warehouse Capacity and Transportation Capacity show contraction in this reading. This is crucial as these two metrics generally move inversely with economic growth (less warehousing/transportation available = increasing demand).
The overall LMI score is up significantly from February when it registered at an all-time low of 52.6. This breaks a long-running trend as prior to this reading, the lowest eleven scores in the history of the index have all occurred within the last eleven months. The dramatic increase in Transportation Prices (+16.54), and the similar decreases in both Warehousing and Transportation Capacity (down 17.0 points and 8.12 points respectively) are likely attributable to the recent rush by consumers to stock up on everything they need (or don’t need) during the forced quarantine. The lack of capacity and increase in Transportation Prices is likely due to the inability of retailers to keep staple goods such as eggs or toilet paper on the shelves, and suppliers rushing to replenish them.
Transportation metrics continue to be the most dynamic measures in the LMI®. Transportation Prices are up 16.54 points to 65.6. This metric was contracting in February, so this is a significant month-over-month increase (in fact, it is the largest monthly jump we have ever recorded for this metric). Interestingly, more granular analysis demonstrates that firms that are upstream in the supply chain saw greater increases than downstream firms (by a rate of 68.0 to 60.0). This likely indicates that the real crunch on transportation is being felt by suppliers looking to move goods to their customers, and less so on retailers attempting to move goods throughout their internal supply chains. Another factor driving prices up is the mismatch of inbound and outbound freight coming in and out of the major metro areas currently under “shelter-in-place” order. A lack of outbound freight means trailers are leaving these cities empty, driving up costs[1]. Transportation Capacity is contracting (-7.9) for the first time since October 2018. The slack that had existed int eh market is clearly gone. With the demand for transportation so high that even commercial airliners are being pressed into cargo service[2].
Warehousing Capacity has experienced its largest drop in the history of the index (-17.0) as retailers struggle to keep up with the spikes in consumer demand. We don’t see much movement in Warehouse Prices (-1.4), but this is likely due to those contracts being longer-term propositions.
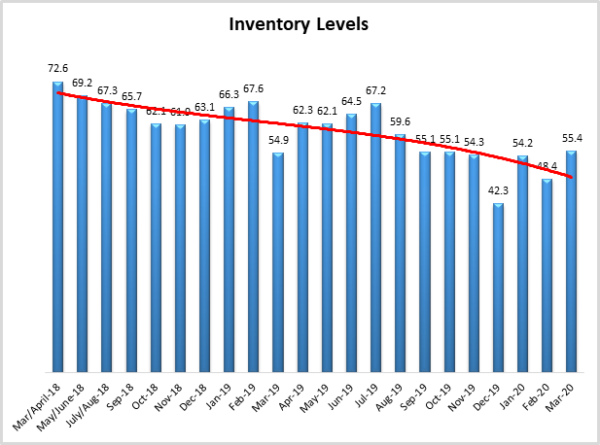
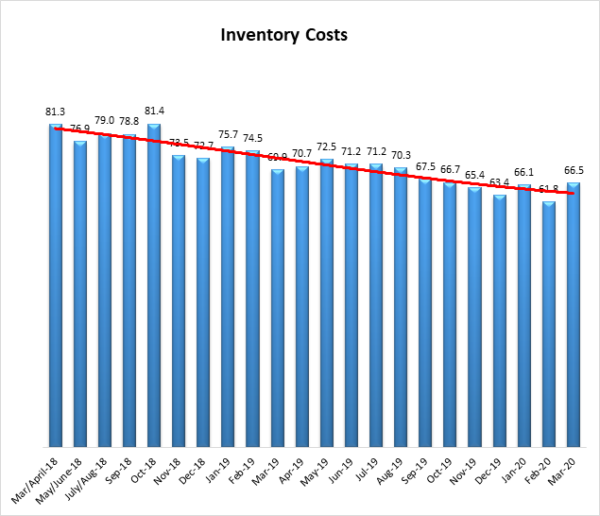
Inventory Levels are growing again (+7.0) after displaying contraction in February. This is also likely due to the rush on staple goods during the early days of lockdown, when suppliers such as Campbell’s Soup, Conagra, and General Mills were reporting increased shipments of 50% or more[3]. Inventory Costs are up as well (+4.7), likely due to the increased demand and limited capacity. It will be interesting to monitor whether or not consumer demand falls off in the coming weeks. With the initial rush to procure goods winding down and 10 million Americans newly-unemployed, it is likely that consumer spending will decrease. This may lead to a classic “bull-whip effect”, and cause both retailers and their suppliers to become over-inventoried. When comparing data from the last week of March to the first three weeks, there is evidence to suggest that the initial rush is subsiding. The table below displays metric scores from 3/1-3/23, and from 3/24-3/31. The third row presents the difference between the two time periods and the fourth row displays whether or not that difference is statistically significant. The sample size for the two groups is approximately equal so the comparisons are statistically sound.
| Inv. Level | Inv. Cost | WH Capacity | WH Utilization | WH Price | Trans Capacity | Trans Utilization | Trans Price | |
| 3/1-3/23 | 55.1% | 62.0% | 52.0% | 56.9% | 65.3% | 45.6% | 61.6% | 69.8% |
| 3/24-3/31 | 56.5% | 71.2% | 35.2% | 57.4% | 63.5% | 49.2% | 44.2% | 61.0% |
| Difference | 1.4% | 9.2% | -16.8% | 0.5% | -1.8% | 3.6% | -17.4% | -8.8% |
| Statistically Significant? | Not Significant | Somewhat Significant | Strongly Significant | Not Significant | Not Significant | Not Significant | Strongly Significant | Somewhat Significant |
The Transportation Utilization is significantly lower and available Warehouse Capacity is significantly higher, with some effects on both Transportation Prices and Inventory Cost. This suggests that the spike in consumer spending is subsiding. Whether or not spending remains high, or drops due to the worsening economy remains to be seen.
The index scores for each of the eight components of the Logistics Managers’ Index, as well as the overall index score, are presented in the table above. Six of the eight metrics show signs of growth, but many of them are moving at low or considerably decreased rates. The overall LMI® index score is at its lowest point in the history of the index. Our reading indicates a continued trend of slowing yet steady growth in the logistics industry.
| LOGISTICS AT A GLANCE | |||||
| Index | March 2020 Index | February 2020 Index | Month-Over-Month Change | Projected Direction | Rate of Change |
| LMI® | 58.87 | 52.62 | +6.25 | Growing | Increasing |
| Inventory Levels | 55.39 | 48.35 | +7.04 | Contracting | From Contracting |
| Inventory Costs | 66.49 | 61.80 | +4.70 | Growing | Increasing |
| Warehousing Capacity | 43.75 | 60.75 | -17.00 | Contracting | From Growing |
| Warehousing Utilization | 56.73 | 60.75 | -4.02 | Growing | Decreasing |
| Warehousing Prices | 64.50 | 65.91 | -1.41 | Growing | Decreasing |
| Transportation Capacity | 46.98 | 55.10 | -8.12 | Contracting | From Growing |
| Transportation Utilization | 53.04 | 51.01 | +2.03 | Growing | Increasing |
| Transportation Prices | 65.52 | 48.98 | +16.54 | Growing | From Contracting |
For the first time, this month we are including overall scores for both “upstream” and “downstream” respondents. Respondents classified as upstream are those that do not interact directly with consumers. These tend to be warehousing firms, carriers, and manufacturers. Downstream respondents are firms that do interact with consumers, such as retailers.
It is clear from the graph that the Upstream sector seems to be experiencing greater spikes in price and greater deficits in the capacity as they struggle to deliver goods to their downstream customers. The need for inventory in the Downstream sector is apparent in their Inventory Level contraction (as compared to the growing Inventory Levels reported by Upstream respondents).
Respondents were asked to predict movement in the overall LMI and individual metrics 12 months from now. Their predictions for future ratings are presented below and, as has become a pattern seem to be somewhat more optimistic than our current readings. Respondents seem to be predicting better times ahead as far as the logistics industry is concerned.
Historic Logistics Managers’ Index Scores
This period’s along with prior readings from the last two years of the LMI is presented table below. The values have been updated to reflect the method for calculating the overall LMI:
| Month | LMI | Average for previous readings – 61.8
High – 75.7 Low – 52.6 Std. Dev – 6.2
|
| Mar ‘20 | ||
| Feb ‘20 | 52.6 | |
| Jan ‘20 | 54.1 | |
| Dec ‘19 | 54.0 | |
| Nov ‘19 | 54.4 | |
| Oct ‘19 | 54.4 | |
| Sep ‘19 | 56.6 | |
| August ‘19 | 56.6 | |
| July ‘19 | 57.2 | |
| June ‘19 | 56.0 | |
| May’19 | 56.7 | |
| April ‘19 | 57.9 | |
| March ‘19 | 60.41 | |
| February ‘19 | 61.95 | |
| January ‘19 | 63.33 | |
| December ‘18 | 63.54 | |
| November ‘18 | 66.98 | |
| October ‘18 | 71.20 | |
| September ‘18 | 70.80 | |
| July/August ‘18 | 70.80 | |
| May/June ‘18 | 72.55 | |
| March/April ‘18 | 75.71 |
LMI®
The overall LMI index is 58.9, up (+6.3) from February’s all-time low reading of 52.6. As mentioned above, this breaks a year-long streak of downward-trending, sub-58.0 overall index scores. Although this is the highest overall score recorded since March 2019’s 60.4, it should be pointed out that it is still down 16.9 points from March 2018’s reading of 75.7. The logistics industry is trending up, but it is still nowhere near the highs of 2017-2018. Whether this upward trend continues or is merely a blip driven by a one-time rush to stock up before quarantine, remains to be seen.
Respondents predict that over the next year, the LMI will be at 62.3, down very slightly (-0.8), from February’s future prediction of 63.1. This would be a marked increase from its current. The LMI’s ability to achieve this predicted level depends largely on the length and breadth of the current lockdown, and our ability to recover from it.
Inventory Levels
The Inventory Level value is 55.4, up (+7.0) from last month’s 48.4, but only 1.2 points above the month before that and this metric continues to see-saw between contraction and expansion. The current value is 0.5 points above the value one year ago, but 17.2 points below the level two years ago at this time. The long-term trendline reflects recent fluctuations. As we noted in previous months, the sharp decline in December could have represented the beginning of an extended decline for the index, or, given past volatility, could have reflected fluctuations in the index. There is now more evidence for the former.
When asked to predict what will conditions will be like 12 months from now, the average value is 60.9, down (-4.5) from February’s prediction of 65.4. This indicates that respondents expect inventories to increase over the next year.
Inventory Costs
As inventory levels continue their slight growth, it is not surprising that inventory costs have continued to increase, although the rate has slowed. The current value is 66.5, up (+4.7) from the previous reading of 61.8. While these continued high levels indicate strong continued growth in inventory costs, they remain below the long-term average of 70.8. For instance, the current value is 14.8 points below the 81.3 value of two years ago at this time. This continued growth in costs could be related to the fact that warehousing prices have increased significantly in the most recent month, showing an index value of 64.5. Given the relatively small decrease in inventory levels seen above and consistent increases in warehousing costs, it seems quite likely that inventory costs will continue to rise.
Responses seem consistent with this hypothesis. When asked about what they expect inventory costs to be like 12 months from now, the index value is 71.6, up (+1.9), from February’s future prediction of 69.7. Respondents clearly expect inventory costs to continue to increase over the next 12 months.
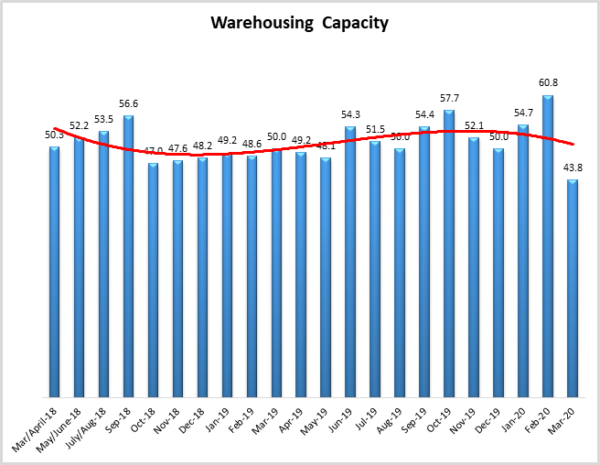
Warehousing Capacity
The Warehousing Capacity Index registered 43.8 percent in March 2020. This represents a dramatic drop of 17 percentage points from the February 2020 reading of 60.8, through it is on par with the March 2019 value of 50.0. Likely, the sharp decline in the capacity of warehousing is directly related to the supply chain disruption that the SARS-COV-2 (COVID-19) virus had on domestic and global supply chains. The reading suggests that the demand for goods at the consumer level has caused retailers/wholesalers/manufacturers to need significantly more warehousing to maintain service levels; hence the rapid drop in this measure.
Looking forward at the next 12 months, the predicted Warehousing Capacity index is 41.2, down significantly (-17.9) from February’s future prediction of 59.1, This continues a pattern of ping-ponging back and forth since October when it was at 62.0, down to 47.9 in November, up to 61.1 in December, down to 55.8 in January, 59.1 in February, and back down again this month. It is unclear what is causing these fluctuations.
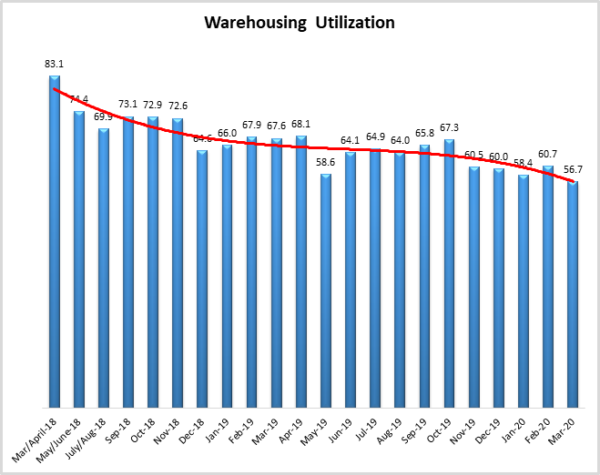
Warehousing Utilization
The Warehousing Utilization Index registered 56.7 percent in March 2020. This represents a slight decrease of 4 percentage points from last month, and is down by 10.9 points from the March 2019 reading of 67.6. This reading, which indicates that the rate at which utilization of warehousing, though still positive, is slightly increasing can be interpreted as follows. First, recall that February 2020 reading for warehousing capacity was sharply up. So, that the rate of utilization is slightly down might be an indication that there was excess capacity previously, and given the exogenous shock of COVID-19 caused massive demand on retailers/wholesalers we might expect to see utilization decrease as such. Future readings will indicate whether or not this is likely the case.
Looking forward to the next 12 months, the predicted Warehousing Utilization index is 61.8, down (-6.5) from February’s future prediction of 68.3. While this is down, respondents seem to remain optimistic that utilization will increase over the next year.
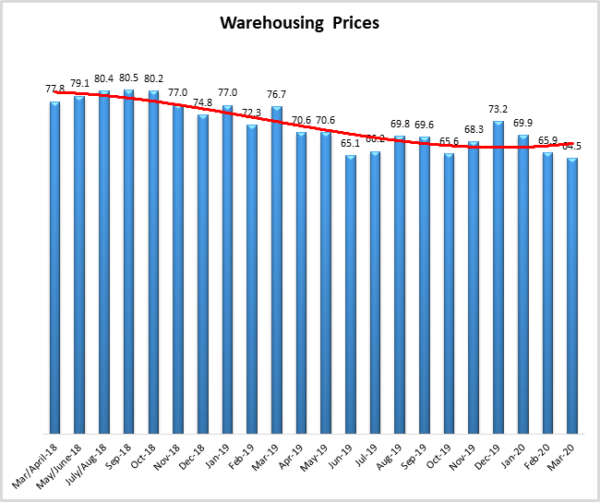
Warehousing Prices
Warehousing Prices Index registered 64.5 percent in March 2020. This is effectively unchanged, showing a 1.4 percentage point drop. This reading is also down rather sharply by 12.2 points from one year ago. This also continues the trend of the decreased rate of growth in pricing. Though still increasing, given the decline in the rate of growth from last month, and taken together with the increased utilization and increased capacity, this decrease could suggest that the market is reflecting the price sensitivity in demand and adjusting as necessary. Interestingly, however, given the rather sharp capacity decrease as indicate above, the prices it seems are relatively consistent. In previous readings, we have seen a slight seasonality to the shift in pricing, and next month’s reading will provide insight into whether or not this is the case; particularly as the impact of COVID-19 is felt.
Looking forward to the next 12 months, the predicted Warehousing Prices index is 66.7, this is down (-4.5) from February’s future prediction of 71.1. This indicates that firms are expecting continued increases in Warehouse Prices over the next 12 months.
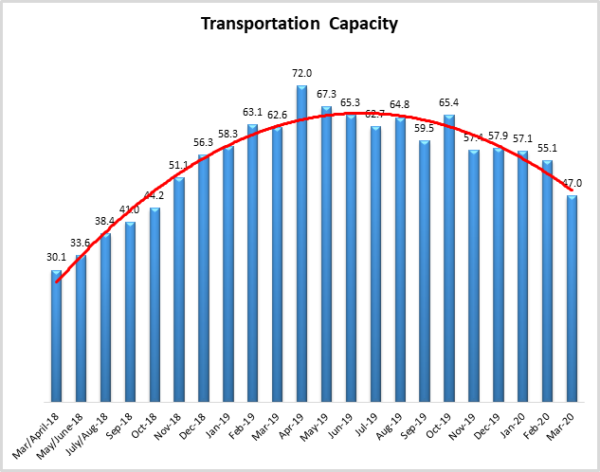
Transportation Capacity
The Transportation Capacity Index registered 47.0 percent in March 2020. This constitutes a large drop of 8.1 percentage points from the February reading of 55.1. This is the first time Transportation Capacity has read in as contracting since October 2018. This is further evidence of the increased demand for transportation and the movement of goods.
It should be noted the data indicates a score of only 45.1 percent for the next year, projecting expectations of decreasing transportation capacity in the next 12 months.
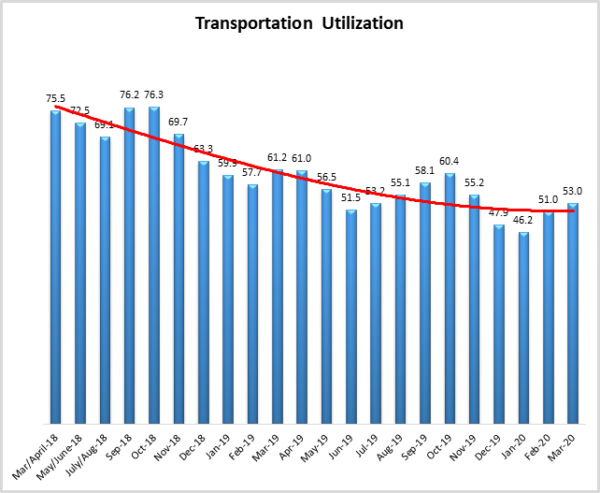
Transportation Utilization
The Transportation Utilization Index registered 53.0 percent in March 2020. This constitutes an increase of 2.0 percentage points from the February reading of 51.0. This breaks a two-month stretch of contracting utilization rates. This indicates that respondent firms are using more of the transportation capacity available to them.
The future Transportation Utilization Index indicates a 58.0 percent level for the next 12 months, indicating expectations of continued growth in the future.
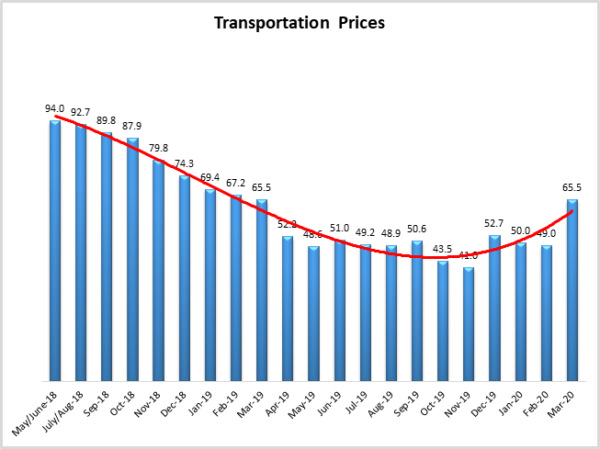
Transportation Prices
The Transportation Prices Index registered 65.5 percent in March 2020. This constitutes a large jump of 16.5 percent from the February transportation price reading of 49.0. This is the largest increase of any metric this month and the largest jump in the history of this particular metric. Prior to this Transportation Prices had been in a state of contraction for six of the previous ten readings.
The future index for transportation prices remains elevated, with a future Transportation Prices Index value of 65.7 indicating expectations of continuing price increases over the next 12 months.
About This Report
The data presented herein are obtained from a survey of logistics supply executives based on information they have collected within their respective organizations. LMI® makes no representation, other than that stated within this release, regarding the individual company data collection procedures. The data should be compared to all other economic data sources when used in decision-making.