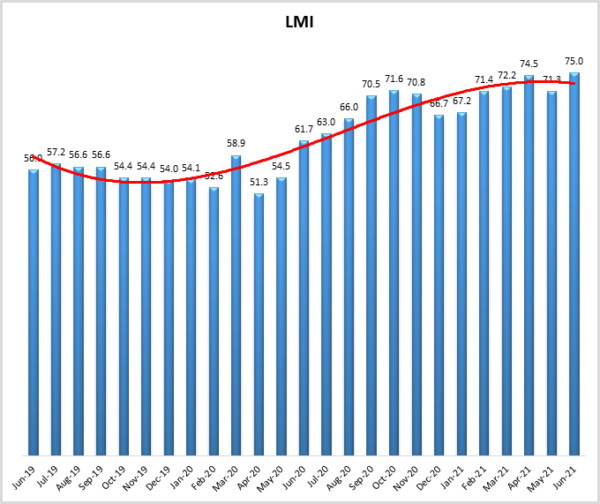
- LMI® at 75.0
- Growth is INCREASING AT A DECREASING RATE for Inventory Levels, Inventory Costs, Warehousing Utilization, Warehousing Prices, and Transportation Utilization, Growth is INCREASING AT A DECREASING RATE for Transportation Prices
- Warehousing Capacity and Transportation Capacity are CONTRACTING
June 2021’s LMI comes in at 75.0, the second-highest in the history of the index. The overall index rate has now come in above the 70-point mark in five consecutive months, the longest streak in the history of the LMI. We also see a new record established in the quarterly three-month moving average from April-June 2021. The reading of 73.6 suggests that Q2 2021 has seen the fastest rates of growth in the five-year history of the LMI – something that seems to reflect the sentiment of many LMI respondents throughout the Spring and early Summer. Much of this growth has been driven by Inventory Costs and Warehouse Prices, both of which read in at all-time index highs this month.
Researchers at Arizona State University, Colorado State University, Rochester Institute of Technology, Rutgers University, and the University of Nevada, Reno, and in conjunction with the Council of Supply Chain Management Professionals (CSCMP) issued this report today.
Results Overview
The LMI score is a combination of eight unique components that make up the logistics industry, including inventory levels and costs, warehousing capacity, utilization, and prices, and transportation capacity, utilization, and prices. The LMI is calculated using a diffusion index, in which any reading above 50 percent indicates that logistics is expanding; a reading below 50 percent is indicative of a shrinking logistics industry. The latest results of the LMI summarize the responses of supply chain professionals collected in June 2021. As we have seen for most of the last year, June LMI displays continued expansion in the logistics industry. Overall, the LMI is up (+3.7) from 71.3 in May. June’s reading of 75.0 is the second-highest in the history of the index (besting the previous second high-score of 74.5 which was only set two months ago in April).
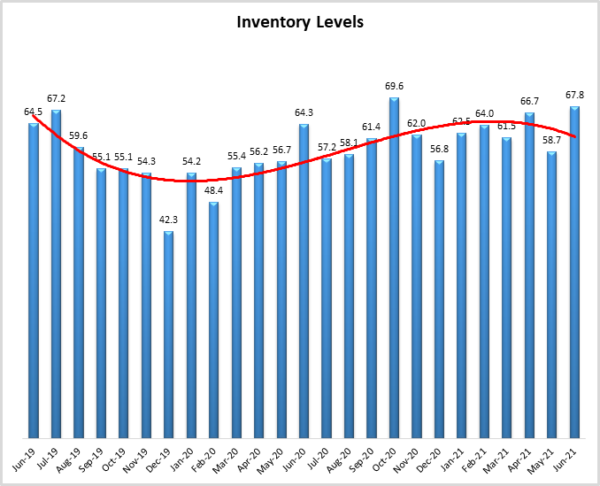
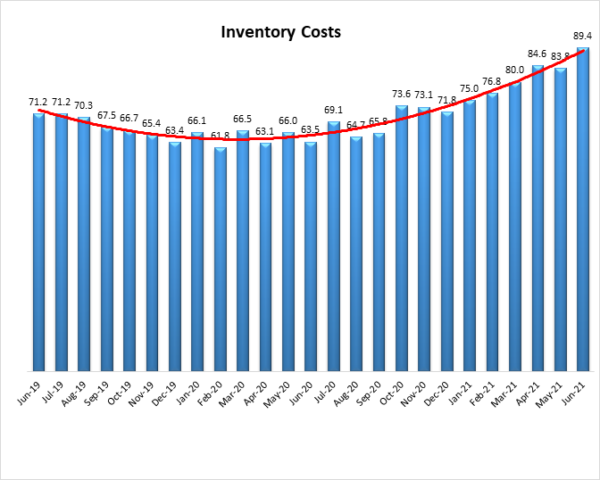
Much of June’s increased rate of growth is driven by movements in inventory. Inventory levels are up significantly (+9.1) to 67.8. Inventory Costs are also up (+5.6) to 89.4, which is an all-time high for this metric. This marks the third consecutive month a new all-time high score has been set. At this time last year, the two-inventory metrics were relatively close, a mere 0.8 points apart. Today they are separated by 22 points. This trend of moderate growth for Inventory Levels with a record or near-record rate of growth for Inventory Costs has continued through much of 2021. In April 2020, the Federal Reserve’s retail inventory-to-sales ratio read in at 1.67, one of its highest readings ever and highest since 1995. One year later in April 2021 (the most recent data available at the time of this writing), the inventory-to-sales ratio registers at 1.07 – the lowest reading ever by some distance. The movement of 0.6 points is the largest one-year movement in the history of this metric. This record movement is not due to lower levels of inventory, overall levels are actually up by 1.3% from the same time last year (and up 4.7% from their nadir in July). The difference lies in retail sales being 48.1% higher in April 2021 compared to April 2020 due to the reopening of the economy and the ending of COVID-19 lockdowns. Taken together with LMI inventory metrics suggest that a high volume of inventory is moving through supply chains at a significant velocity.
This velocity has led to low available capacities and high costs, including an all-time high for Warehouse Prices, up (+2.3) to 85.4. Increased logistics costs are a primary culprit behind the 5% increase in consumer prices for the 12-month period ending in May – the sharpest increase since 2008[1]. Consumers have not been deterred by these price increases, the U.S. economy grew at a rate of 6.4% in Q1 2021, and economists expect consumer spending could be up 9% this year – the highest levels since 1946 – the year after the end of World War II. Savings were at 12.4% in May 2021, nearly 50% higher than the 8.3% registered in February 2020 before the lockdowns, suggesting strong demand will continue through the rest of the year [2]. However, consumers will be less willing to absorb increased costs if they are not provided the service levels they expect. One of the key bottlenecks is low available Warehouse Capacity, which is down (-7.7) to 40.7. Other than July 2020 when it grew at a rate of 50.5, which at only 0.5 points above 50.0 is very close to no growth at all, available Warehouse Capacity has been contracting for a full year. Next-and same-day delivery promised by many e-commerce retailers requires a high volume of warehouses located close to population centers. From Q1 2020 to Q1 2021, U.S. where e-commerce sales increased 39.1% [3],[4]. While the majority of COVID-related lockdowns have ended, this growth is likely to continue. E-commerce only made 13.6% of U.S. retail sales in Q1 2021, but this ratio is expected to double to 26% of retail sales by 2025. Industry experts predict that 330 million square feet of warehouse space dedicated to online fulfillment will need to be added in the U.S. by 2025 to keep pace with the anticipated increase in demand [5].
A similar strain is observed in our transportation metrics. Available Transportation Capacity reads in at 34.5 (+1.9) and has been contracting for the past 13 months, with readings in the 30’s – indicating extreme rates of contraction – for five consecutive months. FreightWaves’ tender rejection index, which tracks how many potential truckloads (tenders) are being rejected, has hovered around 25% since Fall 2020, indicating that for every four loads that need to be moved, only three are being picked up [6]. This has led to further shipping delays as well spot rates increasing 46.8% for dry vans and 51.9% for flatbeds year-over-year [7]. The lack of capacity is reflected in high Transportation Utilization (+3.6 to 69.7) and Transportation Price (-3.9 to 87.3). Lack of transportation and high prices have been blamed for shortages for everything from lumber to fireworks [8]. To deal with this problem FedEx recently announced they would boost capital spending by 22% to $7.2 billion in the fiscal year starting in June to add capacity and improve on-time delivery rates [9]. This planned expansion will be limited by the tough market for semiconductors and the lack of drivers [10]. While 24,500 seasonally-adjusted trucking/transportation jobs were added in May, Michigan State’s Jason Miller warns that very few of these jobs are over-the-road long haul positions that are so sorely needed to alleviate capacity issues [11]. Even with the reopened economy and government stimulus transportation companies are still having issues staffing up fleets to keep up with burgeoning consumer demand.
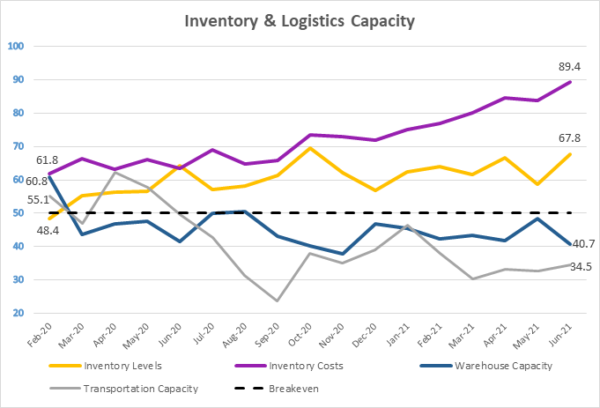
The chart below demonstrates the impact of the lack of available logistics capacity on inventory costs. In February 2020 (the last month before COVID), Inventory Levels (yellow line) were contracting slightly at a reading of 48.4. Inventory Costs, Warehouse Capacity, and Transportation Capacity were all increasing at mild rates between 55.1 and 61.8. Available Warehouse Capacity has been declining for most of the past 15 months; Transportation Capacity has declined for a year. The combined lack of capacity makes it difficult to meet consumer expectations. The mismatch between supply and demand has driven logistics costs up, despite the fact that inventory is flowing quickly. Essentially, the changes to logistics demand over the last year mean that it has become significantly more expensive for supply chains to hold and move each unit of inventory, even in cases where they have less inventory than they did before. This will continue until supply chain networks, which are still configured for pre-pandemic business cycles, can be adjusted to better reflect our post-pandemic reality.
The index scores for each of the eight components of the Logistics Managers’ Index, as well as the overall index score, are presented in the table below. Six of the eight metrics show signs of growth, albeit at declining rates, while both capacity metrics continue their runs of contraction. The logistics industry remains tight and based on future predictions and industry experts seems likely to stay that way through the rest of the year.
| Rate of Change | LOGISTICS AT A GLANCE | ||||
| Increasing | Index | June 2021 Index | May 2021 Index | Month-Over-Month Change | Projected Direction |
| Increasing | LMI® | 75.0 | 71.3 | +3.7 | Growing |
| Increasing | Inventory Levels | 67.8 | 58.7 | +9.1 | Growing |
| Increasing | Inventory Costs | 89.4 | 83.8 | +5.6 | Growing |
| Increasing | Warehousing Capacity | 40.7 | 48.3 | -7.7 | Contracting |
| Increasing | Warehousing Utilization | 75.5 | 68.7 | +6.8 | Growing |
| Increasing | Warehousing Prices | 85.4 | 83.1 | +2.3 | Growing |
| Increasing | Transportation Capacity | 34.5 | 32.7 | +1.9 | Contracting |
| Decreasing | Transportation Utilization | 69.7 | 66.1 | +3.6 | Growing |
| Transportation Prices | 87.3 | 91.2 | -3.9 | Growing |
This month, both upstream (blue bars) and downstream (orange bars) firms reported significant continued growth in the utilization of logistics services. We observed some differences across warehousing metrics and in available Transportation Capacity.
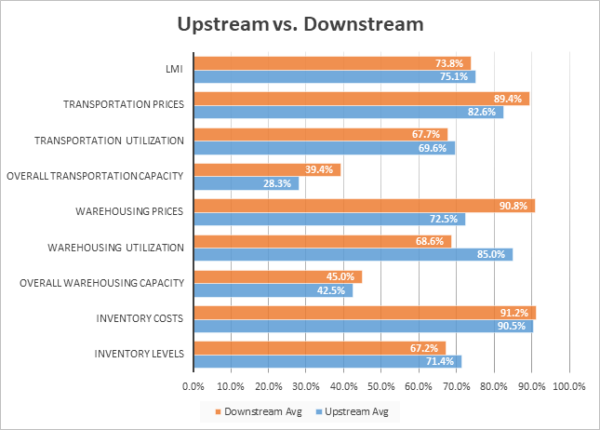
T-tests demonstrate that while upstream firms are reporting significantly higher levels of Warehouse Utilization, their downstream counterparts are reporting higher Warehouse Prices. Utilization and price generally track together, however, there are potential explanations for this seeming disconnect. This may indicate that upstream firms are holding more inventory (their Inventory Levels are higher, though not significantly so) and must therefore utilize more of the space available to them. At the same time, the space that downstream retailers need is closer to consumers and is, therefore, more expensive. Available capacity is contracting for both upstream and downstream firms, but at a significantly faster rate for the former. This provides support for the claims of various upstream manufacturers, that it is a lack of transportation capacity that is preventing their goods from reaching consumers.
| June ‘21 | Inv. Lev. | Inv. Costs | WH Cap. | WH Util. | WH Price | Trans Cap | Trans Util. | Trans Price |
| Downstream | 67.2 | 91.2 | 45.0 | 68.6 | 90.8 | 39.4 | 67.7 | 89.4 |
| Upstream | 71.4 | 90.5 | 42.5 | 85.0 | 72.5 | 28.3 | 69.6 | 82.6 |
| Delta (abs) | 4.2 | 0.8 | 2.5 | 16.4 | 18.3 | 11.1 | 1.9 | 6.8 |
| Significant? | No | No | Marginal | Yes | Yes | Yes | No | No |
Respondents were asked to predict movement in the overall LMI and individual metrics 12 months from now. Their predictions for future ratings are presented below. For the next year, respondents predict a growth rate of 69.7 for the overall LMI. This is nearly 10 points above the all-time growth rate of 63.3, it is down slightly from May’s prediction of 73.0. Nevertheless, this represents a significant rate of growth. This slightly diminished rate of growth stems from the lower (but still quite high) price growth predictions and increased expectations for available capacity. The change in the predicted movement for Transportation Capacity is particularly notable as it moved from contraction to growth. Both Transportation and Warehousing Capacity predictions are up 10 points from May’s future predictions. This optimism may stem from news more warehouses are being built, and that trailer production is increasing and trucks are projected to follow starting in late 2021 and increasing through 2022-23[12].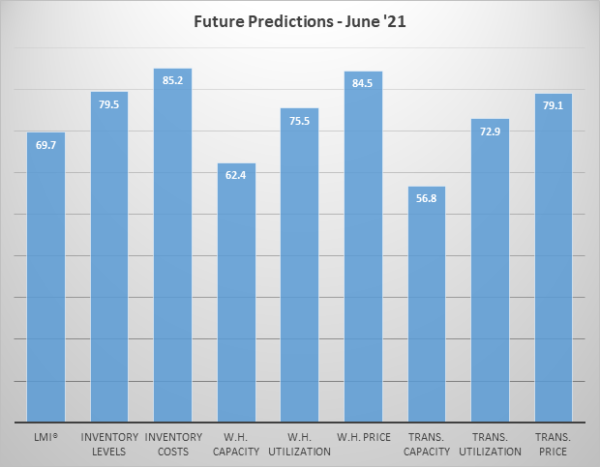
Interestingly, upstream and downstream respondents seem to be in agreement on this, as we see a very little divergence between the two groups for future predictions:
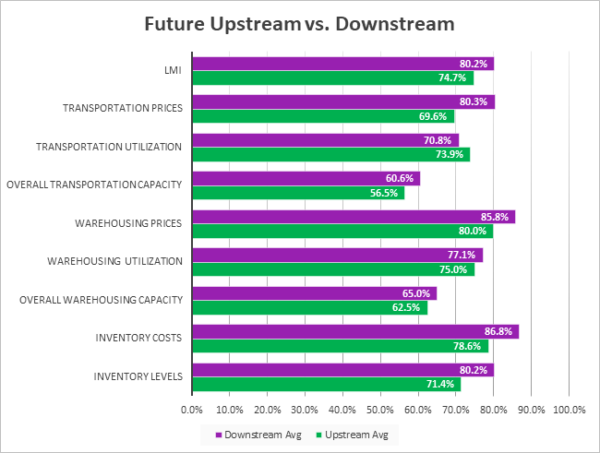
The only difference T-tests show is a marginal one, with downstream firms painting a slightly rosier picture on the future of Transportation Capacity. Small difference aside, if the additional capacity that both groups predict comes to pass, it will be a significant relief for firms that have been dealing with the shortage for the last 15 months.
| Future Readings | Inv. Lev. | Inv. Costs | WH Cap. | WH Util. | WH Price | Trans Cap | Trans Util. | Trans Price |
| Downstream | 80.2% | 86.8% | 65.0% | 77.1% | 85.8% | 60.6% | 70.8% | 80.3% |
| Upstream | 71.4% | 78.6% | 62.5% | 75.0% | 80.0% | 56.5% | 73.9% | 69.6% |
| Delta (abs) | 8.7% | 8.3% | 2.5% | 2.1% | 5.8% | 4.1% | 3.1% | 10.7% |
| Significant? | No | No | No | No | No | Marginal | No | No |
Historic Logistics Managers’ Index Scores
This period’s along with prior readings from the last two years of the LMI is presented table below. The values have been updated to reflect the method for calculating the overall LMI:
| Month | LMI | Average for previous readings – 63.3
High – 75.7 Low – 51.3 Std. Dev – 6.86
|
| June ‘21 | 75.0 | |
| May ‘21 | 71.3 | |
| Apr ‘21 | 74.5 | |
| Mar ‘21 | 72.2 | |
| Feb ‘21 | 71.4 | |
| Jan ‘21 | 67.2 | |
| Dec ‘20 | 66.7 | |
| Nov ‘20 | 70.8 | |
| Oct ‘20 | 71.6 | |
| Sep ‘20 | 70.5 | |
| Aug ‘20 | 66.0 | |
| July ‘20 | 63.0 | |
| June ‘20 | 61.7 | |
| May ‘20 | 54.5 | |
| Apr ‘20 | 51.3 | |
| Mar ‘20 | 58.9 | |
| Feb ‘20 | 52.6 | |
| Jan ‘20 | 54.1 | |
| Dec ‘19 | 54.0 | |
| Nov ‘19 | 54.4 | |
| Oct ‘19 | 54.4 | |
| Sep ‘19 | 56.6 | |
| August ‘19 | 56.6 | |
| July ‘19 | 57.2 | |
| June ‘19 | 56.0 |
LMI®
The overall LMI index is 75.0, up (+3.7) from May’s reading of 71.3, and is the second-highest reading in the history of the index. This is the fifth consecutive month with a reading above 70.0. The three-month moving average from April-June 2021 is 73.6, the highest in the history of the index – providing evidence that Q2 2021 is one of the most strenuous on record for the logistics industry. As discussed above, the cumulative effects of this ongoing growth are being felt by nearly every sector of the U.S. economy.
Respondents are not expecting some modicum of relief over the next 12 months, predicting a growth rate of 69.7, this is down (-3.3) from May’s future prediction of 73.0, but would still be significantly higher than the all-time average of 63.3. This growth rate over the next 12 months would lead to further growth in the logistics industry but at a slightly decreased pace
Inventory Levels
The Inventory Level value is 67.8, up significantly (+9.1) from May’s reading of 58.7 and 3.5 points higher than the same time last year. The current reading is above the all-time average value for this metric of 61.0. Since November of 2016, there has been a consistent trend of inventory growth (50 or higher), with only two values indicating a contraction in inventory levels.
When asked to predict what conditions will be like 12 months from now, the average value is 79.5, up (+5.8) from May’s future prediction of 73.7. This is also well above the current inventory index value of 58.7. Respondents expect inventory values to continue increasing significantly over the next year.
Inventory Costs
Given the continued increases in inventory levels, it is not surprising that inventory costs have continued to increase. The current value is 89.4, which is the highest reading in the history of the LMI. The three highest Inventory Cost levels have all come in the last three months, indicative of the stresses currently being put on supply chains all over the world as the deal with the re-emergence of consumer demand. This is up (+5.6) from May’s reading of 83.8. The current value is 25.9 points above the value last year at this time, a huge cost growth over last year at this time. The current value is also 18.2 points above the value two years ago at this time. Inventory cost values have never fallen below 50, over the life of the index.
Responses from participants are consistent with this prediction. When asked about what they expect inventory costs to be like 12 months from now, the index value is 88.5, down slightly (-1.4) from May’s future prediction of 88.9, Respondents clearly expect continued growth for inventory costs over the next 12 months.
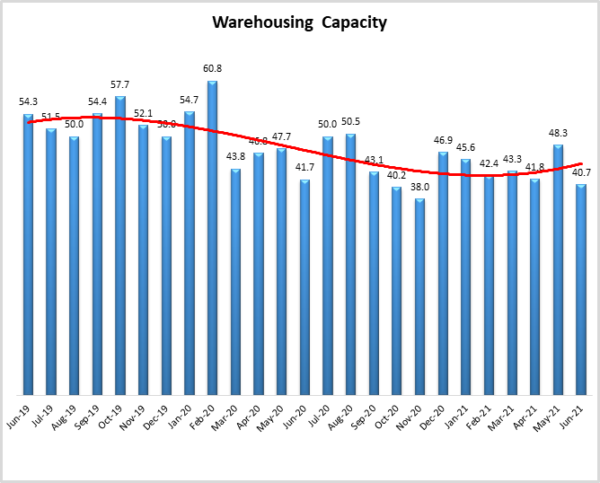
Warehousing Capacity
June 2021’s warehousing capacity registered in at 40.7 and reflects a somewhat sharp decrease from the previous month, though overall still in decline (still below the 50 percent mark, now for the 10th month in a row). Furthermore, last month demonstrated an increase from the readings in months prior, which at the time our team suspected may be a harbinger of increased capacity coming online. It appears as though it may have been a blip. This result is down by one point from the reading one year ago (June 2020 registered in at 41.7).
Looking forward to the next 12 months, the predicted Warehousing Capacity index is predicted to increase at a rate of 62.4, this is up (+10.3) considerably from May’s future prediction of 52.1. This marks a significant upturn in long-term optimism from our respondents on the construction of new logistics capacity going forward.
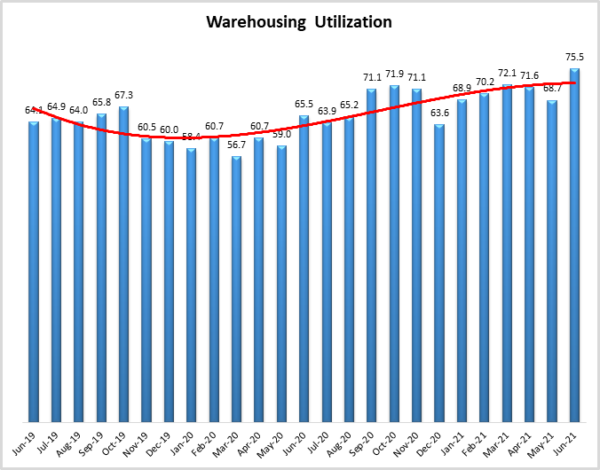
Warehousing Utilization
The Warehousing Utilization Index registered 75.5 percent in June 2021. This represents a nearly 7-point increase from last month and is (again) up dramatically by nearly 10 percentage points from the June 2021 reading of 65.5. This reading represents a break from last month’s decrease in the increased rate of utilization but is a continuation of the growth pattern shown from December 2020 to April 2021. Previously, our team thought that the data were showing an increased capacity coming online, but the increased rate of utilization, coupled with the decreased capacity would indicate that may not be true. Or, possibly, that the rate of consumption is so rapid that such demand has outstripped whatever capacity has come online.
Looking forward to the next 12 months, the predicted Warehousing Utilization index is 75.5, up slightly (+1.5) from May’s future prediction of 74.0. Respondents expect to utilize increasingly greater amounts of available warehouse space throughout the year as supply struggles to keep up with demand.
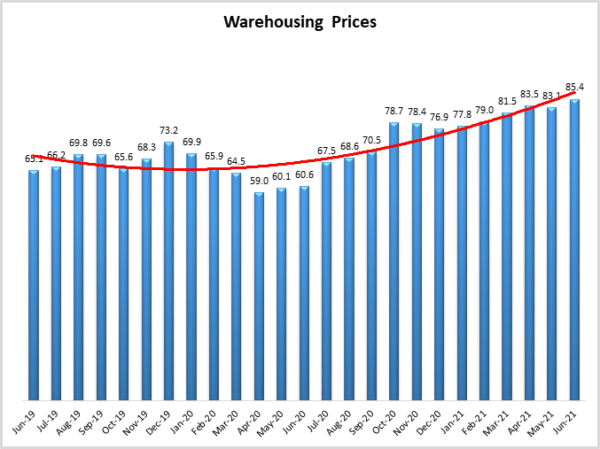
Warehousing Prices
Warehousing Prices Index registered 85.4 percent in June 2021, the highest reading for this metric in the history of the LMI. This reading represents a 2.3-point increase from last month and continues the trend in the (previously unrelenting) increased growth rate in warehousing prices amid the COVID-19 disruption(s). This reading is up by an incredible nearly 18 percentage points from the reading one year ago. Previous reports indicated “more capacity coming online (or demand for e-commerce declining) is needed in order to have prices decline” and “that this month reflects the first sign of this potential market shift, more data is needed”, it appears that the basic relationship between constant (if not increasing) demand, decreased capacity, and increased utilization is holding where pricing has continued, and will likely continue to increase.
Future predictions suggest that respondents are expecting prices to continue to grow at a rate of 84.5, down (-2.7) from May’s future prediction of 87.2. It may be that respondents are hopeful that the new capacity they are predicting will alleviate some of the competition for space and drive down prices over the next 12 months.
Transportation Capacity
The Transportation Capacity Index registered 34.5 percent in June 2021. This constitutes a small increase of 1.8 percentage points from the May reading of 32.7. The Transportation Capacity Index remains historically low, indicating continued downward pressure on transportation capacity. Our data parallels recent media reports that indicate transportation capacity shortages on multiple fronts, from containers to truck drivers.
The future Transportation Capacity Index increased slightly from the previous reading, indicating 56.8 for the next year. This denotes an increase of 10 points from the previous future expectations, bringing the index above the critical threshold of 50 and, similar to predictions for additional Warehousing Capacity, indicates expectations of expanding transportation capacity for the next 12 months.
![]()
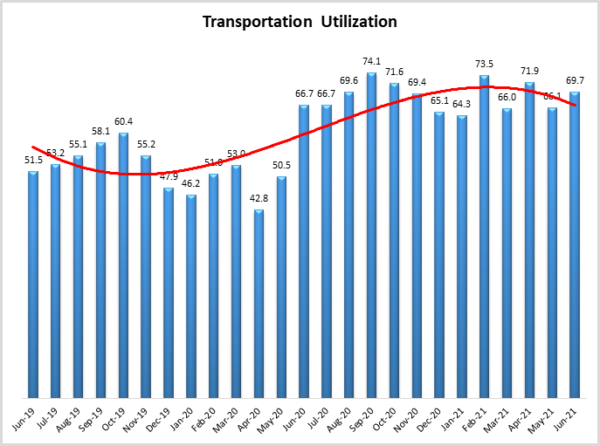
Transportation Utilization
The Transportation Utilization Index registered 69.7 percent in June 2021. This number denotes an increase of 3.6 points from the May reading of 66.1. We expect this number to continue to grow as long as the capacity shortage continues – which based on respondent predictions seems likely to go through at least the rest of the year and possibly beyond.
It should be noted that the future Transportation Utilization Index is also up 1.1 points from the previous month indicating a 72.9 percent level for the next 12 months. As such, the future transportation utilization index remains substantially above 50, indicating strong expectations of continued growth in Transportation Utilization.
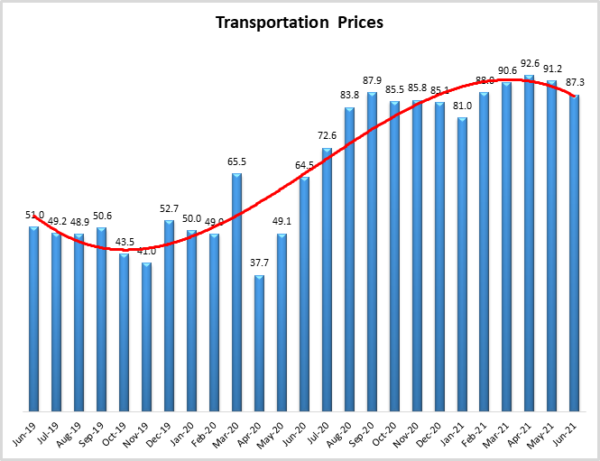
Transportation Prices
The Transportation Prices Index registered 87.3 percent in June 2021. This corresponds to a decrease of 3.9 percent from the May Transportation Prices reading of 91.2. The upward pressure on Transportation Prices that gained momentum in the Fall months of 2020 seems to be losing a little of its momentum. That said, the index remains very elevated and well above the 50 percent critical level that indicates price increases.
The future index for Transportation Prices indicates a value of 79.1, which is also lower (-8.1) than the previous month’s expectations of 87.2. This may reflect the hope that increased capacity will lead to lower prices. However, even if this is the case, the expectations of continued transportation price increases for the next 12 months remain strong, and well above the critical level of 50, but the future price increase pressure seems to be also losing some of its momentum.
About This Report
The data presented herein are obtained from a survey of logistics supply executives based on information they have collected within their respective organizations. LMI® makes no representation, other than that stated within this release, regarding the individual company data collection procedures. The data should be compared to all other economic data sources when used in decision-making.
Data and Method of Presentation
Data for the Logistics Manager’s Index is collected in a monthly survey of leading logistics professionals. The respondents are CSCMP members working at the director level or above. Upper-level managers are preferable as they are more likely to have macro-level information on trends in Inventory, Warehousing and Transportation trends within their firm. Data is also collected from subscribers to both DC Velocity and Supply Chain Quarterly as well. Respondents hail from firms working on all six continents, with the majority of them working at firms with annual revenues of over a billion dollars. The industries represented in this respondent pool include, but are not limited to Apparel, Automotive, Consumer Goods, Electronics, Food & Drug, Home Furnishings, Logistics, Shipping & Transportation, and Warehousing.
Respondents are asked to identify the monthly change across each of the eight metrics collected in this survey (Inventory Levels, Inventory Costs, Warehousing Capacity, Warehousing Utilization, Warehousing Prices, Transportation Capacity, Transportation Utilization, and Transportation Prices). In addition, they also forecast future trends for each metric ranging over the next 12 months. The raw data is then analyzed using a diffusion index. Diffusion Indexes measure how widely something is diffused, or spread across a group. The Bureau of Labor Statistics has been using a diffusion index for the Current Employment Statics program since 1974, and the Institute for Supply Management (ISM) has been using a diffusion index to compute the Purchasing Managers Index since 1948. The ISM Index of New Orders is considered a Leading Economic Indicator.


