- LMI® at 45.4
- Growth is INCREASING AT AN INCREASING RATE for: Inventory Costs, and Warehousing Capacity
- Growth is INCREASING AT AN DECREASING RATE for: Warehousing Utilization, Warehousing Prices, and Transportation Capacity
- Inventory Levels, Transportation Utilization, and Transportation Prices are DECREASING
Similarly to last month, Inventory Levels are down (-1.0) to 41.9 which is the steepest rate of contraction in the history of the index. Decreasing inventories have led to slowing rates of growth for both Warehousing Utilization and Warehousing Prices, with Warehousing Capacity increasing. Interestingly, we do see the rate of growth for Transportation Capacity slowing while Transportation Prices decline at their slowest rate since April. Warehousing metrics are still buoying the overall index, but they are softening as transportation metrics are beginning to stiffen.
Researchers at Arizona State University, Colorado State University, Florida Atlantic University, Rutgers University, and the University of Nevada, Reno, and in conjunction with the Council of Supply Chain Management Professionals (CSCMP) issued this report today.
Results Overview
The LMI score is a combination of eight unique components that make up the logistics industry, including: inventory levels and costs, warehousing capacity, utilization, and prices, and transportation capacity, utilization, and prices. The LMI is calculated using a diffusion index, in which any reading above 50.0 indicates that logistics is expanding; a reading below 50.0 is indicative of a shrinking logistics industry. The latest results of the LMI summarize the responses of supply chain professionals collected in July 2023.
We continue to see very different outcomes for the overall economy and the logistics industry. This dichotomy is most clearly seen in employment figures. While 209,000 workers were added in June, 14,000 freight and parcel carriers were cut and 6,900 warehousing and storage jobs were lost. In the past we would expect to see transportation and warehousing ramping up hiring in late summer ahead of peak season. However, analysts do not see the same “urgency” towards hiring in the logistics industry so far this year (1) . Freight and storage markets are at lease somewhat suppressed by high interest rates. Ironically, the contraction we see in the former and the softening we see in the latter have driven down supply costs, allowing some prices to come down and taking pressure off of labor. Essentially, the slowdown in logistics costs is allowing growth to slow to a more sustainable level. A point in that direction can be seen in personal-consumption expenditures (PCE) increasing by 3% in June year-over-year, which is down from the 3.8% increase in May and steadily moving closer to the Fed’s preferred targe t(2). This is partially fueled by a decline in wage growth. Wages were up one 1% in Q2 (down from a 1.2% bump in Q1) and up 4.5% year-over year (3). We also saw that consumer spending on goods in Q2 was down year-over-year, particularly on durable goods like cars and appliances (4).
All of this led the Fed to once again raise interest rates at their most recent meeting, pushing rates to a range between 5.25 and 5.5% – the highest in 22 years. However, Chairman Powell noted that further increases would be dependent on the how quickly inflation can be reined in. Perhaps most encouragingly, Powell stated that Fed analysts were no longer predicting a recession to occur in 2023 – a marked change from their stance earlier in the Spring (5) (and as dedicated readers will know – in line with what the LMI has been predicting all year). While there may still be interest rate increases in 2023, Powell did say that the improvement in inflation means the Fed can “afford to be a little patient” (6).
Inventories showed up in an unexpected way in the GDP numbers that were published in July. U.S. GDP was up 2.4% in Q2 – up from analyst expectations and the growth seen in Q1. This is a far cry from the same time last year when the economy was in the midst of a two-quarter retraction. Interestingly, private inventories contributed positively, adding 0.14% to overall GDP growth after acting as a net negative of 2.1% in Q17 . Relatedly, in late July the Atlanta Fed released a prediction of 3.5 percent GDP growth for Q38 . This is a far cry from late 2022 and earlier this year when many were predicting a recession. This prediction raises two major questions:
1) How would inventories have to change to facilitate this level of growth?
2) Will firms be able to move this many goods this quickly? There is plenty of idle trucking and warehousing capacity, but for 3.5% growth there will need to be a lot of goods passing through them. Would the improvements that have been made to port, storage, and intermodal infrastructure be enough? Or would we see congestion that
is similar to what we had in 2021?
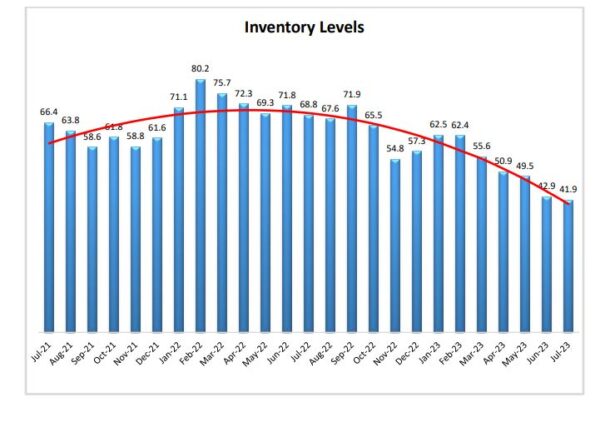
Currently inventory levels are at their lowest point in the history of the index, down (-1.0) from June’s reading and contracting at a rate of 41.9. Working through the bulge of inventories that firms had in 2022 was a lengthy process, and according to July’s results, still ongoing for Upstream respondents (Downstream Inventory Levels ticked up slightly).
On a recent earnings call Knight-Swift CEO David Jackson posited that wide-scale destocking is near the end, and seasonality should return in the “coming quarters” (9) . While this is reflected in the respondent future predictions discussed below, it should be pointed out that some carriers have been predicting a restock to happen for months and it has still not yet materialized. However, one argument for restocking occurring is that the Consumer Sentiment Index tracked by the University of Michigan was up 11% to 71.6 in July, which is the highest reading since October 2021 and suggests that consumers are increasingly confident about the short- and long-term health of the economy (10). Confident consumers need something to spend money on, and firms will need to build inventories back up if they don’t want to miss potential sales. Some firms are likely holding back on restocking due to two reasons: First, they may believe that there is a lot of flexibility in freight markets right now, and that rush orders will be possible. Many retailers have talked about wanting to move back towards JIT inventory management, the continued drop in inventories might be proof of this. Second, after being burned by overstocks in 2022, firms may be hesitant to ramp back up. This could be particularly true for firms who are still locked into higher
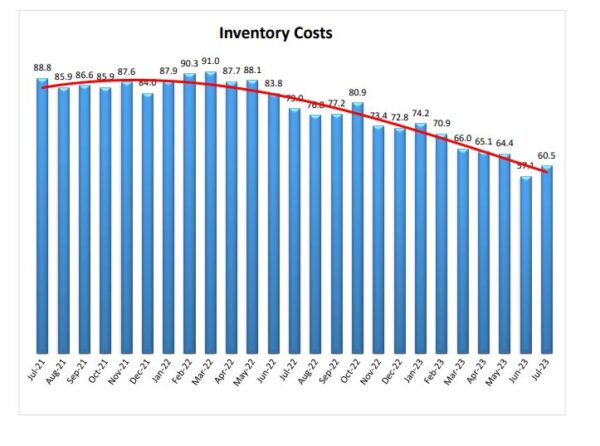
storage costs. Inventory Costs are still increasing (+3.5) at a level of 60.5. When firms eventually do decide to stock back up, there will be some costs associated with it.
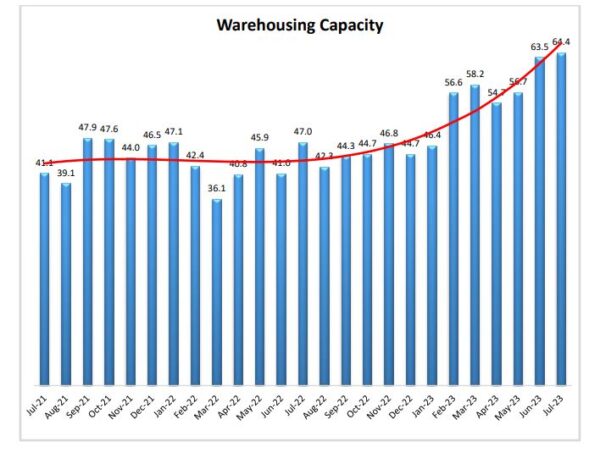
While costs may be higher than they would like, firms interested in restocking should have an easier time finding storage space than they would have a year ago. Warehousing Capacity was up (+0.9) to 64.4 in July. This is the fastest rate of expansion for this metric in the history of the LMI. To put the pace of change in perspective, this number is up 17.4-points from a year ago when capacity was contracting at a rate of 47.0. Cushman & Wakefield seem to concur with this analysis, showing that the vacancy rate for industrial real estate in the U.S. was up to 4.1% in Q2 – up from the 3.5% in Q111 . The increase in available capacity has led to slower growth in Warehousing Capacity, which is down (-4.3) to a very mild expansion of 52.5.
Evidence of the slowdown in the warehousing market can be seen in the changes in hiring. There were 1.96 million U.S. warehouse workers in June of 2022. That number has come down by 41,000 positions in the 13 months since. This has also corresponded to a cooling in wages and the discontinuation of things like signing bonuses that were used to attract talent. Some of the lost warehousing jobs are of course being filled by enhanced automation, as seen in Walmart’s newly updated Brooksville, Florida facility where tasking like pallet building have become fully automated (12).
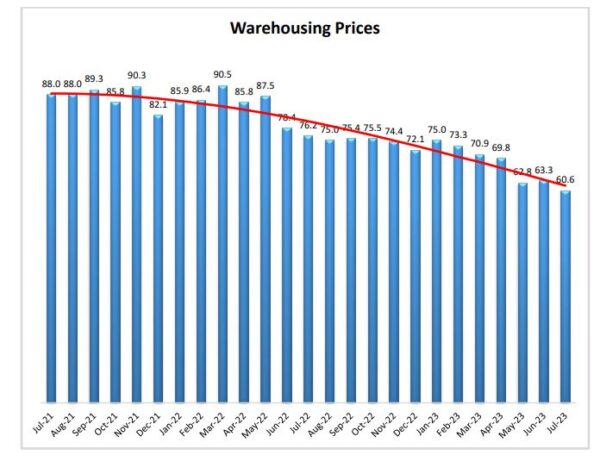
Despite the contraction, it should be noted that there are 275,000 more warehousing positions in the U.S. than there were two years ago, and pay is 8% higher (13) . Respondents are not expecting warehousing metrics to continue plummeting into negative territory. With ecommerce stabilized at around 15% of retail, it is more likely that the warehousing market is reaching an equilibrium after three years of wild swings. Industry leader Prologis seems to subscribe to this school of thought, as they recently revised earnings upward. They appear to be betting that their recently enhanced portfolio of assets will be well-utilized in the near future given the slowdown in new industrial construction (11). Recent history would suggest this is a good bet. Warehousing is more stable than transportation and less prone to wild swings. The lowest level we have ever observed for Warehousing Prices is 59.0, having never contracted. Even now, with available capacity having increased for seven consecutive months, Warehousing Prices still come in at 60.6 (-2.7) which is indicative of healthy growth.
There was a lot of news in July, but this month’s discussion of the transportation market should start with developments regarding the largest carrier in the U.S. UPS reached a tentative agreement with the Teamster’s Union and the 340,000 UPS drivers they represent in the last week of July. The tentative deal is worth $30 billion. In addition to significant pay raises drivers will also avoid mandatory overtime on days off (14). This will have significant impacts on the economy. UPS has hinted that they may increase prices due to the additional $30 billion over five years that they will be paying employees as a result of the recent union negotiation. GRI may increase between 11-12%, although the real cost passed along to shippers would likely be in the single digits (15) . A UPS strike could have devastated the economy. UPS delivers 24.3 million packages per day (16), and analysts estimate that a strike would have cost the economy upwards of $7 billion, of which $4.6 billion would have been increased customer costs, in only 10 days (17). While Transportation Capacity has been increased for 16 consecutive months (reading in at 65.6 in July – down 5.7-points from
June) it would have been very difficult to replace UPS. FedEx is the only carrier w/similar size, but they were focused on “protecting capacity and service for existing customers”. “There isn’t a single company on the planet that can handle 24 million shipments a day that UPS manages” – Mike Parra, CEO of Americas for DHL Express (18) (Solomon 2023a).
Large carriers did not escape July unscathed. It was a year ago in July 2022 that Transportation Prices shifted into contraction territory. Transportation Prices have continued to contract ever since this pivot reading in at 35.6 (+2.8) in July 2023. Transportation Utilization also contracted (-5.0) at a rate of 41.8. The consequences more than a year-long freight recession were felt acutely this month. Yellow, America’s third-largest LTL carrier shuttered operations on July 30th (19). This move jeopardizes around 30,000 jobs and would be the largest trucking company collapse in U.S. history. Yellow is not the only carrier having a rough go financially. Knight-Swift reported a 21% drop in revenue during Q2 (20). Many other carriers, including Saia, Hub Group, and Ryder were down in the second quarter (21, 22, 23). Markets are naturally pulled towards equilibrium between supply and demand. Previous LMI reports had speculated that the freight recession would eventually end when and if capacity began to exit the market. Yellow’s shutdown may be the beginning of that regression to the norm (to be clear, we are not speculating that shutdowns are imminent for any other specific carrier).
If we are going to see a rebalance of supply and demand in the freight market, it will probably have to come from a decrease in supply, as an increase in demand may not be in the cards. Freight forwarder Kuehne + Nagel are expecting “no peak season” in 2023 as booked sailings continue to lag behind what we would expect at this time of the year as their Q2 net turnover is down 43% from a year ago. Rival DSV’s revenue has dropped 40% over the same period. The no peak season hypothesis is supported by Chinese manufacturing continuing to decrease in July24 . DSV CEO Jens Bjorn Andersen is holding out some hope that orders will pick up if consumer demand continues to stay strong, but with Q4 approaching quickly we would need to see movement very soon for that to be a possibility (25). Some of Yellow’s competitors are already benefiting from their downfall. Arcbest claimed its number of shipments jumped up 10% in the past week as shippers move volume to a carrier on firmer financial footing. Several shippers recently moved from Yellow to other carriers due to fear of shipping delays caused by a potential strike (26).
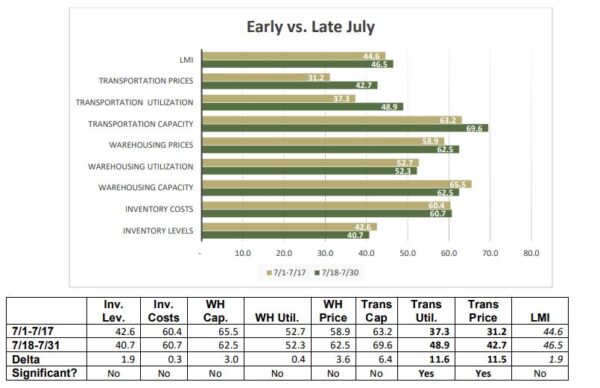
The tightening of capacity already seems to be impacting the outlook for the logistics industry. LTL rates did jump 20% on the news that Yellow may cease operations back in mid-July27, and FreightWaves’ Outbound Tender Volume Index is up 7% – which is an unseasonable movement for late July (28). We see something similar when we break apart responses that arrived in early (gold bars, capturing data from 7/1-7/17) versus late ( green bars, capturing data from 7/18-7/31) July. Transportation Prices were up 11.5 points and Transportation Utilization was up 11.6 points – both of which are statistically significant movements. No other metric showed anything close to this type of change in July. This early/late month shift is similar to what we saw in March of 2022 when the freight recession began. A lot would need to happen for transportation markets to recover, but this type of significant movement in transportation metrics would be the first step on that path.
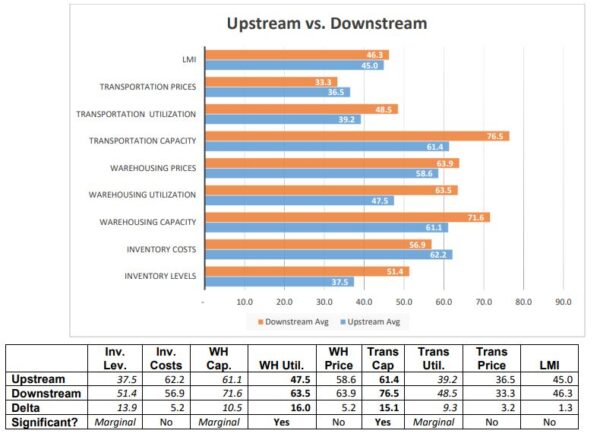
 Continuing the trend we have observed throughout most of 2023 we see more activity from our Downstream (orange bars) than from our Upstream (blue bars) respondents. Downstream firms report growth in Inventory Levels whereas Upstream firms continue to see contraction (51.4 to 37.5). We find a similar growth/contraction dynamic with Warehousing Utilization (63.5 for Downstream to 47.5 for Upstream). Transportation Utilization is contracting for both groups, but at a much slower rate – bordering on no movement – for Downstream firms (48.5 to 39.2). Despite the higher level of activity Downstream, we also see that both Warehousing and Transportation Capacity is growing faster Downstream than Upstream (expansion rates are higher for Downstream firms by 10.5 and 15.1 points respectively). This seeming dissonance in transportation markets may be due to the faltering capacity in LTL markets that were discussed above. For warehousing this is likely representative of the many fulfillment centers that were built for ecommerce. Some are just now coming online and others are now available after the expiration of contracts. This capacity is available everywhere, but there is more volume available for Downstream, customer-facing firms.
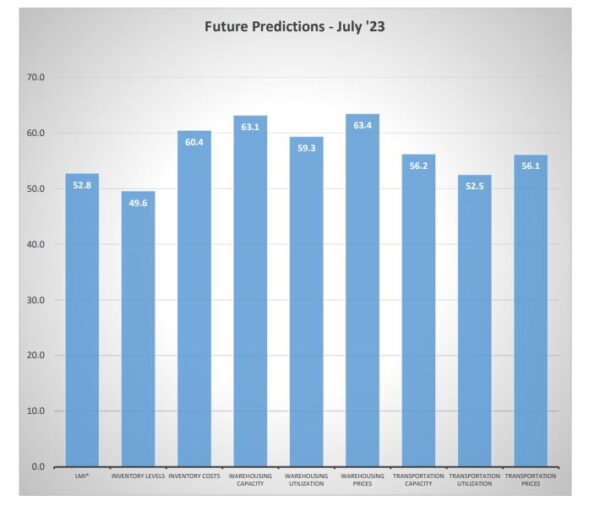
Respondents were asked to predict movement in the overall LMI and individual metrics 12 months from now. Expectations have been trending towards things “going back to normal” for most of 2023, that trend continued in July as the overall metric came in at 52.8 (-2.6). The slight decline in the overall level is due to predictions that Inventory Levels will decline slightly over the next 12 months (although as will be seen below, they are predicted to increase slightly for Downstream firms). The other seven sub-metrics show signs of moderate growth, ranging from 52.5 to 63.4. Respondents are still predicting capacity to grow across the board. But unlike what we have seen over the last year, they also believe that utilization and prices will grow along with them. While the current index remains in active contraction, this is the second consecutive month in which respondents have indicated that they anticipate more activity on the horizon.
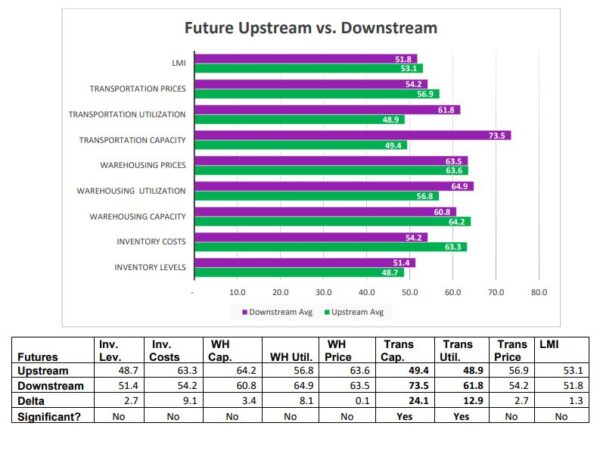
As mentioned above, we see some differences in the future predictions of Upstream (green bars) and Downstream (purple bars) respondents. While it is not a significant difference, Downstream firms expect to see Inventory Levels continue to build over the next 12 months and Upstream firms expect slight contraction (51.4 to 48.7). Despite this, Upstream firms expect Inventory Costs to grow more quickly (63.3 to 54.2). The most significant differences come in our transportation metrics. Downstream firms expect Transportation Utilization rates to expand at a steady pace (61.8) while Upstream firms anticipate a light contraction (48.9). This comes despite the massive 24.1-point difference in Transportation Capacity – but not in the direction one would imagine given the disparities discussed above. Despite their higher levels of activity, Downstream firms are anticipating significant increases (73.5) in available capacity that are on par with the rapid levels of growth we are seeing now. Upstream predictions are a far cry from this with respondents predicting slight contraction (49.4). This prediction may reflect the exits that we are beginning to see in the freight market and could be indicative of more exits to come. available transportation capacity has not contracted since March of 2022, so if such a rebalancing were to happen it would be a
major shift.
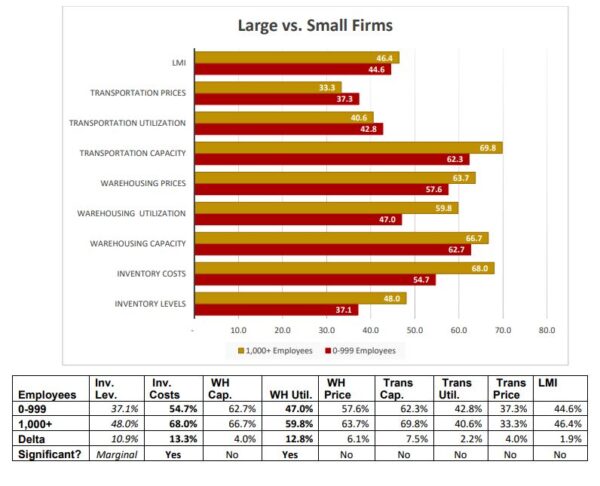
 In July we also broke respondents down by Larger firms (those with 1,000 employees or more, represented by gold lines) relative to smaller firms (those with 0-999 employers,represented by maroon lines). Statistically significant differences emerged for Inventory Levels, Inventory Costs, and Warehousing Utilization. Larger firm readings came in higher for all three of these metrics. Essentially, it seems that larger firms have higher levels of inventory which are driving up costs and leading them to utilize more of their available space (as opposed to smaller firms where Warehousing Utilization is actually contracting). Larger firms may have more cash on hand and be less worried about over-ordering than their smaller counterparts. It will be interesting to see if bigger firms drive imports and sales throughout the year, and if smaller firms begin to draw level as xwe move towards the fourth quarter.
 The index scores for each of the eight components of the Logistics Managers’ Index, as wellas the overall index score, are presented in the table below. The overall LMI is contracting at its fastest rate ever. Similar to May and June, three of the eight sub-metrics are contracting this month. Of the five sub-metrics that are expanding, three are doing so at a decreased rate and two (Inventory Costs and Warehousing Costs) are doing so at a faster pace.
Historic Logistics Managers’ Index Scores
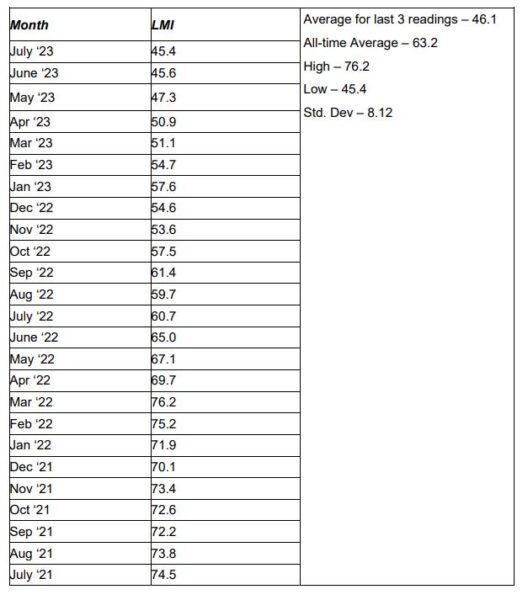
This period’s along with prior readings from the last two years of the LMI are presented table below:
LMI®
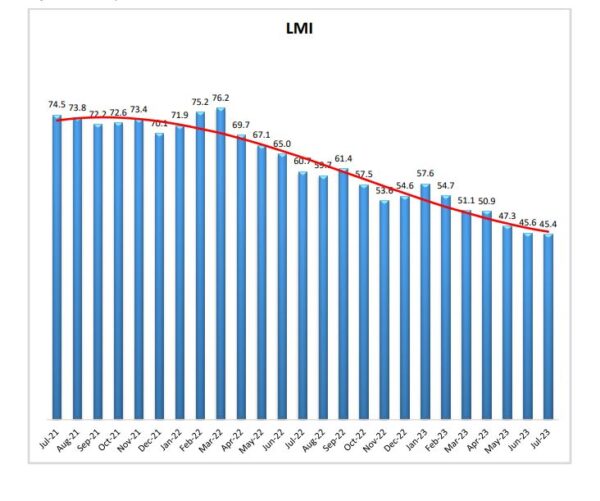
For the fifth consecutive month, the overall LMI has reached a new all-time low, reading in at 45.4 (-0.2). The overall index has only contracted three times in its nearly seven-year history and all of those have come in the last three months. The overall score is down 15.2-points from this time a year ago and down 29.1-points from July of 2021. This is driven by continued weakness in transportation and softening in the warehousing metrics that had been stalwarts throughout 2021. Both Upstream and Downstream firms showed contraction (45.0 and 46.3). Interestingly, respondents expect the contraction to cease over the next 12 months, predicting a moderate expansion of 52.8. This is lower (-2.6) than June’s future prediction of 55.4 but would still represent a welcome change from the ongoing slide we have seen in the
logistics industry over the last 16 months.
 Inventory Levels
The Inventory Level value is 41.9, down (-1.0) from June’s value of 42.9. This reading is 26.9 points lower than the same time last year, and down 24.5 from two years ago. This is only the fifth value indicating a contraction in inventory levels (i.e., below 50). This month is, in fact, the lowest value ever of the index. This month, Downstream respondents reported very slight inventory growth, while Upstream showed a significant contraction (51.4 vs 37.5). Last month, both Upstream (40.0) and Downstream (46.7) respondents reported inventory declines. We saw more pronounced difference when dividing respondents by size. Small firms had an average response of 37.1, while larger firms had an average of 48.0. It would seem that smaller firms are seeing a larger reduction in inventories than larger firms. Or, perhaps larger firms have reached the lowest point of their inventory levels and are starting to rebuild inventories. When asked to predict what conditions will be like 12 months from now, the average value is 49.6, higher than the current index value of 41.9. Upstream does show a decline at 48.7, while Downstream shows an increase at 51.4, but the difference is not statistically significant. The average value of 49.6 is a significant increase over last month’s value of 53.7.
 Inventory Costs
The current Inventory Costs index value reads in at 60.5, up (+3.4) from June’s reading of 57.1. The value is down 18.5 points from the value last year, and down 28.3 compared to two years ago. This month both Upstream and Downstream respondents reported a small increase (62.2 and 56.9). Consistent with Inventory Levels, small firms had an average response of 54.7, while larger firms had an average of 68.0. Above, we saw that smaller firms are seeing a larger reduction in inventories than larger firms. With costs, we see a similar relationship, in that larger firms are seeing larger impacts than smaller firms. However, with inventory levels, both large and small firms are seeing inventory reductions, but for inventory costs, both large and small are seeing cost increases. The small firms are seeing very small increased costs, while larger firms are seeing significant increases. Above, we saw that respondents expect inventory levels to be almost unchanged over the next 12 months (49.6). It might therefore be a bit surprising that inventory costs are expected to grow (60.4). However, there is a good chance that this reflects an expectation that interest rates will increase further. Upstream respondents returned a value of 63.3, while downstream returned a value of 54.2. The average value of 61.3 is virtually unchanged from the current cost number of 60.5.
 Warehousing Capacity
The July 2023 warehousing capacity index registered in at 64.4, reflecting a modest .9 percentage point increase from the month before. This reading is up by a staggering 17.4 points from July 2022 and up 23.3 points from the reading two years ago. This month also marks the 4th reading a row where the rate at which capacity has been growing is increasing. Further digging into the responses, we can observe that while there was a reasonable difference between Upstream (61.1) and Downstream (71.6) the difference was not statistically significant. The demand for capacity being higher Downstream maps to what we see with Warehousing Utilization as well. Exploring this metric on the small firm sample (62.7) vs. large firms (66.7) there is no statistical significance to the difference. Future predictions suggest capacity will continue to come online over the next year as respondents are expecting an expansion rate of 63.1, up (+2.6) from June’s future prediction of 60.9. Upstream and Downstream firms are both expecting growth, predicting expansion rates of 64.2 and 60.8 respectively.
Warehousing Utilization
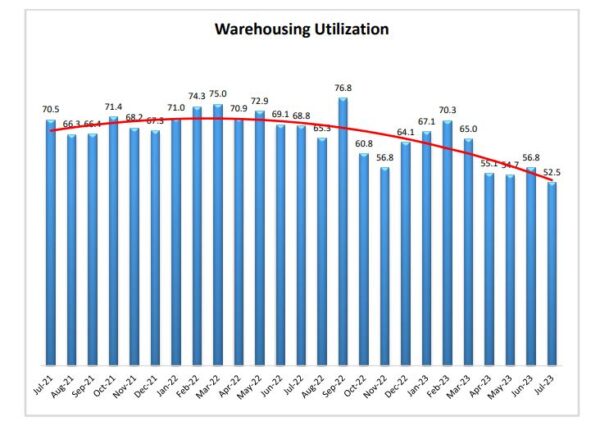
Warehousing Utilization reads in at 52.5, which is down (-4.3) from June’s reading of 56.8. This reading is down 16.3 points from the reading from one year ago, and down 18 points from the reading from two years ago. This reading is consistent with the larger trend from March 2023 in which utilization rates have been expanding at continuously slowing rates. Exploring the differences between Upstream (47.5) and Downstream (63.5respondents we see that a statistically significant 16-point difference. Such a shift indicates that for those downstream entities (e.g. retailers) the utilization rates are continuing to grow, whereas for the manufacturers the data indicate a decrease in the rate of demand in this segment. Interestingly, it seems that the 12.8 percentage point difference between small firms (47.0) and large firms (59.8) is statistically significant. Thus, it seems that the downstream entities (which very well may be the larger firms with numerous retail employees) and larger firms are seeing larger magnitudes of utilization on warehousing. Looking forward to the next 12 months, the predicted Warehousing Utilization index is 59.3, which is down (-3.5) from June’s future prediction of 62.8. Downstream firms are more bullish on future utilization, predicting an expansionary rate of 64.9 – 8.1 points higher than the Upstream prediction of 56.8-point growth.
Warehousing Prices
The Warehousing Price index reads in at 60.6, which is down (-2.7) from June’s reading of 63.3. This metric is now within striking distance of its all-time low of 59.0 which was reached in April of 2020. Whether or not it reaches or surpasses that nadir remains to be seen. July’s reading is down 15.6 points from the reading one year ago, nearly 28 points from July 2021. This reading continues the general downward trend for this index, suggesting that the previously pernicious rate at which warehouse pricing was growing, is now persistently softening (though there is still an increased rate of growth). Exploring the price increases Upstream (58.6) and Downstream (63.9) we see that this 5.2% difference is not statistically significant. Furthermore, exploring the differences between small firms (57.6) and larger firms (63.7) it seems that this 6.1 percentage point difference is not statistically significant. Future predictions suggest prices growth will remain healthy as respondents are expecting prices to continue to grow at a rate of 63.4, up (+2.5) from June’s future prediction of 60.9. predictions were consistent across the supply chain, with Upstream and Downstream respondents predicting growth rates of 63.6 and 63.5 respectively.
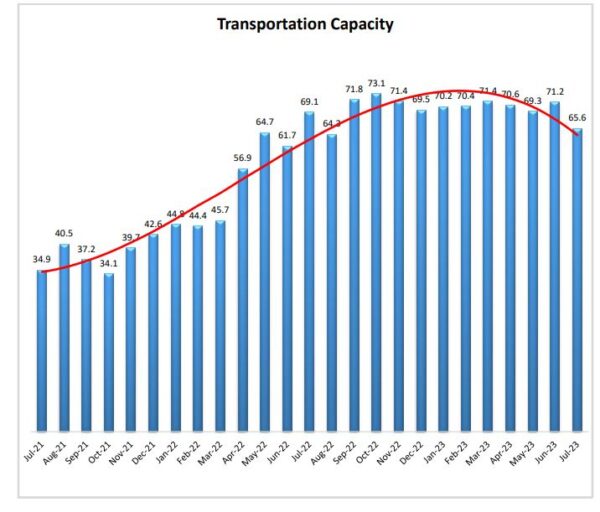
Transportation Capacity
The Transportation Capacity Index registered 65.6 percent in July 2023. This constitutes a decrease of 5.6 points from the June reading of 71.2. With this drop the Transportation Capacity Index has retreated somewhat from the all-time highs. Yet, despite this drop, the capacity index continues to indicate expansion, staying significantly above the critical threshold of 50. The drop is even more significant for the Upstream Transportation Capacity index which is at 61.4, while the Downstream index remains elevated at 76.5. The future transportation capacity index reads in at 56.2, corresponding to a small drop of .8 points from the previous reading of 57.0 and continuing to indicate expectations of slight growth. The Downstream Future Transportation Capacity index is significantly higher at 73.5 while the Upstream Future Transportation Capacity index dipped in the contraction territory and indicates 49.4.
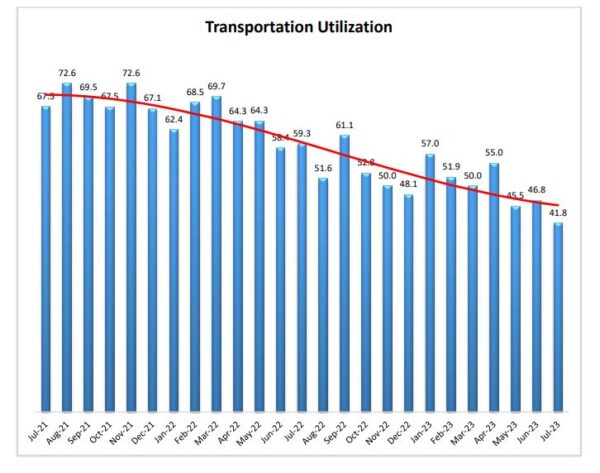
Transportation Utilization
The Transportation Utilization Index registered 41.8 in June 2023. This denotes a decrease of 5.0 points from last month’s reading. With this decrease, the Transportation Utilization index goes deeper into contraction territory and registers a new all-time low. This metric is bolstered by consumer-facing respondents as the Downstream Transportation Utilization Index is at 48.5, while the Upstream index is even lower at 39.2. We did see a shift in Transportation Utilization change as we moved through July. In the first half of July respondents reported a contraction rate of 37.3. This stands in stark contrast to late July, where respondents reported a significantly slower contraction rate of 48.9. Whether this is an aberration or an indication of a move back towards expansion remains to be seen. The future Transportation Utilization Index dropped significantly (-9.0) from June’s reading and indicates a 52.5 level for the next 12 months. As such, logistics managers expect diminished transportation activity growth over the near future. Once again, consumer-facing firms are expecting significantly more activity here. The future Downstream Transportation Utilization Index indicates expansion at 61.8, while the Upstream Transportation Utilization Index indicates contraction at 48.9.
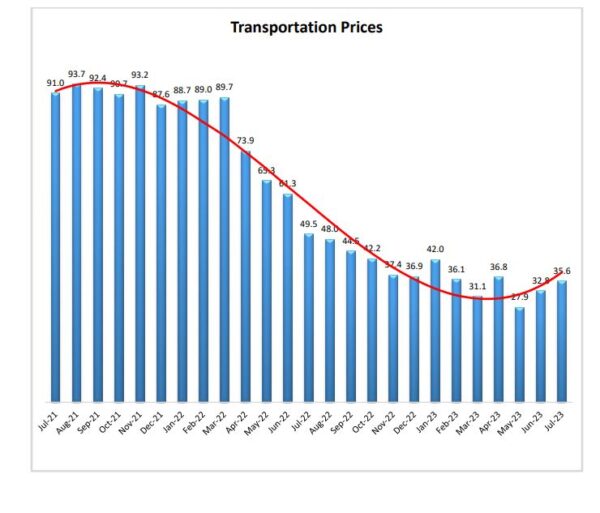
Transportation Prices
The Transportation Prices Index read in at 35.6 in July, up (+2.8) points from June’s reading of 32.8 as the metric continues to move away from the all-time low registered in May. Hence, the downward pressure on transportation prices continues to ease but the index remains solidly in contraction territory. This trend is widespread across the supply chain, with the Downstream Transportation Prices index at 33.3 and the Upstream index at 36.5. There are hints that this upward trend might continue into August. Like Transportation Utilization, the rate of contraction for Transportation Prices was significantly slower in late July (42.7) relative to early July (31.2). The future index for transportation prices remains above the critical level and is at 56.1, indicating expectations of slightly higher transportation prices in the next 12 months. The
downstream transportation prices index is at 54.2 while the upstream transportation prices index is at 56.9.
About This Report
The data presented herein are obtained from a survey of logistics supply executives based on information they have collected within their respective organizations. LMI® makes no representation, other than that stated within this release, regarding the individual company data collection procedures. The data should be compared to all other economic data sources when used in decision-making.
Data and Method of Presentation
Data for the Logistics Manager’s Index is collected in a monthly survey of leading logistics professionals. The respondents are CSCMP members working at the director-level or above. Upper-level managers are preferable as they are more likely to have macro-level information on trends in Inventory, Warehousing and Transportation trends within their firm.
Data is also collected from subscribers to both DC Velocity and Supply Chain Quarterly as well. Respondents hail from firms working on all six continents, with the majority of them working at firms with annual revenues over a billion dollars. The industries represented in this respondent pool include, but are not limited to: Apparel, Automotive, Consumer Goods, Electronics, Food & Drug, Home Furnishings, Logistics, Shipping & Transportation, and Warehousing.
Respondents are asked to identify the monthly change across each of the eight metrics collected in this survey (Inventory Levels, Inventory Costs, Warehousing Capacity,
Warehousing Utilization, Warehousing Prices, Transportation Capacity, Transportation Utilization, and Transportation Prices). In addition, they also forecast future trends for each metric ranging over the next 12 months. The raw data is then analyzed using a diffusion index. Diffusion Indexes measure how widely something is diffused or spread across a group. The Bureau of Labor Statistics has been using a diffusion index for the Current Employment Statics program since 1974, and the Institute for Supply Management (ISM) has been using a diffusion index to compute the Purchasing Managers Index since 1948.
The ISM Index of New Orders is considered a Leading Economic Indicator.
We compute the Diffusion Index as follows:
PD = Percentage of respondents saying the category is Declining,
PU = Percentage of respondents saying the category is Unchanged,
PI = Percentage of respondents saying the category is Increasing,
Diffusion Index = 0.0 * PD + 0.5 * PU + 1.0 * PI
For example, if 25 say the category is declining, 38 say it is unchanged, and 37 say it is increasing, we would calculate an index value of 0*0.25 + 0.5*0.38 + 1.0*0.37 = 0 + 0.19 + 0.37 = 0.56, and the index is increasing overall. For an index value above 0.5 indicates the category is increasing, a value below 0.5 indicates it is decreasing, and a value of 0.5 means the category is unchanged. When a full year’s worth of data has been collected, adjustments will be made for seasonal factors as well.
1 Page, P. (2023a, July 7). Logistics Companies Slashed Payrolls Last Month in Faltering Shipping Market.
Wall Street Journal. https://www.wsj.com/articles/logistics-companies-slashed-payrolls-lastmonth-in-faltering-shipping-market-7a75e7d0
2 Omeokwe, A., Torry, H., & Timiraos, N. (2023, July 28). Inflation and Wage Growth Ease as Fed
Considers Next Move. Wall Street Journal. https://www.wsj.com/articles/wages-and-inflationease-as-fed-considers-next-move-a6abd49b
3 Casselman, B. (2023, July 28). Wage Growth Slowed in Second Quarter, a Sign the Economy is Cooling. The New York Times. https://www.nytimes.com/2023/07/28/business/inflation-wageseconomy.html
4 Mena, B. (2023, July 27). The US economy grew stronger than expected in the second quarter, but
consumers are pulling back | CNN Business. CNN.
5 Timiraos, N. (2023, July 26). Federal Reserve Raises Interest Rates to 22-Year High. Wall Street Journal. https://www.wsj.com/articles/federal-reserve-raises-interest-rates-to-22-year-high-3c3e499c
6 Leonhardt, D., & Philbrick, I. P. (2023, July 27). The Fed’s Difficult Choice. The New York Times. https://www.nytimes.com/2023/07/27/briefing/federal-reserve-rate-increase.html
7 Cambon, S. C., & Robles, C. (2023, July 27). U.S. Economic Growth Accelerates, Defying Slowdown
Expectations. Wall Street Journal. https://www.wsj.com/articles/us-gdp-report-economicgrowth-92482437
8 Federal Reserve Bank of Atlanta. (2023, July 28). GDPNow. https://www.atlantafed.org/cqer/research/gdpnow
9 Ojea, S. (2023, July 20). Knight-Swift Profit Plunges on Weak Trucking Demand. Wall Street Journal. https://www.wsj.com/articles/knight-swift-profit-plunges-on-weak-trucking-demand-61ca115e
10 University of Michigan. (2023, July 21). Surveys of Consumers. Surveys of Consumers – Final Results for July 2023. http://www.sca.isr.umich.edu/
11 Feuer, W. (2023, July 18). Prologis Boosts Outlook on Record Quarterly Earnings. Wall Street Journal. https://www.wsj.com/articles/prologis-boosts-outlook-on-record-quarterly-earnings-c47d3328
12 Nassauer, S., & Cole, D. (2023, July 28). Inside Walmart’s Warehouse of the Future. Wall Street Journal. https://www.wsj.com/articles/inside-walmarts-warehouse-of-the-future-6f17d17a
13 Young, L. (2023a, July 3). A Red-Hot Market for Warehouse Workers Has Cooled Off. Wall Street Journal. https://www.wsj.com/articles/a-red-hot-market-for-warehouse-workers-has-cooledoff-859f3727
14 Josephs, L. (2023, July 25). UPS, Teamsters reach labor deal to avoid strike. CNBC. https://www.cnbc.com/2023/07/25/ups-teamsters-reach-contract-to-avoid-strike-unionsays.html
15 Solomon, M. (2023b, July 27). UPS shippers may face double-digit rate increases in wake of contract. FreightWaves. https://www.freightwaves.com/news/ups-shippers-may-face-double-digit-rateincreases-in-wake-of-contract
16 Roeloffs, M. W. (2023, July 17). UPS Strike Could Cost U.S. Economy Billions—Here’s How It Would Impact Consumers And Businesses. Forbes. https://www.forbes.com/sites/maryroeloffs/2023/07/17/ups-strike-could-cost-us-economybillions-heres-how-it-would-impact-consumers/
17 Anderson Economic Group. (2023, July 14). Potential UPS Strike Could Be Costliest in a Century. Anderson Economic Group, LLC. https://www.andersoneconomicgroup.com/potential-upsstrike-could-be-costliest-in-a-century/
18 Solomon, M. (2023a, July 6). FedEx advises UPS shippers to get on board now. FreightWaves. https://www.freightwaves.com/news/fedex-advises-ups-shippers-to-get-on-board-now
19 Nassauer, S., & Page, P. (2023, July 29). WSJ News Exclusive | Trucking Giant Yellow Shuts Down Operations. Wall Street Journal. https://www.wsj.com/articles/the-fall-of-a-trucking-giant-whyyellow-is-on-the-verge-of-collapse-3724f662
20 Ojea, S. (2023, July 20). Knight-Swift Profit Plunges on Weak Trucking Demand. Wall Street Journal. https://www.wsj.com/articles/knight-swift-profit-plunges-on-weak-trucking-demand-61ca115e
21 Kingston, J. (2023a, July 26). Ryder forecasts improved finances despite Q2 earnings decline.FreightWaves. https://www.freightwaves.com/news/ryder-forecasts-improved-financesdespite-q2-earnings-decline
22 Kingston, J. (2023b, July 28). Saia Q2 earnings: Tonnage and shipments down by small amount.FreightWaves. https://www.freightwaves.com/news/saia-q2-earnings-tonnage-and-shipmentsdown-by-small-amount
23 Mahoney, N. (2023, July 27). Hub Group’s Q2 earnings tumble in ‘challenging’ freight economy.FreightWaves. https://www.freightwaves.com/news/hub-group-q2-earnings-tumble-inchallenging-economy
24 Xie, S. Y. (2023, July 31). China’s Economic Recovery Weakens as Growth Concerns Linger. Wall StreetJournal. https://www.wsj.com/articles/chinas-economy-stutters-forward-as-growth-concernslinger-1be8acb2
25 Page, P. (2023b, July 25). Peak Shipping Season Is Fizzling Out for Freight Companies. Wall Street Journal. https://www.wsj.com/articles/peak-shipping-season-is-fizzling-out-for-freightcompanies-900ab2f6
26 Berger, P. (2023, July 20). Trucker Yellow Is Losing Customers as Teamsters Strike Looms. Wall Street Journal. https://www.wsj.com/articles/trucker-yellow-is-losing-customers-as-teamsters-strikelooms-2c47bcdc
27 Strickland, Z. (2023a, July 23). LTL rates bounce as Yellow struggles with union. FreightWaves. https://www.freightwaves.com/news/ltl-rates-bounce-as-yellow-struggles-with-union
28 Strickland, Z. (2023b, July 30). Unseasonable rise in demand provides much-needed optimism for transportation providers. FreightWaves. https://www.freightwaves.com/news/unseasonablerise-in-demand-provides-much-needed-optimism-for-transportation-providers