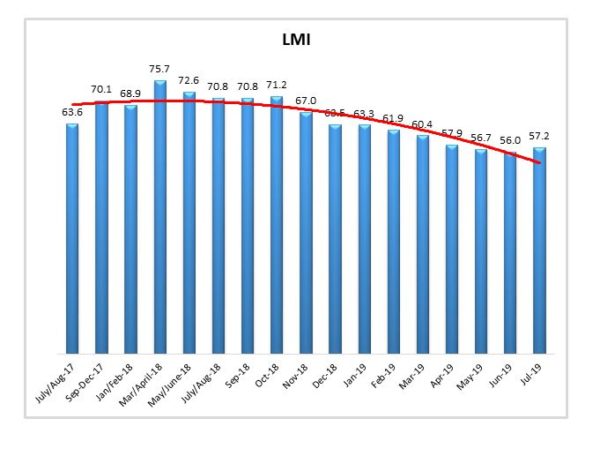
- LMI® at 57.2%
- Growth is INCREASING AT AN INCREASING RATE for: Inventory Levels, Inventory Costs, Warehousing Utilization, and Warehousing Prices
- Growth is INCREASING AT A DECREASING RATE for: Warehousing Capacity and Transportation Capacity
- Transportation Prices are DECREASING
According to a sample of North American logistics executives, growth continued (although at a decreasing rate) across the logistics sector in July 2019. Although the overall index is up slightly, Transportation Prices, which have been the LMI metric most predictive of the economy, is DECREASING. This is the second time in three months that Transportation Price, which had often been the highest-scoring metric through most of 2018, has reported a decrease. The overall LMI is up for the first time after seven consecutive months in decline. That being said, July 2019 was the third lowest score in the history of the index (greater than only May and June of 2019), and well below the historical average of 64.1. It is also down significantly from this time a year ago, when it registered at 70.8. With that being said, July’s score of 57.2 is still above 50.0, which indicates growth in the logistics industry.
Researchers at Arizona State University, Colorado State University, Rochester Institute of Technology, Rutgers University, and the University of Nevada, Reno, and in conjunction with the Council of Supply Chain Management Professionals (CSCMP) issued this report today.
Results Overview
The LMI score is a combination eight unique components that make up the logistics industry, including: inventory levels and costs, warehousing capacity, utilization, and prices, and transportation capacity, utilization, and prices. The LMI is calculated using a diffusion index, in which any reading above 50 percent indicates that logistics is expanding; a reading below 50 percent is indicative of a shrinking logistics industry. The latest results of the LMI summarize the responses of supply chain professionals collected in July 2019. Six of the eight metrics read in below their historical average. Only Transportation Capacity and Inventory Levels come in above average.
Transportation metrics have been the most dynamic over the history of the LMI®. Transportation Prices are detracting for the second time in three months, down slightly (-1.75) to 49.2, which suggests a very marginal decrease. This is a vast difference from a year ago. In July 2018 Transportation Prices were growing at a rate of 92.7, making for a 43.5 point drop over the course of the year. The change index used by the LMI® ranges from 0-100, so to go from growing at close to the fastest rate possible to contracting in the span of 12 months suggests a significant shift in the market. This lack of growth, with the continued (although slowed) growth of Transportation Capacity (62.7, up from 38.4 at this time a year ago) corroborate recent reports of slowing freight markets, which some have termed a “freight recession”[1].
Warehouse Prices read in at 66.2, which is up from June (+10.4) but still down sharply from July 2018 when they were at 80.4. Warehouse Capacity (-2.86), continues to hover close to 50.0 as it has all year. This likely indicates that the supply of warehouses seems to be close to satisfying market demand. Warehousing Utilization (+0.8) and Inventory Costs (0.02) continue to grow at nearly the same pace as they did in June. Inventory Levels are up (+2.65) to 67.2. This is above the historical average of 63.5, and may be reflective of the strong consumer spending that continues to buoy the overall U.S. economy[2].
The index scores for each of the eight components of the Logistics Managers’ Index, as well as the overall index score, are presented in the table below. All seven of eight metrics are up, but many are moving at low or considerably decreased rates. The overall LMI® index score is down to its lowest point in the history of the index, but still indicates growth in the logistics industry.
| LOGISTICS AT A GLANCE | |||||
| Index | July 2019 Index | June 2019 Index | Month-Over-Month Change | Projected Direction | Rate of Change |
| LMI® | 57.2 | 56.0 | +1.23 | Growing | Increasing |
| Inventory Levels | 67.2 | 64.5 | +2.65 | Growing | Increasing |
| Inventory Costs | 71.2 | 71.2 | +0.02 | Growing | Increasing |
| Warehousing Capacity | 51.5 | 54.3 | -2.86 | Growing | Decreasing |
| Warehousing Utilization | 64.9 | 64.1 | +0.80 | Growing | Increasing |
| Warehousing Prices | 66.2 | 65.1 | 1.04 | Growing | Increasing |
| Transportation Capacity | 62.7 | 67.29 | -2.61 | Growing | Decreasing |
| Transportation Utilization | 53.2 | 51.5 | +1.63 | Growing | Increasing |
| Transportation Prices | 49.2 | 51.0 | -1.75 | Contracting | From Increasing |
Future predictions indicate that respondents predict an increase in all eight LMI® metrics over the next 12 months. Over the past two years, LMI® respondents have been very accurate in their future predictions. Future predictions for LMI components 12 months from now are displayed below:
Historic Logistics Managers’ Index Scores
This period’s along with all prior readings of the LMI are presented table below. The values have been updated to reflect the method for calculating the overall LMI:
| Month | LMI | Average for previous readings – 64.1
High – 75.71 Low – 56.0 Std. Dev – 5.48 |
| July ‘19 | 57.2 | |
| June ‘19 | 56.0 | |
| May’19 | 56.7 | |
| April ‘19 | 57.9 | |
| March ‘19 | 60.41 | |
| February ‘19 | 61.95 | |
| January ‘19 | 63.33 | |
| December ‘18 | 63.54 | |
| November ‘18 | 66.98 | |
| October ‘18 | 71.20 | |
| September ‘18 | 70.80 | |
| July/August ‘18 | 70.80 | |
| May/June ‘18 | 72.55 | |
| March/April ‘18 | 75.71 | |
| January/February‘18 | 68.89 | |
| September-December ‘17 | 70.09 | |
| July/August ‘17 | 63.64 | |
| May/June ‘17 | 62.02 | |
| Mar/April ‘17 | 60.76 | |
| Jan/Feb ‘17 | 61.69 | |
| Nov/Dec ‘16 | 61.79 | |
| Oct ‘16 | 60.36 | |
| Sep ‘16 |
LMI®
The overall LMI index is 57.2 in the July 2019 reading, up very slightly from June’s index score of 56.0. This is also down considerably from a year ago when the LMI overall score was 70.8. It has trended down since then, with rates of growth decreasing in every period since October 2018 to June 2019, with this month’s reading being the first increase in 2019. That being said it is still the third-lowest overall score in the history of the index, and lower than the historical average of 64.1.
While the overall LMI scores in 2019 have been lower than 2018, they have all still com in above 50.0, the threshold indicating growth. So the logistics industry is still growing, just at a much slower pace than last year. This slowdown is demonstrated by the trend-line in the figure below.
Looking forward, respondents predict the overall LMI will continue to grow over the next year, predicting an overall index score of 59.7. This indicates an expectation of similar levels of steady, if unspectacular growth, in the logistics industry through early 2020.
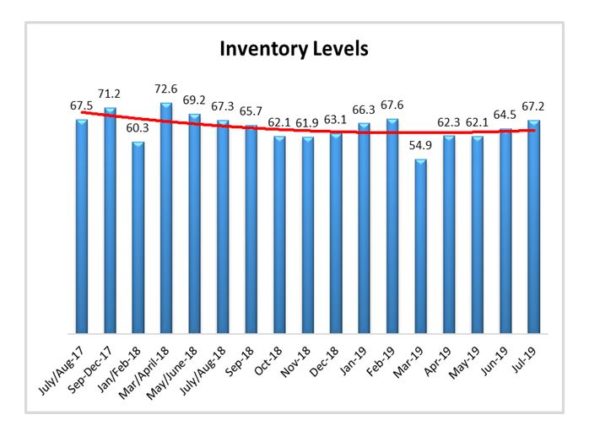
Inventory Levels
The Inventory Level index is 67.2, which indicates that inventory levels are continuing to rise. The current value is 2.7 points above the previous level, indicating a slight change in the amount of increase. This value is essentially equal to the value a year ago, 0.1 points below that level, which was one period after the highest value recorded for the index. After that high, the index declined for most of 2018, and except for one reading, has remained in the low to mid-60s for the past year, indicating continued growth. The current reading of 67.2 is above the all-time average value for this metric, which is 63.5.
When asked to predict what will conditions will be like 12 months from now, the average value is 60.4, indicating inventory levels are expected to continue to grow. This value is slightly above month’s year-ahead prediction of 58.6, and still consistent with a prediction of increasing levels next year.
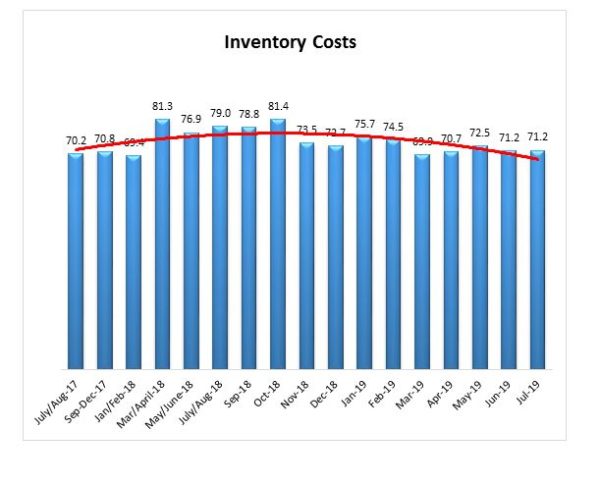
Inventory Costs
Given the continued levels of inventory growth, it is not surprising that inventory costs continue to increase. The current value is 71.2, and any value above 50 indicates growth, and respondents say inventory costs have continued to climb, significantly. These continued high levels indicate strong continued growth in inventory costs, and are only slightly below the long-term average of 72.3. That being said, the current value is 7.8 points lower than the 79.0 value last year at this time, meaning cost growth has fallen somewhat in the past year.
The continued growth of both inventory levels and inventory costs could be related to the fact that warehousing capacity has decreased slightly or not grown significantly in recent periods. Because inventory levels are continuing to increase, and warehousing capacity is anemic, it seems likely costs will continue to rise. When asked about what they expect inventory costs to be like 12 months from now, the index value is 65.9. Respondents clearly expect inventory costs to continue to be high for the next 12 months.
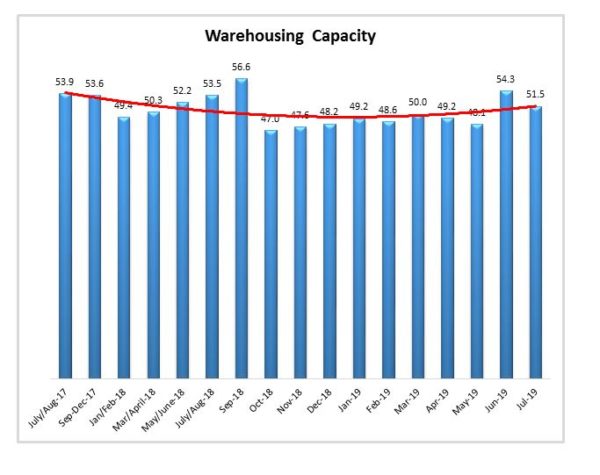
Warehousing Capacity
The Warehousing Capacity Index registered 51.5 percent in July 2019. This represents a modest decline of 2.8 points from the June 2019 reading and a 2 point decrease from the reading one year ago. Also of note, this reading is in line with previous readings during this time, which may indicate a seasonality in the early to mid-parts of the summer(s). The slight contraction of warehousing capacity may be indicative of a stockpiling effect due to recent tariffs coming into effect. 51.5 is near the threshold of 50.0, which would indicate a contraction.
Looking forward at the next 12 months, the predicted Warehousing Capacity index is 58.2, which is up slightly (+0.7) from June’s prediction.
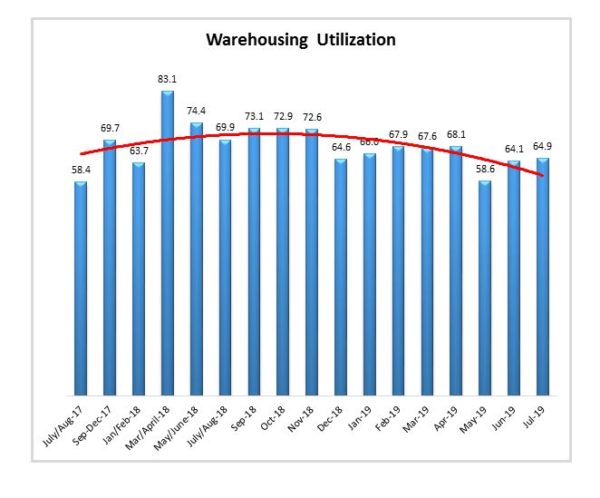
Warehousing Utilization
The Warehousing Utilization Index registered 64.9 percent in July 2019. Virtually unchanged (.8 percentage point increase), and 5 points down from the July/Aug 2018 reading of 69.9 This reading accentuates previous indications that there may be a shift in the market, and given the slight contraction in the capacity of warehousing, this suggests a tightening in the warehousing space.
Looking forward at the next 12 months, the predicted Warehousing Utilization index is 69.4, up slightly (+1.3) from June’s prediction, indicating that firms anticipate utilizing existing warehouse capacity consistently over the next year.
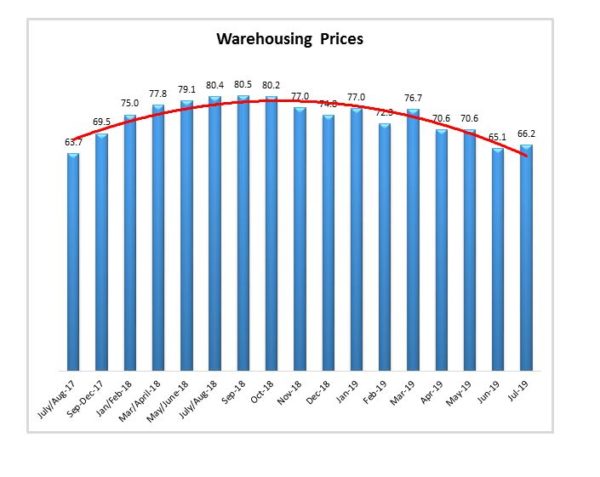
Warehousing Prices
Warehousing Prices Index registered 66.2 5.1 percent in July 2019. This is up (+1.1) slightly from June 2019. This reading is sharply down 14 points from one year ago. With the increase of the warehousing capacity, the increase in utilization, this continued decrease in the rate of price suggests that the market is responding to previous pressure in the warehousing market through price augmentation.
Looking forward at the next 12 months, the predicted Warehousing Prices index is 75.0, up sharply (+7.0) from June’s prediction. This indicates that firms are expecting an increase growth in Warehouse Prices over the next 12 months.
Transportation Capacity
The Transportation Capacity Index registered 62.7 percent in July 2019. This is a decrease of 2.6 percentage points from the June reading of 65.3. This is the third consecutive decrease since the historical high registered in April 2019. Decreasing Transportation Prices may be contributing to the higher usage of available capacity. This month’s index score is up significantly from a year ago when it was contracting at a rate of 38.4.
It should also be noted the data indicates a score of 56.3 percent for the next year. This is consistent with the current reading and is down slightly (-2.5) relative to June’s future expectations.
![]()
Transportation Utilization
The Transportation Utilization Index registered 53.2 percent in July 2019. This is an increase of 1.7 percentage points from the June reading of 51.5. This is an increase of 2 percentage points from the June reading of 51.5 percent, was the lowest level ever recorded over the course of the LMI. Transportation Utilization and is close to the benchmark level of 50 that denotes the inflection point from growth to decline.
Our future Transportation Utilization Index also indicates a 59.7 percent level for the next 12 months, which is nearly identical (+0.2) to future expectations from June.
![]()
Transportation Prices
The Transportation Prices Index registered 49.2 percent in July 2019. This is a 1.8 percent decrease from the June 2019 transportation prices reading of 51.0. The 49.2 reading is slightly below the critical 50 percent that separates growth and decline. July 2019’s reading is 43.5 points reading lower than July 2018’s.
The future expectations for transportation prices are at 61.5 indicating modest growth over the next 12 months. This is up (+2.6) from June’s prediction.
![]()
About This Report
The data presented herein are obtained from a survey of logistics supply executives based on information they have collected within their respective organizations. LMI® makes no representation, other than that stated within this release, regarding the individual company data collection procedures. The data should be compared to all other economic data sources when used in decision-making.
Data and Method of Presentation
Data for the Logistics Manager’s Index is collected in a monthly survey of leading logistics professionals. The respondents are CSCMP members working at the director-level or above. Upper-level managers are preferable as they are more likely to have macro-level information on trends in Inventory, Warehousing and Transportation trends within their firm. Data is also collected from subscribers to both DC Velocity and Supply Chain Quarterly as well. Respondents hail from firms working on all six continents, with the majority of them working at firms with annual revenues over a billion dollars. The industries represented in this respondent pool include, but are not limited to: Apparel, Automotive, Consumer Goods, Electronics, Food & Drug, Home Furnishings, Logistics, Shipping & Transportation, and Warehousing.
Respondents are asked to identify the monthly change across each of the eight metrics collected in this survey (Inventory Levels, Inventory Costs, Warehousing Capacity, Warehousing Utilization, Warehousing Prices, Transportation Capacity, Transportation Utilization, and Transportation Prices). In addition, they also forecast future trends for each metric ranging over the next 12 months. The raw data is then analyzed using a diffusion index. Diffusion Indexes measure how widely something is diffused, or spread across a group. The Bureau of Labor Statistics has been using a diffusion index for the Current Employment Statics program since 1974, and the Institute for Supply Management (ISM) has been using a diffusion index to compute the Purchasing Managers Index since 1948. The ISM Index of New Orders is considered a Leading Economic Indicator.
We compute the Diffusion Index as follows:
PD = Percentage of respondents saying the category is Declining,
PU = Percentage of respondents saying the category is Unchanged,
PI = Percentage of respondents saying the category is Increasing,
Diffusion Index = 0.5 * PD + 0.5 * PU + 1.0 * PI
For example, if 25% say the category is declining, 38% say it is unchanged, and 37% say it is increasing, we would calculate an index value of 0*0.25 + 0.5*0.38 + 1.0*0.37 = 0 + 0.19 + 0.37 = 0.56, and the index is increasing overall. For an index value above 0.5 indicates the category is increasing, a value below 0.5 indicates it is decreasing, and a value of 0.5 means the category is unchanged. When a full year’s worth of data has been collected, adjustments will be made for seasonal factors as well.


