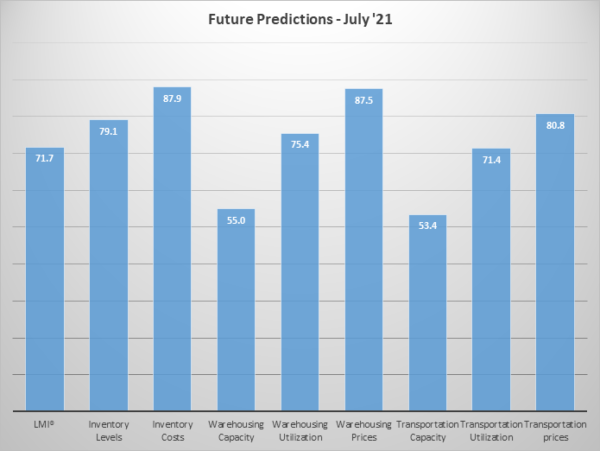
Growth is INCREASING AT A DECREASING RATE for: Inventory Levels, Inventory Costs, Warehousing Utilization, Warehousing Prices, and Transportation Utilization, Growth INCREASING AT AN INCREASING RATE for: Transportation Prices Warehousing Capacity and Transportation Capacity are CONTRACTING
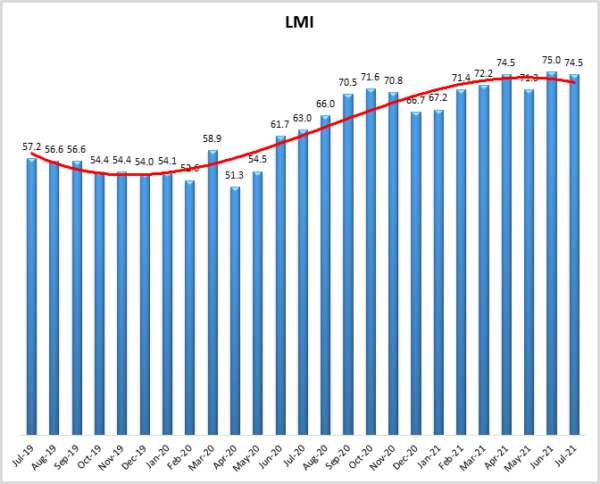
July 2021’s LMI comes in at 74.5, tied for the third-highest in the history of the index. The overall index rate has now come in above the 70-point mark in six consecutive months, breaking last month’s record as the longest streak in the history of the LMI. The six-month average of 73.2 is the highest observed for any half year during the history of the index. February-July 2021 represents the largest expansion in the logistics industry since we have been tracking it, something that seems to reflect the sentiment of many LMI respondents through mid-summer. It will be interesting to see if this rate of growth can continue as firms begin to stock up for Q4.
Researchers at Arizona State University, Colorado State University, Rochester Institute of Technology, Rutgers University, and the University of Nevada, Reno, and in conjunction with the Council of Supply Chain Management Professionals (CSCMP) issued this report today.
Results Overview
The LMI score is a combination of eight unique components that make up the logistics industry, including inventory levels and costs, warehousing capacity, utilization, and prices, and transportation capacity, utilization, and prices. The LMI is calculated using a diffusion index, in which any reading above 50 percent indicates that logistics is expanding; a reading below 50 percent is indicative of a shrinking logistics industry. The latest results of the LMI summarize the responses of supply chain professionals collected in July 2021. As we have seen for most of the last year, June LMI displays continued expansion in the logistics industry. Overall, the LMI is down slightly (-0.5) in July from June’s reading of 75.0. While the rate of growth has decreased, it still represents the third-highest score in the history of the index and a significant rate of expansion in the logistics industry. The growth in this month’s index is fueled by metrics from across the index, with all three price indices reading in at 88.0 or above.
Among these high price indices are Warehousing Prices, which are up (+2.6) to 88.0, the all-time high for this metric. The high prices are being fueled by multiple factors. Chief among these is the lack of available capacity. Vacancy rates in the U.S. are at 4.8%, but this figure drops dramatically in areas near ports, which continue to suffer from extended backlogs. This is epitomized by the vacancy rates in the inland empire, which fell to a paltry 1.7% in July[1]. Large metropolitan areas are also suffering from a lack of capacity as firms fight to position their goods close enough to consumers to allow for next- or same-day delivery. The lack of capacity is reflected in our metrics as well, with Warehouse Capacity contracting for the 11th straight month at a rate of 41.1. The lack of capacity and high prices have led to a continued level of growth in Warehousing Utilization, which while down (-5.0), is increasing at a rate of 70.5.
The leading cause of the pressure on warehousing networks is the ongoing proliferation of inventories. Inventory levels continue to grow in July, down slightly (-1.5) but still growing at a rate of 66.4 – still well above the all-time average growth rate of 61.1. This is being driven partially by tightness in other parts of the supply chain. Firms are dealing with this by abandoning JIT principles and ordering earlier and in larger quantities to avoid stockouts. Companies such as Hasbro are not only increasing forward buying but also increasing the number of container lines they work within in an attempt to ensure the availability of their products for Q4[2]. They are not the only ones to increase imports, even with the shortage of key components, orders for durable goods such as automobiles and appliances were up in June – marking the 13th time out of the last 14 months that demand for these products has grown. This signals continued consumer and industrial confidence in the face of inflation and parts shortages[3]. Due to this increased ordering, The Port of LA is currently operating at approximately 160% of capacity[4]. The tightness is leading to high costs, with firms like P&G predicting issues due to high materials and transportation costs, leading to a predicted $1.9 billion hit for the fiscal year beginning July 1st. Colgate Palmolive and Unilever have reported grappling with similar issues[5]. This is consistent with our Inventory Cost metrics, which read in at 88.8 – barely down (-0.6) from June’s all-time high of 89.4. These high costs are being felt now by consumers. Food and beverage producers such as AB InBev, Anheuser Busch, Nestle, and Danone are indicating that they will push the costs associated with product and transportation shortages onto consumers over the next year[6]. Whether this will stem consumer demand remains to be seen.
The strain of this excess inventory is being felt on Transportation networks where available capacity read in at 34.9 in July. As a result, Transportation Prices continue to grow, up (+3.8) to 91.0. The lack of capacity and high associate prices are manifesting both internationally and domestically. Internationally, container prices continue to climb, up 108% week-over-week from China to the West Coast in late July to $13,666 and 52% from China to the East Coast to $16,008[7]. This is more than quadrupled from this time a year ago. So far in 2021, 695 ships arrived to U.S. West Coast late – an eye-popping increase compared to the 1,535 total late arrivals from 2021-2020. The shortage of available capacity is essentially turning the booking process for international shipping into a bidding war[8]. Some containers are even selling for $32,0004. Adding to the shipping issues, July saw a production slowdown in Vietnam and Bangladesh due to COVID outbreaks[9]. The ripples of the container shortage have turned Chicago’s freight-switching terminals into a snarled mess; acting as a bottleneck for material moving cross-country. Shipments to Chicago are up 32% y-o-y in the second quarter, and up 18% from Q2 pre-pandemic in 2019[10]. Union Pacific paused container movement for a week in late July, and BNSF significantly reduced traffic in attempts to clear out backlog ahead of the buildup to the holiday season.
And so, we have a situation in which the stress currently being felt across inventory, warehousing, and transportation metrics are linked. Due to the tightness in transportation capacity, many firms are placing larger than normal orders to avoid stockouts. Partially due to the large orders coming in from overseas to meet this demand, warehouses are full and space is difficult to find. The glut of inventory also increases demand for transportation, leading to a positive feedback loop in which the tightness in the different sectors of the logistics industry is propagating further tightness in one another.
The chart below demonstrates the shift in aggregate logistics capacity (pink line) and aggregate logistics price (green line) over the last two years and provides a visual representation of why so many firms are having difficulty with their supply chains. 150.0 represents the “breakeven” mark. In July 2019, Both aggregate logistics capacity and aggregate logistics prices were growing at moderate rates of 171.3 and 186.6 respectively –a 15.3-point spread). One year later, during the height of lockdowns, the spread had grown to 70.0 points, today, it stands at 153.8. In July 2021 aggregate capacity contracting was steeply at a rate of 114.0 – the all-time low, and aggregate price growing at a rate of 267.8 – the all-time high. In the span of two years, price and capacity went from moderate levels of growth to moving at record-setting paces. When viewed through this lens, it is no wonder that there have been so many reports of back-breaking prices extended lead times.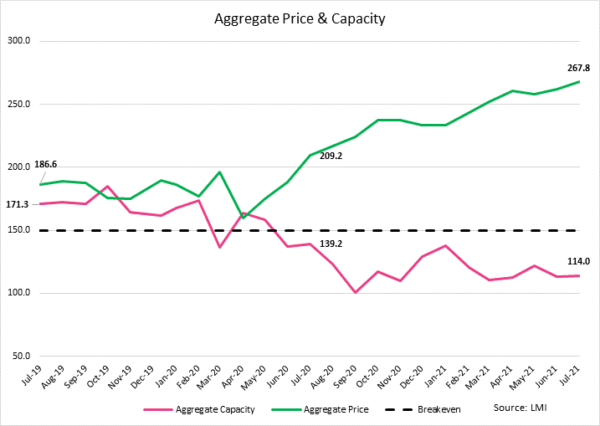
The index scores for each of the eight components of the Logistics Managers’ Index, as well as the overall index score, are presented in the table below. Six of the eight metrics show signs of growth, albeit at declining rates, while both capacity metrics continue their runs of contraction. The logistics industry remains tight and based on future predictions and industry experts seem likely to stay that way through the rest of the year.
| LOGISTICS AT A GLANCE | |||||
| Index | July 2021 Index | June 2021 Index | Month-Over-Month Change | Projected Direction | Rate of Change |
| LMI® | 74.5 | 75.0 | -0.4 | Growing | Decreasing |
| Inventory Levels | 66.4 | 67.8 | -1.5 | Growing | Decreasing |
| Inventory Costs | 88.8 | 89.4 | -0.6 | Growing | Decreasing |
| Warehousing Capacity | 41.1 | 40.7 | +0.4 | Contracting | Increasing |
| Warehousing Utilization | 70.5 | 75.5 | -5.0 | Growing | Decreasing |
| Warehousing Prices | 88.0 | 85.4 | +2.6 | Growing | Increasing |
| Transportation Capacity | 34.9 | 34.5 | +0.4 | Contracting | Increasing |
| Transportation Utilization | 67.5 | 69.7 | -2.2 | Growing | Decreasing |
| Transportation Prices | 91.0 | 87.3 | +3.8 | Growing | Increasing |
This month, both upstream (blue bars) and downstream (orange bars) firms reported significant continued growth in the utilization of logistics services. We observed some differences across Inventory Costs and in available Transportation Capacity.
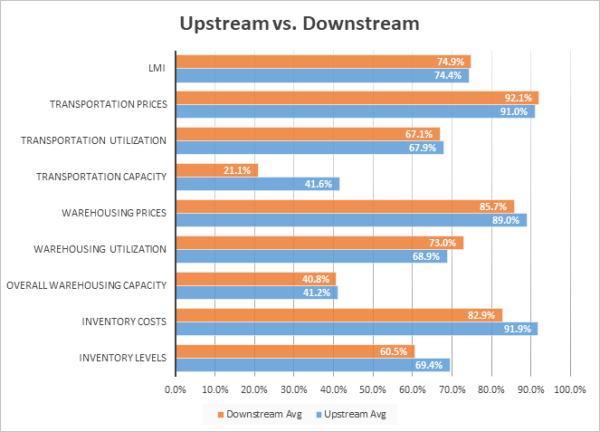
T-tests demonstrate that downstream firms dealing with a significantly greater crunch on Transportation Capacity than their upstream counterparts. All firms are struggling to find available capacity, but downstream firms are reporting a contraction approximately 20 points more severe than upstream firms. This is reflective of the difficulty retailers are having both in delivering orders on time to consumers (many online retailers are now publishing caveats that service may be slower than normal), as well as getting the finished goods in from their upstream suppliers. Interestingly, upstream firms report significantly higher inventory costs (9-points higher at 91.9 to 82.9). Inventory Costs are growing at a stratospheric place across the supply chain, but especially so upstream where available warehousing space has become almost non-existent.
| July ‘21 | Inv. Lev. | Inv. Costs | WH Cap. | WH Util. | WH Price | Trans Cap | Trans Util. | Trans Price |
| Downstream | 60.5 | 82.9 | 40.8 | 73.0 | 85.7 | 21.1 | 67.1 | 92.1 |
| Upstream | 69.4 | 91.9 | 41.2 | 68.9 | 89.0 | 41.6 | 67.9 | 91.0 |
| Delta (abs) | 8.9 | 9.0 | 0.4 | 4.1 | 3.3 | 20.5 | 0.8 | 1.1 |
| Significant? | No | Yes | No | No | No | Yes | No | No |
Respondents were asked to predict movement in the overall LMI and individual metrics 12 months from now. Their predictions for future ratings are presented below. For the next year, respondents predict a growth rate of 71.7 for the overall LMI. This is nearly 8 points above the all-time growth rate of 63.8, it is up slightly from May’s prediction of 69.8. This represents a significant rate of predicted growth. This high score is driven by predictions in the ’80s for all three price metrics – including an 87.9 for Inventory Costs. There is some optimism that Warehouse and Transportation Capacity will come online over the next 12 months, although it seems somewhat tempered as they both read in the low- to mid-’50s.
Interestingly, upstream and downstream respondents seem to be in agreement on this, as similar to last month we see a very little divergence between the two groups for future predictions:
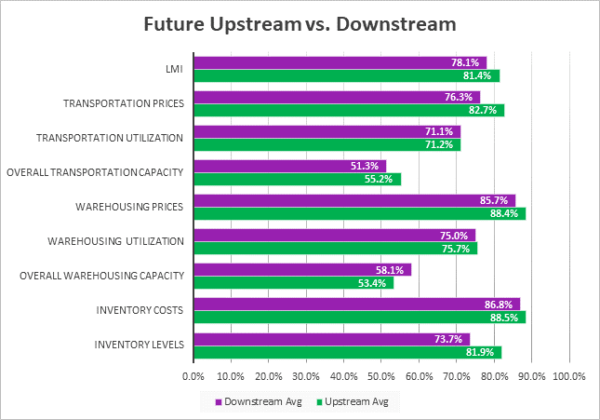
T-tests show no difference between the two respondent groups, indicating that high prices and moderate increases in available capacity are expected across the board.
| Future Readings | Inv. Lev. | Inv. Costs | WH Cap. | WH Util. | WH Price | Trans Cap | Trans Util. | Trans Price |
| Downstream | 73.7 | 86.8 | 58.1 | 75.0 | 85.7 | 51.3 | 71.1 | 76.3 |
| Upstream | 81.9 | 88.5 | 53.4 | 75.7 | 88.4 | 55.2 | 71.2 | 82.7 |
| Delta (abs) | 8.3 | 1.7 | 4.7 | 0.7 | 2.6 | 3.9 | 0.1 | 6.4 |
| Significant? | No | No | No | No | No | No | No | No |
Historic Logistics Managers’ Index Scores
This period’s along with prior readings from the last two years of the LMI are presented table below. The values have been updated to reflect the method for calculating the overall LMI:
| Month | LMI | Average for previous readings – 63.8
High – 75.7 Low – 51.3 Std. Dev – 6.97
|
| July ‘21 | 74.5 | |
| June ‘21 | 75.0 | |
| May ‘21 | 71.3 | |
| Apr ‘21 | 74.5 | |
| Mar ‘21 | 72.2 | |
| Feb ‘21 | 71.4 | |
| Jan ‘21 | 67.2 | |
| Dec ‘20 | 66.7 | |
| Nov ‘20 | 70.8 | |
| Oct ‘20 | 71.6 | |
| Sep ‘20 | 70.5 | |
| Aug ‘20 | 66.0 | |
| July ‘20 | 63.0 | |
| June ‘20 | 61.7 | |
| May ‘20 | 54.5 | |
| Apr ‘20 | 51.3 | |
| Mar ‘20 | 58.9 | |
| Feb ‘20 | 52.6 | |
| Jan ‘20 | 54.1 | |
| Dec ‘19 | 54.0 | |
| Nov ‘19 | 54.4 | |
| Oct ‘19 | 54.4 | |
| Sep ‘19 | 56.6 | |
| August ‘19 | 56.6 | |
| July ‘19 | 57.2 |
LMI®
The overall LMI index is 74.5, down (-0.5) from June’s reading of 75.0. The current reading is tied for the third-highest in the history of the index. This marks the sixth consecutive month, and nine out of the last 11, with a reading above 70.0. The average overall reading through the last six months is 73.2 – the highest half-year average through any point in the LMI. We have observed high LMI levels before, but never for this extended period of time. Recent reports of record-high container costs and virtually no storage capacity suggest that this extended burden is beginning to take its toll.
Respondents are not anticipating any significant relief over the next 12 months, predicting a growth rate of 71.7, up (+2.0) from June’s future prediction of 69.7 and significantly higher than the all-time average of 63.3. This growth rate over the next 12 months would lead to a continued increase in prices as the supply of capacity continues to struggle to keep up with demand.
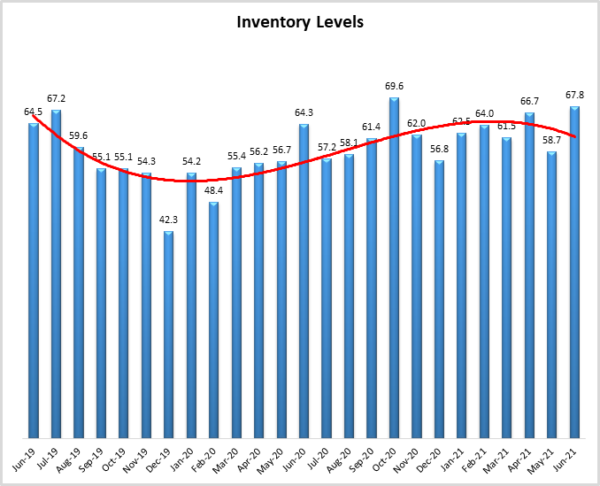
Inventory Levels
The Inventory Level value is 66.4, down (-1.4) from last month’s reading of 66.4. The current value is 9.2 points higher than the same time last year, and 0.8 points lower than two years ago. This means that seasonally speaking, inventories are increasing faster than a year ago but at a similar pace to two years ago at this time. This month, upstream respondents returned a value of 69.4, and downstream reported 60.5, so upstream respondents reported greater growth by 8.9 points. Last month was similar, when upstream respondents reported greater growth, by 4.2 points. This continued greater growth by upstream respondents may be due to inventories making up for production delays, or in anticipation of increased consumer demand.
When asked to predict what conditions will be like 12 months from now, the average value is 79.5, up (+5.8) from May’s future prediction of 73.7. This is also well above the current inventory index value of 58.7. Respondents expect inventory values to continue increasing significantly over the next year.
Inventory Costs
The current value of 88.8 is down slightly (-0.6) from last month’s record high of 89.4, but still the second-highest value for the index. Given the continued increases in inventory levels, it is not surprising that inventory costs have continued to increase. The current value is 19.7 points above the value last year at this time, a huge cost growth over last year at this time. The current value is also 17.6 points above the value two years ago at this time. This month, upstream respondents (91.9) experienced significantly greater growth than downstream (82.9), with upstream being 9.0 greater. Last month, downstream was 0.7 greater. The greater cost growth for upstream is consistent with the greater increase in inventory levels experienced by upstream respondents, discussed above.
Responses from participants are consistent with this prediction. When asked about what they expect inventory costs to be like 12 months from now, the index value is 87.9, down very slightly (-0.8) from May’s future prediction of 88.5. Respondents clearly expect continued growth for inventory costs over the next 12 months.
Warehousing Capacity
June 2021’s warehousing capacity registered in at 41.1 and reflects a rather meek increase from the previous month, though overall still in decline (still below the 50 percent mark, now for the 11th month in a row). Our team suspected that previous increased readings (i.e. May 2021) may have been a sign of things to come with respect to capacity increasing, but the data indicate that this may have been noise in an otherwise very tight warehousing market. Relative to one year ago, this reading reflects just under a 9-point decrease. This is notable given that the reading from July of 2020 represented the height of the COVID-19 pandemic. Now, one year later, the demand for storage appears to be even further in demand. This is likely due to consumers’ adjusting their habits toward e-commerce in a more permanent way.
Looking forward to the next 12 months, the predicted Warehousing Capacity index is predicted to increase at a rate of 55.0, down (-7.4) from June’s future prediction of 62.4. The June numbers had been up 10 points from May, whether predictions will move up again or continue to hover in the 50’s remains to be seen. We will continue watching this metric with great interest as it is unlikely costs will decrease in any significant way until more capacity is available
Warehousing Utilization
The Warehousing Utilization Index registered at 70.5 percent in July 2021. This represents a 5-point decrease from last month and is (yet again) up by over 7 percentage points from the July 2021 reading of 63.9. This reading represents a break from last month’s increase in the rate of utilization and breaks the growth pattern shown in Previous readings. Given that capacity continues to be strained, and by contrast, utilization (while still overall increasing) is down, this may be a signal that more warehousing is coming online (or is planned to come online) in order to assuage the tension in the market. Alternatively, this reading could be a blip. Future readings of these two measurements, as well as the readings for pricing will give our team better insights for future prognostication(s).
Looking forward to the next 12 months, the predicted Warehousing Utilization index is 75.4, nearly identical (-0.1) to June’s future prediction of 75.5. Respondents continue to expect to utilize increasingly greater amounts of available warehouse space throughout the year as supply struggles to keep up with demand.
Warehousing Prices
Warehousing Prices Index registered 88.0 percent in July 2021, the highest mark in the history of the index. This reading represents a 2.6 percentage point increase from last month and continues the trend in the (previously unrelenting) increased growth rate in warehousing prices amid the COVID-19 disruption(s). This reading is up by a staggering 20.5 percentage points from the reading one year ago. Jointly examining this month’s pricing reading in conjunction with this month’s capacity reading seems to align, indicating that the decreased capacity is driving prices up. The confounding factor here is that the utilization is down. This is likely an aberration, which can be confirmed in next month’s readings. Regardless, one thing is clear from this month’s data: the continued tension in the warehousing market is reaching epic proportions, and the pressure is not relenting.
Future predictions suggest that respondents are expecting prices to continue to grow at a rate of 87.5, up (+3.0) from June’s future prediction of 84.5. Even with the new capacity that is expected to come online in the next 12 months, respondents are not expecting much relief in terms of cost.
Transportation Capacity
The Transportation Capacity Index registered 34.9 percent in July 2021. This constitutes a small increase of .4 percentage points from the June reading of 34.5. The Transportation Capacity Index remains historically low, indicating continued downward pressure on transportation capacity. Further, our data indicate that the downward pressure on transportation capacity is extremely strong for downstream firms in the supply chain, implying that companies are facing significant challenges in finding the capacity to transport finished goods towards the end consumer. Relatively speaking, while transportation capacity is shrinking across the board, firms that are upstream in the supply chain do not report as stringent capacity constraints as the firms that are downstream.
The future Transportation Capacity Index decrease slightly from the previous reading, indicating 53.4 for the next year. This denotes an increase of 3.4 points from the previous future expectations, keeping the index above the critical threshold of 50 and indicating expectations of slightly expanding transportation capacity for the next 12 months.
Transportation Utilization
The Transportation Utilization Index registered 67.5 percent in July 2021. This number denotes a slight decrease of 2.2 points from the June reading of 69.7. As such, the Transportation Utilization Index remains elevated, indicating continued expansion for this metric.
It should be noted that the future Transportation Utilization Index is also down 1.5 points from the previous month indicating a 71.4 percent level for the next 12 months. Despite this small drop, the future transportation utilization index remains substantially above 50, indicating strong expectations of continued growth in transportation utilization.
Transportation Prices
The Transportation Prices Index registered 91.0 percent in July 2021. This corresponds to an increase of 3.7 percent from the June transportation prices reading of 87.3. The upward pressure on Transportation Prices that gained momentum in the fall months of 2020 seems to be back to full force, approaching all-time highs again and indicating continued and extremely strong upward pressure on Transportation Prices.
The future index for Transportation Prices indicates a value of 80.8, which is also slightly higher than the previous month’s expectations of 79.1. As such, the expectations of continued Transportation Price increases for the next 12 months are very strong, with the future index well above the critical level of 50.
About This Report
The data presented herein are obtained from a survey of logistics supply executives based on information they have collected within their respective organizations. LMI® makes no representation, other than that stated within this release, regarding the individual company data collection procedures. The data should be compared to all other economic data sources when used in decision-making.
Data and Method of Presentation
Data for the Logistics Manager’s Index is collected in a monthly survey of leading logistics professionals. The respondents are CSCMP members working at the director level or above. Upper-level managers are preferable as they are more likely to have macro-level information on trends in Inventory, Warehousing and Transportation trends within their firm. Data is also collected from subscribers to both DC Velocity and Supply Chain Quarterly as well. Respondents hail from firms working on all six continents, with the majority of them working at firms with annual revenues of over a billion dollars. The industries represented in this respondent pool include, but are not limited to Apparel, Automotive, Consumer Goods, Electronics, Food & Drug, Home Furnishings, Logistics, Shipping & Transportation, and Warehousing.
Respondents are asked to identify the monthly change across each of the eight metrics collected in this survey (Inventory Levels, Inventory Costs, Warehousing Capacity, Warehousing Utilization, Warehousing Prices, Transportation Capacity, Transportation Utilization, and Transportation Prices). In addition, they also forecast future trends for each metric ranging over the next 12 months. The raw data is then analyzed using a diffusion index. Diffusion Indexes measure how widely something is diffused, or spread across a group. The Bureau of Labor Statistics has been using a diffusion index for the Current Employment Statics program since 1974, and the Institute for Supply Management (ISM) has been using a diffusion index to compute the Purchasing Managers Index since 1948. The ISM Index of New Orders is considered a Leading Economic Indicator.
We compute the Diffusion Index as follows:
PD = Percentage of respondents saying the category is Declining,
PU = Percentage of respondents saying the category is Unchanged,
PI = Percentage of respondents saying the category is Increasing,
Diffusion Index = 0.0 * PD + 0.5 * PU + 1.0 * PI
For example, if 25 say the category is declining, 38 say it is unchanged, and 37 say it is increasing, we would calculate an index value of 0*0.25 + 0.5*0.38 + 1.0*0.37 = 0 + 0.19 + 0.37 = 0.56, and the index is increasing overall. An index value above 0.5 indicates the category is increasing, a value below 0.5 indicates it is decreasing, and a value of 0.5 means the category is unchanged. When a full year’s worth of data has been collected, adjustments will be made for seasonal factors as well.