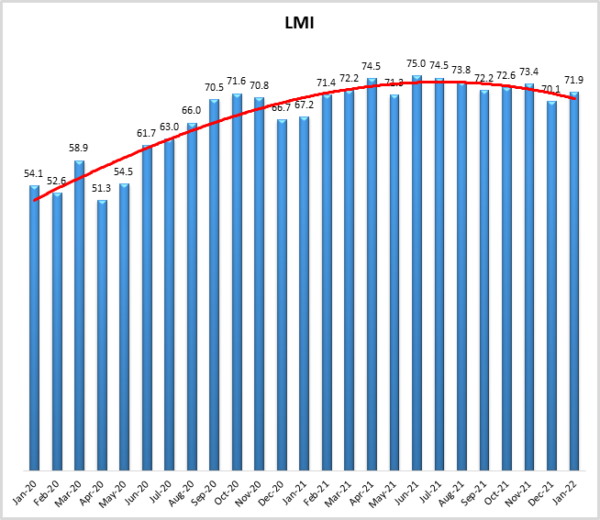
LMI® at 71.9
Growth is INCREASING AT A DECREASING RATE for: Inventory Levels, Inventory Costs, Warehousing Utilization Warehousing Prices, and Transportation Prices
Growth is INCREASING AT AN INCREASING RATE for: Transportation Utilization
Warehousing Capacity and Transportation Capacity are CONTRACTING
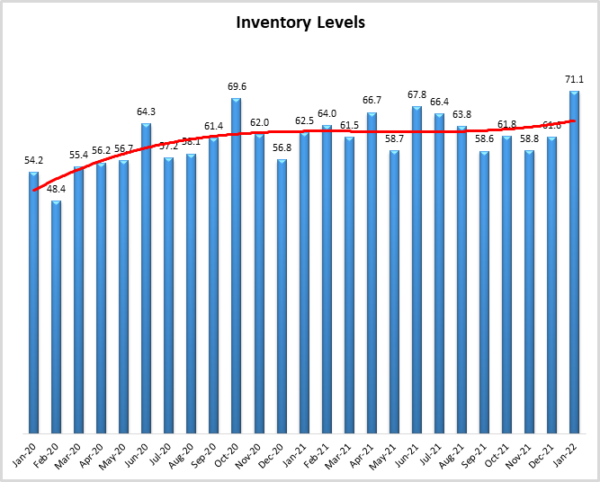
January’s reading of 71.9 is up (+1.8) from December’s reading of 70.1. The marks a full year of growth rates above 70.0 – a level we would classify as significant expansion. The only two months of the last 17 in which we saw sub-70.0 growth were in December 2020 and January 2021 which was largely a function of the seasonal wind-down of inventories. This year we’re seeing the opposite, as January’s Inventory Levels read in a 71.1 – the highest rate of growth since early 2018. In December we noted that inventories remained high upstream, speculating that we may be seeing significant inventory that was ordered for the holiday season continue to flow through supply chains even after Q4 was over. This month’s report offers more evidence that this is the case, as now Upstream and Downstream respondents report significant levels of inventory growth. The unseasonable expansion of inventory may be creating a positive feedback look with the logistics capacity and cost issues that plagued 2021. Because capacity is low and costs are high, it is difficult to move inventory efficiently. This combination of low capacity and high costs likely led to over-ordering this past Fall, and to goods idling at points in the supply chain where they could not be purchased by customers. Excess inventory in the system is eating up more capacity and causing costs to increase further. Essentially, low capacity and high costs led to higher levels of inventory, and now higher inventory is leading to even less capacity and higher costs. The result of this is that the high levels of inventory of durable goods in the supply chain are eating up capacity, and preventing high-turn inventories from moving as quickly as they need to which explains why some firms (i.e. apparel) are weighed down with inventory, and others such as grocery stores are facing shortages.
Much like diets and gym memberships, January is a time of renewal in supply chains, allowing logistics networks to reset post-holiday. After this reset, firms can then began ramping back up for demand throughout the year. This year, activity is already elevated in January. It will be interesting to observe the next 12 months, and whether this portends continued growth, or if the price will be too high eventually be too high for demand to continue to grow.
Researchers at Arizona State University, Colorado State University, Rochester Institute of Technology, Rutgers University, and the University of Nevada, Reno, and in conjunction with the Council of Supply Chain Management Professionals (CSCMP) issued this report today.
Results Overview
The LMI score is a combination of eight unique components that make up the logistics industry, including inventory levels and costs, warehousing capacity, utilization, and prices, and transportation capacity, utilization, and prices. The LMI is calculated using a diffusion index, in which any reading above 50 percent indicates that logistics is expanding; a reading below 50 percent is indicative of a shrinking logistics industry. The latest results of the LMI summarize the responses of supply chain professionals collected in January 2022. Overall, the LMI is up slightly (+1.8) from December’s reading of 70.1. The growth in this month’s index is fueled by metrics from across the index. Unseasonably high rates of inventory accumulation stand out among these metrics, but capacity remains constrained, and prices continue to grow quickly. Looking forward, respondents do not predict much relied over the next 12 months. Given the current shortages in capacity, it is difficult to disagree with them.
The start-stop nature of economic activity during a pandemic continues into 2002. In a turn from the hot consumer market we saw through much of 2021, U.S. spending was down 0.6% in December[1]. This is likely one of the drivers behind growing inventory levels. Firms that had stocked up anticipating a continuation of the hot consumer economy we observed throughout the Fall may now be facing the opposite problem, with more inventory than needed to meet demand. Reacting to this shift, Bank of America has decreased its expectations for first-quarter US GDP growth to only 1%. Originally, they had predicted 4% growth. The Atlanta Federal Reserve predicts a meager 0.1% growth in the 4th quarter. Reduced growth predictions are partially due to the continued spread of Omicron[2]. It is also possible that decreased consumer spending and increased firm expenses will put a crimp on the economy. This is likely due to the Omicron spike that raged throughout the US in December and January, a continued lack of logistics capacity that made some sales impossible, and a decrease in consumer savings that – after peaking in March – are now back down to pre-COVID levels, indicating that much of the stimulus has been worked through at the consumer level. Despite this slowdown, logistics professionals are bullish on continued growth in 2022[3]. Continued growth is likely a safe assumption as the lack of logistics capacity is one of the primary reasons consumer activity was down. For example, December volumes at the ports of LA and Long Beach were down 14% year over year[4], and LA Signal reports that volumes for the last week of January were down 19.3% year over year. Throughput continues to drop despite the 100-ship backlog off the Southern California ports. Conversely, the first two weeks of February are predicted to be up 66% and 38% respectively year-over-year[5]. This continues an interesting pattern in which future bookings for the Port of LA are much higher than in 2021, but then the volume that is actually processed turns out to be much lower. Essentially, the highly-reported increases in throughput at the ports were largely driven by gains in the first half of the year, before the lack of capacity ground everything to a halt[6]. And congestion at the ports is no longer an exclusively west coast problem. Ships are backing up at most North American ports. Wait times at the Port of New York/New Jersey is up 3.5 times (from 1.2 to 4.2) from January 2021. Backups have also increased significantly at the southeast ports of Charleston and Savannah[7]. It is likely that the annual “last push” of goods to head towards the U.S. before the Chinese New Year holiday launched the last week of January. It will be interesting to observe how long the CNY break lasts, and how much relief it might provide for the ports – or if the big push combined with the existing backlog will allow it to make much of a dent at all[8]. There are similar issues in the air, cargo flights continue to be delayed due to storms, staffing shortages, and canceled flights – over a thousand flights were canceled daily by U.S. airlines through the first two weeks of January[9].
The lack of capacity extends past physical assets and to labor as well. For instance, approximately 1 in 10 workers at the ports of LA and Long Beach were out with COVID-19 in mid-January[10]. There have been many recent attempts to reduce turnover, some firms are increasing automation to make workers’ jobs easier and increase job satisfaction. GXO Logistics and Abercrombie & Fitch are among the firms pursuing this strategy[11]. Puma, Best Buy, and Victoria’s secret have also made investments in technology like robotic arms, and automated picking systems to make up the worker deficit[12]. On the transportation side, Lone Star Transportation is offering a more flexible schedule to drivers 50 years and older, allowing workers to take prolonged periods of rest in an attempt to retain experienced drivers[13]. Overall, wages and benefits were up 4% in 2022 from 2021[14]. While increased wages and employee benefits come with many positives, there are costs as well. The increase in labor and logistics costs is being blamed for increased prices (in the 6-7% range) being passed onto consumers by firms like McDonald’s, Mondelez, and items throughout grocery stores[15].
This is reflected in the continued growth of Inventory Costs, which are up (+3.9) to 87.9 – marking 11 straight months with a rate of expansion over 80.0. As mentioned above, the growth rate in Inventory Levels has increased significantly, up 9.5 points from December, and 12.3 points from November. Much of this increase is due to late-arriving holiday inventory and the unexpected drop in consumer demand. There has been much debate in the last year about whether firms should move away from just-in-time to just-in-case inventory management, holding higher levels of safety stock as a buffer against disruptions. MIT’s Yosi Sheffi points out that firms should not totally throw away the year of JIT inventory management as a proven strategy just because an unprecedented global crisis disrupted supply chains. Instead, he recommends learning from this crisis. While that could include increasing safety stock in some cases, in others it will mean maintaining lean inventories but emphasizing resilience throughout the supply chain[16]. It will be interesting to observe the path firms choose to take in 2022, and how inventories fluctuate going forward.
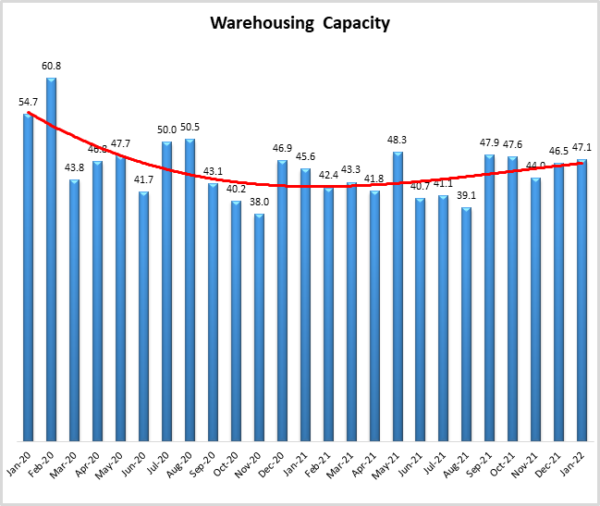
While the drop in consumer spending certainly played a role in increased Inventory Levels, Inventory Costs continue to be driven at least in part by the lack of warehouse space. Warehousing Capacity (+0.6) read in at 47.1, marking 17 consecutive months of contraction. Firms will continue to require more warehouse space, particularly in urban areas as soon as it becomes available. Bringg recently released a report in which 99% of respondents suggested they would be offering same-day delivery by 2025. This would be a significant jump from the 35% of respondents offering this service today. Retailers identified transparency with last-mile delivery and 3PL partners as one of their primary challenges in achieving this[17]. Even with the drop in overall spending in December, eCommerce was 16% of total retail during the holiday season[18] – a record high that will likely continue to be broken every year at least through the first half of this decade. The lack of capacity continues to drive Warehousing Utilization (+3.7 to 71.0) and Warehousing Prices (+3.8 to 85.9) upwards. The limited availability is encouraging retailers to acquire upstream distribution centers to ensure they have somewhere to store their goods[19]. Until more capacity is available, the growing appetite for eCommerce will keep costs high. It is likely not a coincidence that the 11 consecutive months of Warehousing Prices expanding at rates greater than 80.0, perfectly aligns with the 11 consecutive months of Inventory Costs doing the same.
Transportation networks continue to strain as well. Truck mileage was up 2% in 2021 to hit an all-time high of nearly 300 billion miles. FTR Transportation Intelligence estimates that truck mileage will grow another 7.4% over the next two years[20]. This demand led Transportation Capacity (+2.1) to read in at 44.8, the 20th consecutive month of contraction. As is often the case, this is more pronounced for Downstream firms, which reported a rate of contraction of 40.4 to their Upstream counterparts’ 48.6. They saw greater rates of utilization as well, registering 7.7 points higher (67.0 to 59.3). Still, overall utilization was up throughout the supply chain, reading in at 62.4. Finally, Transportation Prices continues to increase (+1.1) reading in at 88.7 – 18 months with a score of about 80.0. However, there is some nuance to these increases we should understand. Intermodal spot rates for 53’ containers were actually down 13% in the last week of January (to $2.02/mile). Dry van spot rates are down slightly too, but still high at $3.56/mile. Dry van and long-haul tender rejection rates are 19.1% and 21.1% respectively. Interestingly, coming out of LA they’re only 9.6% and 14.0% suggesting carriers continue to be positioned sub-optimally, something that is obviously driven by the financial incentives associated with higher rates coming out of the ports[21] and imbalance in the direction of traffic flows.
Increasing capacity will continue to be a struggle, Volvo delivered 60,000 trucks in Q4 of 2021, but it continues to have a large backlog due to product shortages, semiconductors chief among them[22]. The rush to get more trucks on the road in 2021 led to shipping-related greenhouse gas emissions increasing by 4.9% of pre-pandemic levels[23]. Overall, transportation was responsible for 26% of CO2 emissions in 2018 – a number that has likely increased. There are real costs associated with heightened CO2 emissions. The total cost of weather and climate disasters was $145 billion in 2021, making it the third-costliest year (when adjusted for inflation) for disasters behind 2017 and 2005[24], and many of these events had significant impacts on supply chains (e.g. the freeze in Texas decimated the resin supply, making packaging more difficult to source). As logistics capacity increases to meet consumer demand, the associated costs of the increased emissions should be monitored as well as firms attempt to design resilient networks that are optimized for the long run.
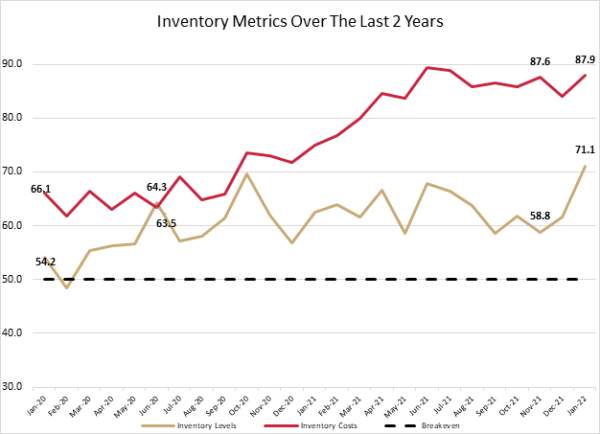
Movements in inventory metrics over the last two years are presented in the graph below. The growth rate of Inventory Levels exceeded Inventory Costs in June of 2020 at the height of COVID lockdowns when consumer spending was low and unsold inventory built up in the system. This shifted in the back half of 2020 and all throughout 2021 as the gulf between the rates of expansion for Inventory Levels (gold line) and Inventory Cost (scarlet line) continued to grow, peaking at a delta of 28.8 points in November 2020. Although real inventory levels were up this fall[25], the high level of sales meant that products were sold soon after they were put on the shelf, keeping Inventory Level expansion down even as Inventory Costs kept growing. This split has dropped significantly in the last two months (down to 16.8 points) as inventory has begun to accumulate. The slowdown in consumer demand was caused in December by the Omicron variant and in January by a combination of seasonality and a decrease in savings in the face of price inflation. Given these pressures, it will be interesting to see if the gap between the growth of inventory on hand and the cost of holding it continues to close throughout 2022.
The index scores for each of the eight components of the Logistics Managers’ Index, as well as the overall index score, are presented in the table below. Six of the eight metrics show signs of growth, while both capacity metrics continue their runs of contraction. The logistics industry remains tight and based on future predictions and industry experts seems likely to stay that way throughout 2022.
|
LOGISTICS AT A GLANCE |
|||||
| Index | January 2022 Index | December 2021 Index | Month-Over-Month Change | Projected Direction | Rate of Change |
| LMI® | 71.9 | 70.1 | +1.8 | Growing | Increasing |
| Inventory Levels | 71.1 | 61.6 | +9.5 | Growing | Increasing |
| Inventory Costs | 87.9 | 84.0 | +3.9 | Growing | Increasing |
| Warehousing Capacity | 47.1 | 46.5 | +0.6 | Contracting | Decreasing |
| Warehousing Utilization | 71.0 | 67.3 | +3.7 | Growing | Increasing |
| Warehousing Prices | 85.9 | 82.1 | +3.8 | Growing | Increasing |
| Transportation Capacity | 44.8 | 42.6 | +2.1 | Contracting | Increasing |
| Transportation Utilization | 62.4 | 67.1 | -4.7 | Growing | Decreasing |
| Transportation Prices | 88.7 | 87.6 | +1.1 | Growing | Increasing |
This month, both upstream (blue bars) and downstream (orange bars) firms reported considerable rates of continued growth in the utilization of logistics services. Differences between the two groups are down significantly from December. However, downstream firms do continue to feel higher levels of pressure with transportation metrics.
For the first time in four months, we do not detect a significant difference in Inventory Levels between Upstream and Downstream respondents. The reason for this? Because Inventory Levels are up everywhere, with unseasonably high readings of 69.9 and 71.1 respectively. This suggests that inventory has continued to flow downstream but is has stopped flying off shelves at the same rates we saw throughout 2021. The only significant differences detected by t-tests are seen for the Transportation Capacity and Transportation Utilization metrics. In both cases, Downstream firms are struggling, with capacity contracting 8.2-points faster and utilization increasing 7.7 points above what their Upstream counterparts are seeing. Even as consumer spending slows, eCommerce continues to play an outsized role in retail, stressing delivery availability.
| Inv. Lev. | Inv. Costs | WH Cap. | WH Util. | WH Price | Trans Cap | Trans Util. | Trans Price | LMI | |
| Upstream | 69.9 | 87.3 | 46.4 | 68.6 | 85.5 | 48.6 | 59.3 | 89.3 | 71.3 |
| Downstream | 71.1 | 89.1 | 47.8 | 73.9 | 86.7 | 40.4 | 67.0 | 87.0 | 73.0 |
| Delta | 1.3 | 1.8 | 1.4 | 5.3 | 1.2 | 8.2 | 7.7 | 2.4 | 1.8 |
| Significant? | No | No | No | No | No | Marginal | Marginal | No | No |
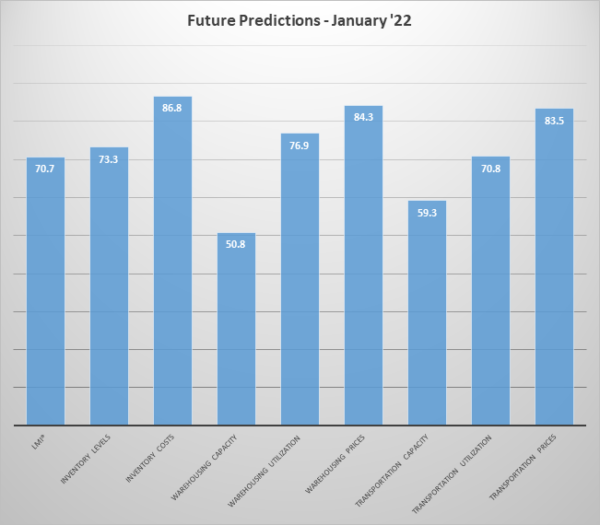
Respondents were asked to predict movement in the overall LMI and individual metrics 12 months from now. Their predictions for future ratings are presented below. For the next year, respondents predict a growth rate of 70.7, up (2.2) from December’s future prediction of 72.9. This would portend significant levels of growth throughout 2022 – comfortably above the all-time average of 64.8. This growth is projected to be driven by continued cost growth, with all three metrics reading somewhere in the ’80s. Some Transportation Capacity is expected to come online (reading in at 59.3), but Warehousing Capacity is predicted to remain stagnant, barely moving at a rate of 50.8. This pessimism is likely related to the prediction of Inventory Levels expanding at a rate of 73.3. This would surpass any levels of inventory growth we have ever seen. But given the current levels of inventory on hand in some industries, declining consumer demand, insufficient capacity to move inventory quickly, and the amount of inventory waiting outside of ports to get into the U.S., this robust level of growth could be possible.
The exact nature of the future predictions varies by supply chain position. This month we see that most clearly in the predictions for future Transportation Capacity and Warehousing Prices.
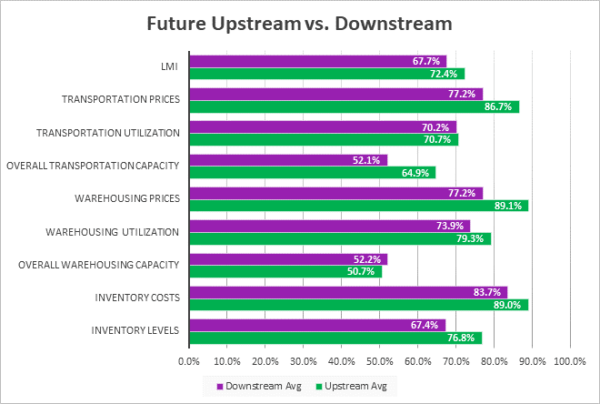
In January 2022 we detected marginal or significant differences between Upstream and Downstream predictions for four of the eight components of the LMI, as well as a marginal difference in expectations for the index overall. Upstream firms are predicting a more rapid expansion in Warehousing Price (+12.0) and Transportation Capacity (+12.7). This may reflect the expectation for inventory growth (marginally higher at 9.4-points for upstream firms) as well as the type of transportation capacity that will come online, with the production of the trucks downstream firms continuing to deal with bottlenecks.
| Futures | Inv. Lev. | Inv. Costs | WH Cap. | WH Util. | WH Price | Trans Cap | Trans Util. | Trans Price | LMI |
| Upstream | 76.8 | 89.0 | 50.7 | 79.3 | 89.1 | 64.9 | 70.7 | 86.7 | 72.4 |
| Downstream | 67.4 | 83.7 | 52.2 | 73.9 | 77.2 | 52.1 | 70.2 | 77.2 | 67.7 |
| Delta | 9.4 | 5.3 | 1.5 | 5.4 | 12.0 | 12.7 | 0.5 | 9.5 | 4.7 |
| Significant? | Marginal | No | No | No | Yes | Yes | No | Marginal | Marginal |
Historic Logistics Managers’ Index Scores
This period’s along with prior readings from the last two years of the LMI are presented table below. The values have been updated to reflect the method for calculating the overall LMI:
| Month | LMI | Average for last 3 readings – 72.0
All-time Average – 64.8 High – 75.7 Low – 51.3 Std. Dev – 7.11
|
| Jan ‘22 | 71.9 | |
| Dec ‘21 | 70.1 | |
| Nov ‘21 | 73.4 | |
| Oct ‘21 | 72.6 | |
| Sep ‘21 | 72.2 | |
| Aug ‘21 | 73.8 | |
| July ‘21 | 74.5 | |
| June ‘21 | 75.0 | |
| May ‘21 | 71.3 | |
| Apr ‘21 | 74.5 | |
| Mar ‘21 | 72.2 | |
| Feb ‘21 | 71.4 | |
| Jan ‘21 | 67.2 | |
| Dec ‘20 | 66.7 | |
| Nov ‘20 | 70.8 | |
| Oct ‘20 | 71.6 | |
| Sep ‘20 | 70.5 | |
| Aug ‘20 | 66.0 | |
| July ‘20 | 63.0 | |
| June ‘20 | 61.7 | |
| May ‘20 | 54.5 | |
| Apr ‘20 | 51.3 | |
| Mar ‘20 | 58.9 | |
| Feb ‘20 | 52.6 | |
| Jan ‘20 | 54.1 |
LMI®
The overall LMI read in at 71.9 in January, up (+1.8) from December’s reading of 70. This marks 12 consecutive months of readings over 70.0, which we consider a significant rate of expansion. This is largely driven by the unseasonal spike in inventories, continued growth in price, and the lack of available capacity. The lack of capacity is likely to continue to be a problem given the level of inventory currently moving through supply chains. January is generally a slower time for supply chains, with previous January LMI readings averaging 63.0, below the all-time index average of 64.8. Logistics activity than usually increases into the Spring and Summer. It will be interesting to observe whether we will see this usual pattern of growth, or – as with the bottlenecks at the Port of LA – we will some decline in activity due to high prices and lack of capacity. Essentially the question becomes: is there enough room in the system for more growth?
Respondents are not anticipating any significant relief over the next 12 months, predicting a growth rate of 70.7, down (-2.2) from December’s future prediction of 72.9. This level of growth would mean we stay at significant levels of expansion throughout 2022.
Inventory Levels
This Inventory Level metric registered in at 71.1 in January, up significantly (+9.5) from December’s reading of 61.6 and up (+12.3) from November’s value of 58.8. This is the third time in this history of the LMI that this metric has been above 70.0, and the first occurrence since April of 2018. Generally, we would expect inventories to decrease in January, but it has clearly continued to flow downstream. Last month, Upstream respondents reported greater inventory growth by 17.9 pts, (67.9 vs 50.0), but in January Downstream respondents reported greater inventory growth 1.2 pts – a 19.1-point swing. This may be partially due to late shipments finally arriving after COVID-related supply chain delays. Many firms over-ordered ahead of the holiday rush, and December sales were somewhat curbed due to Omicron.
When asked to predict what conditions will be like 12 months from now, the average value is 73.3, down (-8.4) from December’s future prediction of 81.7. This number is still high but may have been adjusted down slightly as firms are adjusting their forecasts for the potential slowdown in consumer demand.
Inventory Costs
The current value of Inventory Costs is 87.9, up (+3.9) from December’s reading of 84.0, down slightly (-3.6). This is the 11th consecutive month that Inventory Costs have expanded at a rate greater than 80.0. Highlighting how unusual this level of inventory is at this time of the year, January’s reading is up 12.9 points from a year ago and 21.8 points up from the year before that. The cost of holding inventory continues to suffer due to the lack of capacity to store or move it. Generally, Inventory Costs are low in January and then increase throughout the rest of the year, it will be interesting to see if this pattern continues in 2022.
Looking forward at the next 12 months, the predicted Inventory Costs are 87.9, up (+2.1) from December’s value of 90.0. This suggests that firms, and potentially consumers, will continue to deal with increased price pressure through the next year.
Warehousing Capacity
Warehousing capacity for the month of January 2022 registered in at 47.1, up slightly (+0.6) from December’s reading of 46.5, up slightly (+2.5) from November’s reading of 44.0, indicating a continued contraction in available space. Warehousing Capacity has been decreasing consistently since August 2020 and this month’s reading marks 21 out of 23 and17 consecutive months of contraction. Interestingly, this value is relatively unchanged from the reading one year ago (45.6), but much different than two years ago when capacity was actually expanding (54.7) We would expect there to be some loosening of capacity post-holiday, but this does not seem to be the case this year.
Looking forward to the next 12 months, respondents remain neutral on the prospect of meaningful change to capacity. The predicted Warehousing Capacity index is for January is 50.8, barely up (+0.8) from December’s future prediction of 50.0 and no movement. While the prediction of holding steady is not incredibly optimistic, it would be at least some relief after the year and a half of contraction we have seen in this metric.
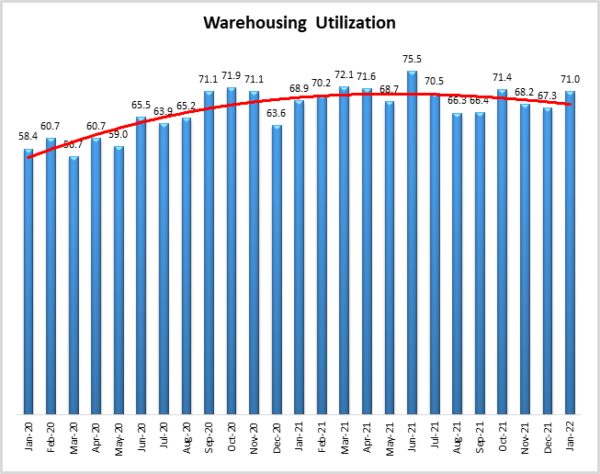
Warehousing Utilization
The Warehousing Utilization Index registered in at 71.0, up (+3.7) from December’s reading of. 71.0 is a significant rate of expansion, coming in 12.7-points higher than January 2020’s pre-pandemic reading of 58.7. Even while the raw square footage of available space comes online, the demand for warehouse in space continues to outstrip whatever growth we’re seeing. In addition to the late-arriving orders, the shifted dynamic of the holiday returns season (in which more eCommerce shopping leads to a higher rate of returns) is likely driving the increase to the rate at which utilization of warehousing is being consumed.
Looking forward to the next 12 months, the predicted Warehousing Utilization index is 76.9, down slightly (-2.4) from December’s future prediction of 79.3 but still indicating very robust levels of growth. Respondents continue to expect to utilize increasingly greater amounts of available warehouse space throughout the year as supply struggles to keep up with demand.
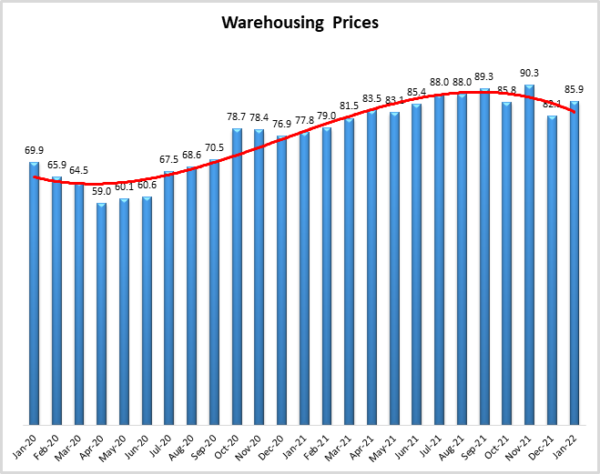
Warehousing Prices
Warehousing Prices Index registered 85.9 in January 2022, this is up (+3.8) from December’s rate of growth of 82.1, and 8.1-points higher than the reading in January 2021. percent in December of 2021. This value is down significantly (-8.2) from November’s all-time high reading of 90.3. This marks the 16th consecutive month of a growth level higher than 75.0 – which we would classify as a significant rate of growth. Even though supply chains have had nearly two years to adapt to new e-commerce saturated normal, pricing is still exhibiting upward pressure at an increasing rate. There’s also likely an element of reverse supply chain pressures being included as returns are likely reflected in the need for such capacity in the warehousing space, and thus likely drive increases to the price.
Future predictions suggest that respondents are expecting prices to continue to grow at a rate of 84.3, down slightly (-2.2) from December’s future prediction of 86.5. With respondents also predicting no real growth in capacity relative to demand next year, it is unsurprising that they also expect to be paying higher prices through the rest of 2022.
Transportation Capacity
The Transportation Capacity Index registered 44.8 percent in January 2022, up (+2.2) from the December 2021 reading of 42.6. This denotes the third consecutive month in which the rate of contraction has slowed. Despite the slight movement, this is the 20th consecutive month of contraction in available Transportation Capacity. This is particularly pronounced for Downstream firms, who reported a much steeper rate of contraction at 40.4 than their Upstream counterparts, who are much closer (+8.2) to the expansion threshold at 48.6.
The future Transportation Capacity Index increased from the previous reading, and it indicates 59.3 for the next year. The future Transportation Capacity Index is now 9.3 percentage points above the critical threshold of 50, indicating expectations of expanding transportation capacity for the next 12 months. The expectation of increases in transportation capacity is even stronger for upstream firms, where the future transportation capacity index is registering 64.9. In comparison, this index is only 52.1 for downstream firms.
![]()
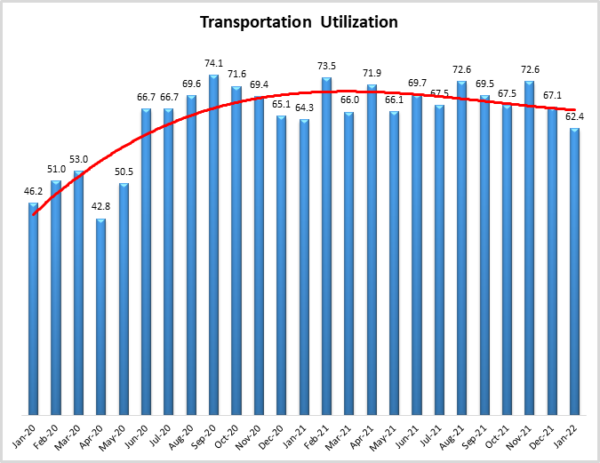
Transportation Utilization
The Transportation Utilization Index registered 62.4 percent in January 2022, down (-4.7) points from December’s reading of 67.1. As such, the Transportation Utilization Index is continuing its retreat from the historically high levels. The difference in utilization is reflective of available capacity, with Downstream firms needing to utilize a much greater proportion of available capacity than their Upstream counterparts are at a rate of 67.0 to 59.3.
It should be noted that the future Transportation Utilization Index has increased somewhat, indicating a 70.8 percent level for the next 12 months. The future transportation utilization index remains above the 50 thresholds, indicating continuing expectations of growth in transportation utilization. There is almost no difference in the expectations of upstream and downstream firms.
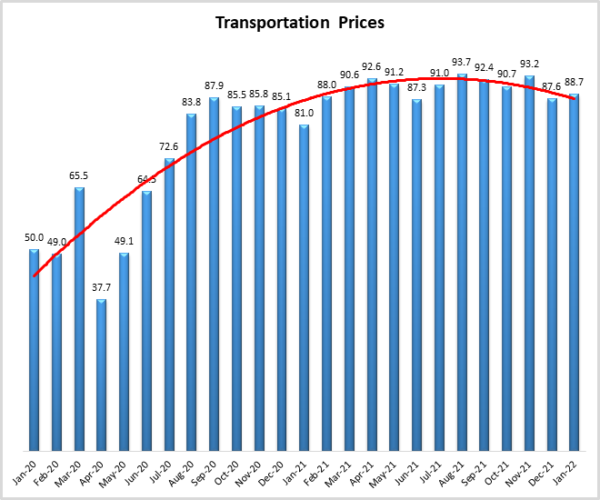
Transportation Prices
The Transportation Prices Index registered 88.7 in January 2022, up (+1.1) from December’s reading of 87.6 percent in December 2021. This marks 18 months of values reading in to 80’s or 90’s. The cost of transportation continues to be one of the primary drivers of cost inflation throughout the world and, after COVID itself, perhaps the primary obstacle to a full economic recovery. Unlike the other two transportation metrics, growing Transportation Prices are being felt everywhere. The price pressure is a little higher for upstream firms where the index is registering 89.3 (downstream price index is at 87.0).
The future index for transportation prices indicates a value of 83.5. As such, the expectations of continued transportation price increases for the next 12 months remain strong, with the future index well above the critical level of 50 that indicates expansion. The price increase expectations are slightly higher for upstream firms (index is at 86.7) than for downstream firms (index is at 77.2).
About This Report
The data presented herein are obtained from a survey of logistics supply executives based on information they have collected within their respective organizations. LMI® makes no representation, other than that stated within this release, regarding the individual company data collection procedures. The data should be compared to all other economic data sources when used in decision-making.
Data and Method of Presentation
Data for the Logistics Manager’s Index is collected in a monthly survey of leading logistics professionals. The respondents are CSCMP members working at the director-level or above. Upper-level managers are preferable as they are more likely to have macro-level information on trends in Inventory, Warehousing and Transportation trends within their firm. Data is also collected from subscribers to both DC Velocity and Supply Chain Quarterly as well. Respondents hail from firms working on all six continents, with the majority of them working at firms with annual revenues over a billion dollars. The industries represented in this respondent pool include, but are not limited to: Apparel, Automotive, Consumer Goods, Electronics, Food & Drug, Home Furnishings, Logistics, Shipping & Transportation, and Warehousing.
Respondents are asked to identify the monthly change across each of the eight metrics collected in this survey (Inventory Levels, Inventory Costs, Warehousing Capacity, Warehousing Utilization, Warehousing Prices, Transportation Capacity, Transportation Utilization, and Transportation Prices). In addition, they also forecast future trends for each metric ranging over the next 12 months. The raw data is then analyzed using a diffusion index. Diffusion Indexes measure how widely something is diffused, or spread across a group. The Bureau of Labor Statistics has been using a diffusion index for the Current Employment Statics program since 1974, and the Institute for Supply Management (ISM) has been using a diffusion index to compute the Purchasing Managers Index since 1948. The ISM Index of New Orders is considered a Leading Economic Indicator.
We compute the Diffusion Index as follows:
PD = Percentage of respondents saying the category is Declining,
PU = Percentage of respondents saying the category is Unchanged,
PI = Percentage of respondents saying the category is Increasing,
Diffusion Index = 0.0 * PD + 0.5 * PU + 1.0 * PI
For example, if 25 say the category is declining, 38 say it is unchanged, and 37 say it is increasing, we would calculate an index value of 0*0.25 + 0.5*0.38 + 1.0*0.37 = 0 + 0.19 + 0.37 = 0.56, and the index is increasing overall. An index value above 0.5 indicates the category is increasing, a value below 0.5 indicates it is decreasing, and a value of 0.5 means the category is unchanged. When a full year’s worth of data has been collected, adjustments will be made for seasonal factors as well.
Logistics Managers Index
Requests for permission to reproduce or distribute Logistics Managers Index Content can be made by contacting in writing at Dale S. Rogers, WP Carey School of Business, Tempe, Arizona 85287, or by emailing [email protected] Subject: Content Request.
The authors of the Logistics Managers Index shall not have any liability, duty, or obligation for or relating to the Logistics Managers Index Content or other information contained herein, any errors, inaccuracies, omissions, or delays in providing any Logistics Managers Index Content, or for any actions taken in reliance thereon. In no event shall the authors of the Logistics Managers Index be liable for any special, incidental, or consequential damages, arising out of the use of the Logistics Managers Index. Logistics Managers Index, and LMI® are registered trademarks.
About The Logistics Manager’s Index®
The Logistics Manager’s Index (LMI) is a joint project between researchers from Arizona State University, Colorado State University, University of Nevada, Reno, Rochester Institute of Technology, and Rutgers University, supported by CSCMP. It is authored by Zac Rogers Ph.D., Steven Carnovale Ph.D., Shen Yeniyurt Ph.D., Ron Lembke Ph.D., and Dale Rogers Ph.D.