-
LMI® at 75.2
-
Growth is INCREASING AT A DECREASING RATE for: Inventory Levels, Inventory Costs, Warehousing Utilization Warehousing Prices, Transportation
-
Utilization, and Transportation Prices
-
Warehousing Capacity and Transportation Capacity are CONTRACTING
February’s overall LMI reading of 75.2 is the second-highest in the history of the index, up (+3.3) from January’s reading of 71.9. This is now 13 consecutive months over 70.0, which we would classify as significant expansion, with no obvious signs of a slowdown on the horizon. Like January, this month’s growth is driven by rapid growth in Inventory Levels, which are up 9.1 points to 80.2 – crossing the 80.0 thresholds for the first time and shattering the previous record of 72.6. This is a complete 180 from the Fall of 2021 when firms struggled to build up inventories. Now it seems that a combination of over-ordering to avoid shortages, late-arriving goods due to supply chain congestion, and a softening of consumer spending has created a logjam, Inventory Levels a full 21.4 points higher than they were in November. Unsurprisingly, this has spilled over to Inventory Costs as well, which have also reached a new peak (+2.3) of 90.3. This inventory issue seems more pronounced for downstream retailers, who reported significantly higher levels of both Warehousing and Transportation Utilization than their upstream counterparts. There is a possibility that this surge in inventories will result in some price markdowns for durable goods. However, it seems unlikely that this will lead to a meaningful break in the inflation we have observed across supply chains, as Warehousing and Transportation Prices remain high due to the continued mismatch in demand and available capacity.
Researchers at Arizona State University, Colorado State University, Rochester Institute of Technology, Rutgers University, and the University of Nevada, Reno, and in conjunction with the Council of Supply Chain Management Professionals (CSCMP) issued this report today.
Results Overview
The LMI score is a combination of eight unique components that make up the logistics industry, including inventory levels and costs, warehousing capacity, utilization, and prices, and transportation capacity, utilization, and prices. The LMI is calculated using a diffusion index, in which any reading above 50 percent indicates that logistics is expanding; a reading below 50 percent is indicative of a shrinking logistics industry. The latest results of the LMI summarize the responses of supply chain professionals collected in February 2022. Overall, the LMI is up (+3.3) from January’s reading of 71.9. The growth in this month’s index is fueled by metrics from across the index. Unseasonably high rates of inventory accumulation stand out among these metrics, but capacity remains constrained, and prices continue to grow quickly. Looking forward, respondents do not predict much relied over the next 12 months on. Given the current shortages in capacity, it is difficult to disagree with them.
The obvious place to start this month is with the Russian invasion of Ukraine. Beyond the truly tragic loss in human life, a number of costs are extending out of this conflict – many of which will have a direct effect on global supply chains. The most apparent change has been the shock to fuel prices. The price of crude oil is up to $100 a barrel – the highest level since 2014. As sanctions rack up on Russia, prices may continue to increase, potentially driving transportation and inventory costs higher[1]. Average diesel prices in the U.S. were $4.006 on February 28th. This is up 44 cents per gallon since the start of 2022 and up to $1.07 from this time last year[2] [3]. Russia’s invasion has also led to no-fly zones over Moldova, Eastern Russia, and Ukraine, cutting off the most direct route between Europe and Asia. Additionally, many countries, such as the UK have banned Russian carriers from landing there[4]. FedEx and UPS have also suspended shipments to Russia, with packages in route to be returned to the sender[5]. The longer routes cargo planes will have to take, along with increased fuel costs due to the war, create a “double whammy” for carriers. Finally, we are likely to observe various indirect costs here as well, as sanctions cut off access to leading producers of commodities like nickel, palladium, natural gas, wheat, grain, and sunflower oil. The ripple effects from this will be felt in products from groceries to Volkswagens[6].
On the other side of the globe, the number of ships waiting off the coast of LA/Long Beach was at 66 during the last week of February – the lowest level since September. Additionally, dwell time for containers at the Port of LA are down 23% from their peaks in early December. However, the number of ships queuing off of alternate US ports like Charleston or New York/New Jersey has increased steadily[7]. Over 30 ships lingered off the Port of Charleston in late February – up from 19 in January. The Port Authority expects the backlog to clear by April[8]. In addition to the ongoing port delays, protests at the U.S./Canada border have slowed truck traffic as well. These actions caused prices to ship goods from Canada to the US to jump up 44% from January to February[9]. The push to avoid bottlenecks has also led some firms to move what would usually be intermodal freight by road. US intermodal transports are down by 12% year-over-year through the first six weeks of 2022. They have lost approximately 1% of their market share to long-distance trucking since the start of the pandemic. Increasing the demand for truckloads of over 500 miles[10].
The impacts of this consistent congestion, fueled by the 10.6 million TEUs that were processed at the Port of LA in 2021 – up 16% from 2020[11], a paltry 42.2% of container ships arrived on time in 2021 – down 35.8% from 2019. This has not improved much, in late February the average container was still taking 109 days to get from China to its final point of destination in the U.S., something that should take 40-60 days pre-pandemic. This has led to the forecasting headaches and a high volume of late-arriving products, partially explaining why Inventory Levels are up (+9.1) so significantly to an all-time high of 80.2. Unsurprisingly, the combination of too much inventory and expensive shipping has driven up Inventory Costs as well (+2.3) to an all-time high reading of 90.3. Due to the high costs and slower sales, many firms are using their excess inventory as collateral to pay back the money they spent for expensive shipping on the way into the U.S.[12]. For both of the inventory, metrics to be at an all-time high is especially unusual given that it’s February, which is often a slower time in supply chains with the wind-down from Q4 and the Chinese New Year.
The high volume of inventory in the system has led to increased Warehousing Utilization (+3.3), up to 74.3 overall in February (driven particularly by downstream utilization rates of 81.1). The high levels of inventory coursing through supply chains highlight the continued contraction in available warehousing. Warehousing Capacity is once again down (-4.6) to 43.4, the lowest level since the start of the Q4 inventory buildup in August 2021. This also marks 18 consecutive months of contraction, incentivizing many firms to aggressively explore alternatives. Walmart is one such firm, as they are attempting to supplement their network by attaching approximately 100 new automated fulfillment centers to existing stores[13]. This type of large capital expenditure is obviously not an option for everyone, many smaller warehouse operators are attempting to cut costs through automation – not just with expensive robotic automation, but with digital/touchscreen picking systems that allow them to go paperless as well[14]. The impact of all of this can be seen on Warehousing Prices, which are up slightly (+0.5) to 86.4.
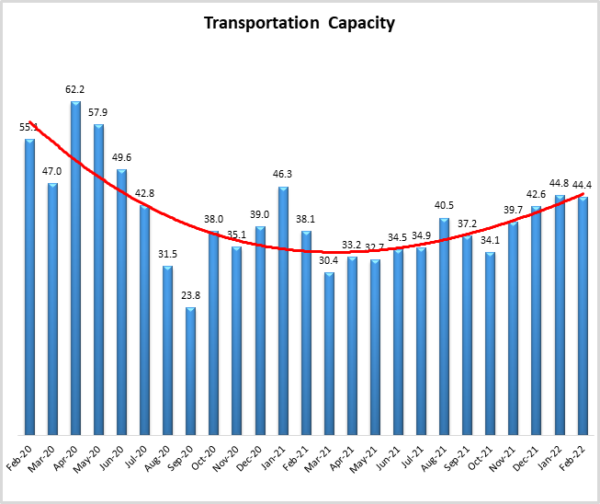
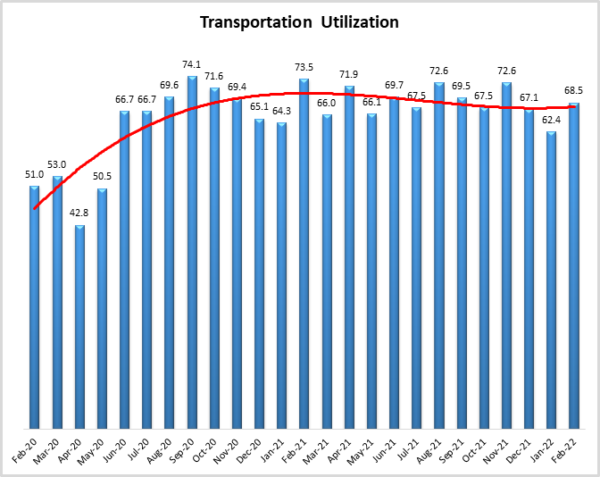
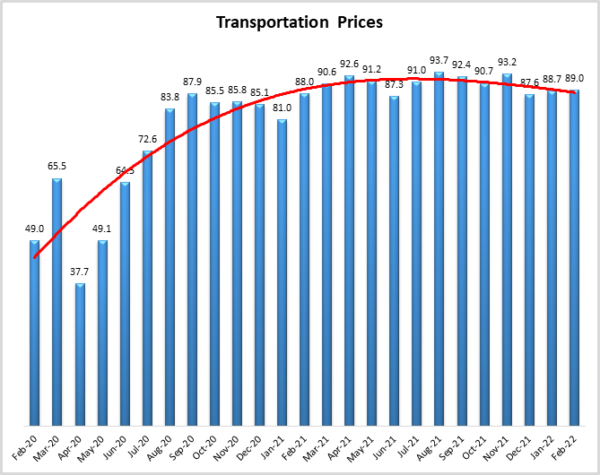
While truck mileage was up overall in 2021 (at an all-time high of nearly 300 billion miles[15]), U.S. Bank, in its fourth-quarter 2021 National Shipments Index, reported a decline in freight shipments of 2.4% from the third quarter of 2021 and a year-over-year drop of 5.1% from the fourth quarter of 2020. Yet for the same period, the bank’s National Spend Index, which measures freight expenditures, increased 8.4% from the third quarter and surged 20.2% from the fourth quarter a year ago. Schneider’s recent fourth-quarter 2021 results clearly illustrate this dynamic: The company’s average weekly revenue per truck was $4,521, up 18% from last year, while the average number of trucks operating declined 5.3%[16]. So, fewer trucks are available, and those that are around are quite expensive. This is reflected in the continued contraction in available Transportation Capacity which is read in at 44.4. While the month-over-month drop (-0.3 from January) is rather mild, the longevity of the contraction, now stretching 20 months back to June of 2020 is anything but. To deal with this capacity issue, many large trucking companies are planning to use their increased operating revenue to make significant capital investments. JB Hunt planned to increase net capital expenditures by over $600 billion from 2021, with Old Dominion planning to increase by around $400 million. The backlog of components continues to be an issue. North American truck manufacturers produced 264,500 class 8 trucks in 2021 – nearly 65,000 less than the 330,000 they could have produced if not shortages existed. They will be similarly short this year, projected to produce only 300,000 of the previously predicted 360,000 in 2022[17]. Even ocean carriers are moving to get in on the opportunity, with Maersk is attempting to use their record profits to break into the trucking and domestic 3PL business. The arrow is clearly pointing up in terms of the demand for these businesses with shippers spending 8-9 times more on domestic logistics than on ocean freight. This may mark a trend towards logistics companies putting together full-service end-to-end networks[18]. Even with this investment, the transportation crunch cannot be solved until the semiconductor shortage ends – something experts say could begin to ease by 2023 at the earliest[19] (DC Velocity Staff, 2022).. In the meantime, Transportation Utilization continues to increase (+6.1) to 68.5. As with Warehousing Utilization, this is driven by the high levels of downstream utilization – which read in at 75.0. A shortage of equipment is not the only thing driving transportation issues, there is the shortage of drivers as well. Part of the labor issue can be attributed to an estimated 25% of driving schools not reopening after the pandemic Frantz, 2022). As they have for the last 21 months since May of 2020, Transportation Prices expanded (+0.3) at a rate of 89.0. FreightWave’s Zach Strickland[20] notes that contract rates for dry van truckloads are up approximately 25% over the last year. The cost of freight transportation overall is up 28% since the start of 2019 – the producer price index is up 23% over that same period. Essentially, the price increases for transportation stand out even above all of the other inflation happening throughout the economy[21] (Strickland, 2022)
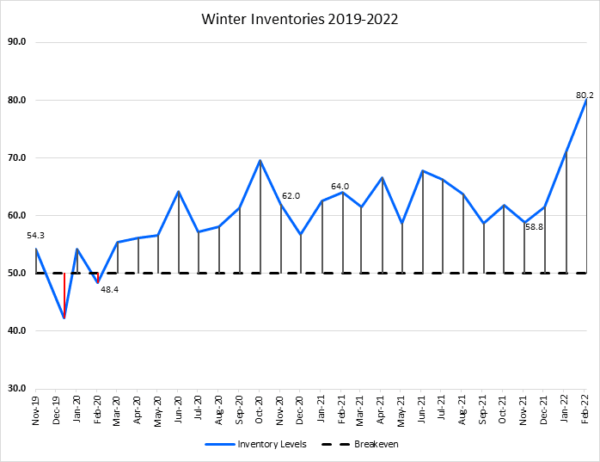
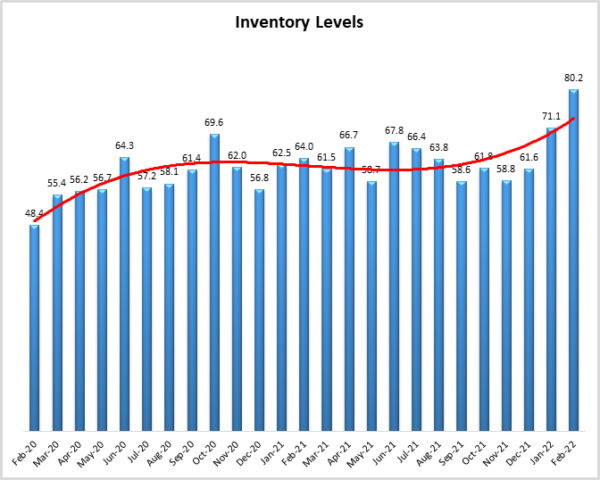
Movements in Inventory Levels from November 2019 to February 2022 are presented below. The readings from the last three November’s (usually near the height of Q4 inventory buildups) and February’s (when Inventory Levels are often down) are highlighted here for the purpose of demonstrating how unusual the last three months have been. From November 2019 – February 2020 Inventory Levels were down 5.3 points, from November 2020 – February 2021 they were up 2.0 points, from November 2021 – February 2022 they are up 21.4 points. This type of movement would be notable in any 4-month period, but is particularly notable now, in a time when inventories are not generally high (the all-time LMI average for February Inventory Levels is 62.8). Firms will now have to decide what to do with this unseasonably high inventory. Will they be sold at a discount? Or stored in increasingly expensive warehouses and backrooms? Neither option is ideal, and it will be fascinating to observe the different strategies that are deployed over the coming months.
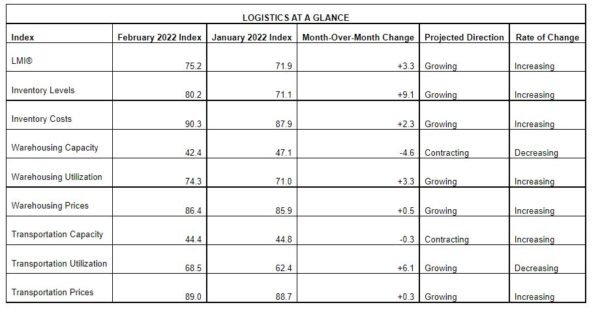
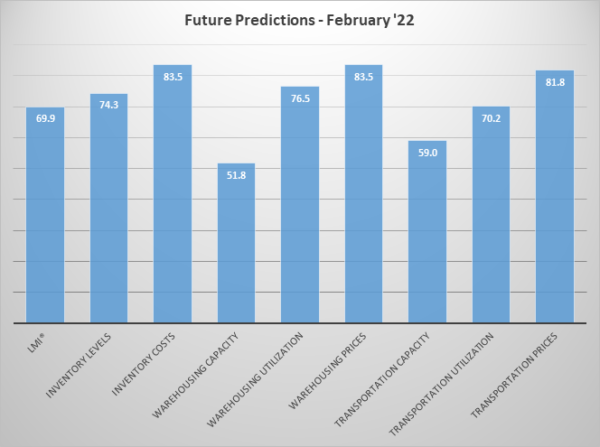
The index scores for each of the eight components of the Logistics Managers’ Index, as well as the overall index score, are presented in the table below. Six of the eight metrics show signs of growth – at increasing rates from January, while both capacity metrics continue their runs of contraction. The logistics industry remains tight and based on future predictions and industry experts seems likely to stay that way throughout 2022.
This month, both upstream (blue bars) and downstream (orange bars) firms reported considerable rates of continued growth in the utilization of logistics services. Downstream firms in particularly reported higher rates of both Warehousing and Transportation Utilization.
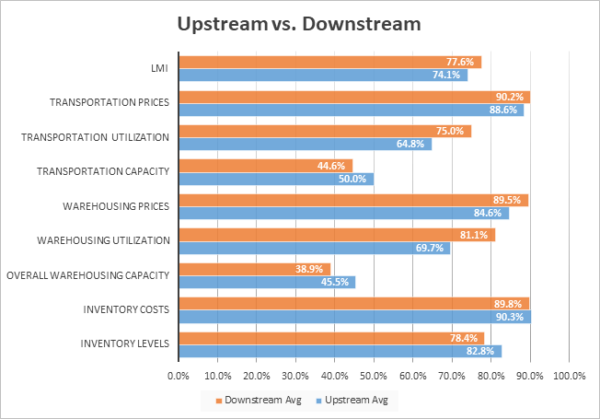
The inventory deluge discussed above has clearly made its way downstream, to the retailers who placed large orders to avoid the predicted Q4 shortages. Downstream firms reported significantly higher rates of both Warehousing Utilization (+11.4) and Transportation Utilization (+10.2) relative to their upstream counterparts. The ongoing lack of capacity combined with the unseasonable high levels of inventory has incentivized downstream firms to utilize every square inch of capacity as supply chains continue to labor under increased volume.
Respondents were asked to predict movement in the overall LMI and individual metrics 12 months from now. Their predictions for future ratings are presented below. For the next year, respondents predict a growth rate of 69.9, down slightly (-0.8) from January’s future prediction. This would portend significant levels of growth throughout 2022 – comfortably above the all-time average of 65.0. This growth is projected to be driven by continued cost growth, with all three metrics reading somewhere in the 80s. Some Transportation Capacity is expected to come online (reading in at 59.0), but Warehousing Capacity is predicted to remain stagnant, barely moving at a rate of 51.8. This pessimism is likely related to the prediction of Inventory Levels expanding at a rate of 74.3. This suggests that respondents do not anticipate enough additional capacity coming online over the next 12 months to sufficient makeup the current supply-demand mismatch.
The exact nature of the future predictions varies by supply chain position. This month we see that most clearly in the predictions for future Transportation Capacity and Warehousing Prices.
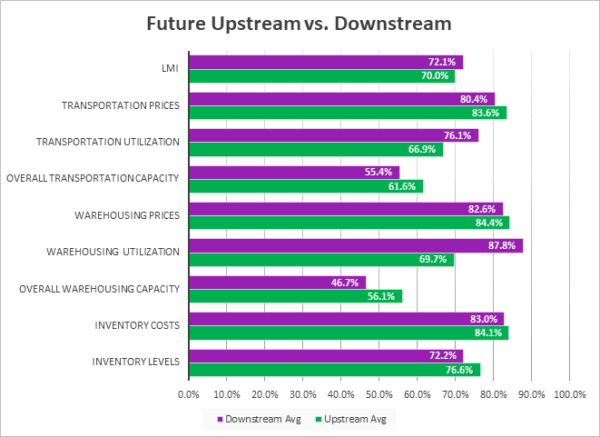
In February 2022 we detected marginal or significant differences between Upstream and Downstream predictions for three of the eight components of the LMI. Similar to the current day comparisons, Downstream firms anticipate maintaining a greater rate of both Warehousing (+18.1) and Transportation Utilization (+9.2). Downstream firms also anticipate continued contraction in Warehousing Capacity at 46.7 – down from Upstream predictions of stead growth at 56.1. This could be a function of the more expensive, harder-to-find types of urban warehousing that downstream retailers are currently trending towards.
Historic Logistics Managers’ Index Scores
This period’s along with prior readings from the last two years of the LMI are presented table below. The values have been updated to reflect the method for calculating the overall LMI:
| Month | LMI | Average for last 3 readings – 72.4
All-time Average – 65.0 High – 75.7 Low – 51.3 Std. Dev – 7.18
|
| Feb ‘22 | 75.2 | |
| Jan ‘22 | 71.9 | |
| Dec ‘21 | 70.1 | |
| Nov ‘21 | 73.4 | |
| Oct ‘21 | 72.6 | |
| Sep ‘21 | 72.2 | |
| Aug ‘21 | 73.8 | |
| July ‘21 | 74.5 | |
| June ‘21 | 75.0 | |
| May ‘21 | 71.3 | |
| Apr ‘21 | 74.5 | |
| Mar ‘21 | 72.2 | |
| Feb ‘21 | 71.4 | |
| Jan ‘21 | 67.2 | |
| Dec ‘20 | 66.7 | |
| Nov ‘20 | 70.8 | |
| Oct ‘20 | 71.6 | |
| Sep ‘20 | 70.5 | |
| Aug ‘20 | 66.0 | |
| July ‘20 | 63.0 | |
| June ‘20 | 61.7 | |
| May ‘20 | 54.5 | |
| Apr ‘20 | 51.3 | |
| Mar ‘20 | 58.9 | |
| Feb ‘20 | 52.6 |
This period along with prior readings from the last two years of the LMI is presented table below. The values have been updated to reflect the method for calculating the overall LMI:
LMI®
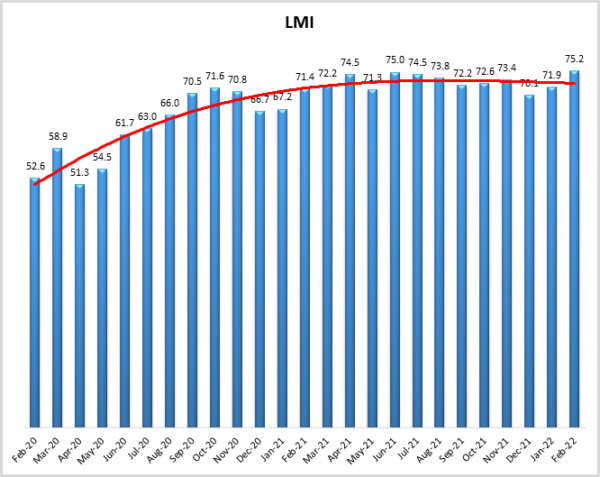
The overall LMI read in at 75.2 in February, up (+3.3) from January’s reading of 71.9. This marks 13 consecutive months of readings over 70.0, which we consider a significant rate of expansion. This is largely driven by the unseasonal spike in inventories, continued growth in price, and the lack of available capacity. The lack of capacity is likely to continue to be a problem given the level of inventory currently moving through supply chains. While this month’s reading is slightly higher (+3.8) with February 2021’s reading of 71.4, it is up significantly (+17.8) from February 2020 – the last month before the COVID lockdowns started in the U.S.
Respondents are not anticipating any significant relief over the next 12 months, predicting a growth rate of 69.9, down very slightly (-0.8) from January’s future prediction of 70.7. This level of growth would mean we stay at significant levels of expansion throughout 2022.
Inventory Levels
The Inventory Level value is 80.2, the highest value ever for the index, almost 8 points above the previous high of 72.6 from early 2018. This is also up significantly (+9.1) from last month, from last year (+16.2), and from two years ago (+31.8). As discussed in the graphic below, the rate of growth is not only very high, but quite unseasonable as well. This month, Upstream respondents reported greater inventory growth by 4.4 pts, (82.8 vs 78.4). Last month, Downstream respondents reported greater inventory growth by 1.2 pts, (71.1 vs 69.9). Beyond the drop in sales and shipping delays, it is possible that recent supply chain challenges may have taught manufacturers, suppliers, retailers, and customers that holding inventory provides an important element of resilience and are not as lean as they once were. Additionally, the square root law would predict that the trend towards more DCs to satisfy eCommerce demands could also lead to greater levels of inventory.
When asked to predict what conditions will be like 12 months from now, the average value is 74.3, scarcely changed from last months’ value (73.3). Upstream respondents are expecting higher increases in inventory than downstream (76.6 vs 72.2).
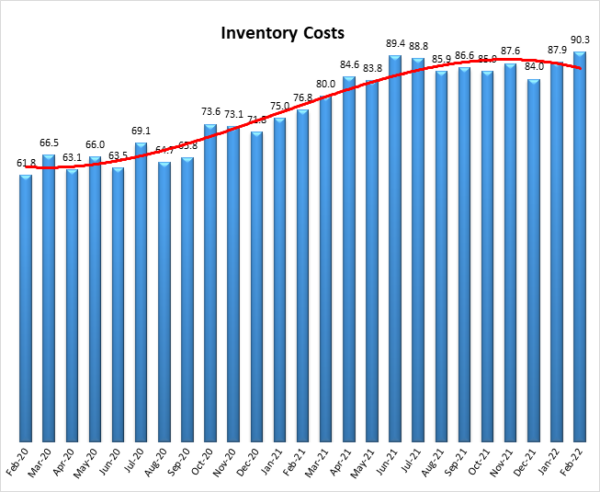
Inventory Costs
The current Inventory Costs index value of 90.3 is an all-time record for the index, 0.9 above the previous record of 89.4, set in June of 2021. Given the record high Inventory Levels index value, it is not surprising that Inventory Costs have also set a record. Since the previous record in June, inventory cost numbers have stayed high. This is up (+2.3) from January’s value of 87.9, and 13.4 and 28.5 points up from February in 2021 and 2020 respectively. Both segments of the supply chain are reporting very similar results, with upstream respondents reported higher cost growth by 0.5 points (90.3 vs 89.8).
Given the record-high inventory levels seen above, and the near-record high warehousing utilization and prices, it seems quite likely that inventory costs will continue to rise. Responses from participants are consistent with this prediction, and predict strong increases in Inventory Costs, reading in at a value of 83.5.
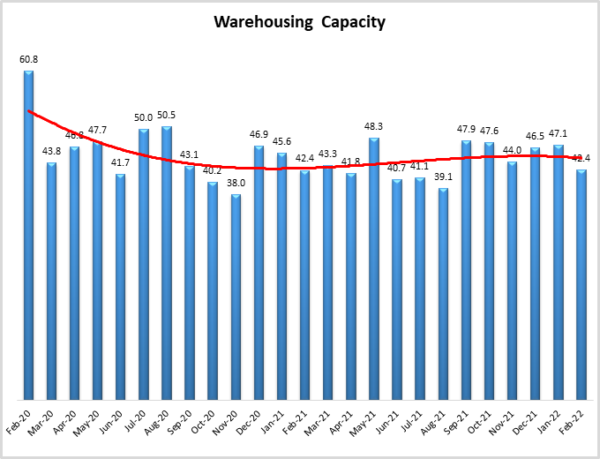
Warehousing Capacity
Warehousing capacity for the month of February 2022 registered in at 42.4 percentage points, down (-4.7) from January’s reading of 47.1. Interestingly, this value is identical to the reading one year ago. August 2020 was the last month where the index registered a value at or above 50.0. This continued contractionary pattern in the Warehouse Capacity indicates or at least suggests a systemwide need to increase overall warehousing availability. At the core of this crunch is likely the now permanent trend of online and e-commerce as the primary medium through which goods and services are acquired. In addition to this, we also have to consider the reverse supply chain implications as the volume goes out and therefore increased returns come back.
Looking forward to the next 12 months, respondents remain fairly neutral on the prospect of meaningful change to capacity. The predicted Warehousing Capacity index is for February is 51.8, up slightly (+1.0) from January’s future prediction of 50.8. While the prediction of holding steady is not incredibly optimistic, it would be at least some relief after the year and a half of contraction we have seen in this metric.
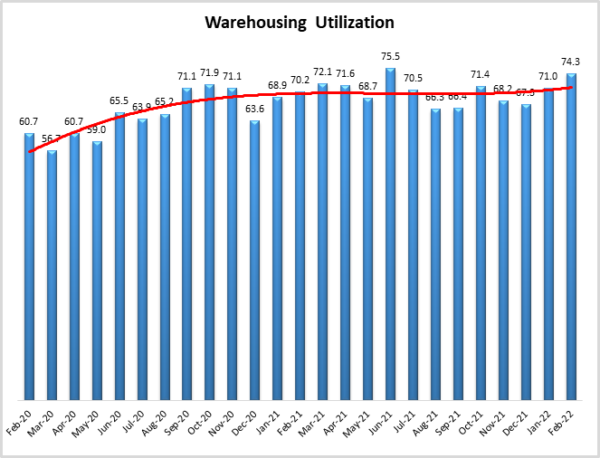
Warehousing Utilization
The Warehousing Utilization Index registered in at 74.3 for February 2022, up (+3.3) from January’s reading of 71.0, and just over four points from one year ago. When looking at the decreased capacity in injunction with this utilization increase the result is not surprising. Given the now persistent rather than typically cyclical nature of returns as well as consumption across the system it stands to reason that the trend of increased utilization will very likely continue. This of course, along with the pricing dynamics, is very likely to be moderated based on new warehousing space entering the system and increasing capacity. As a further point to these continued dynamics, the increased inventory levels from this months’ report also lend credence to the idea of e-commerce as the likely or soon to be the dominant form of consumer goods acquisition.
Looking forward to the next 12 months, the predicted Warehousing Utilization index is 76.5, down very slightly (-0.4) from January’s future prediction of 76.9 – still indicating very robust levels of growth. Respondents continue to expect to utilize increasingly greater amounts of available warehouse space throughout the year as supply struggles to keep up with demand.
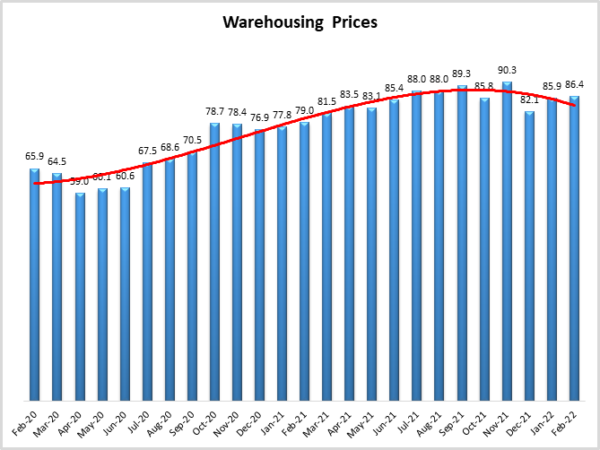
Warehousing Prices
It appears that the inflationary pressures affecting the macroeconomic environment in which global supply chains operate have not left warehousing unscathed. This month, the Warehousing Prices Index registered 86.4 percent in February 2022. This value represents A very slight increase from the prior month. In addition, while this reading is up now two months in a row it also represents over a 7-point increase for one year ago. Collectively the reduced capacity and increased utilization would, even under normal circumstances, explain the increase in pricing. That we are now approaching the two-year high of over 90 on this measure does necessitate a bit of concern. Seemingly, demand for and utilization of warehousing space has not slowed nor do our forecasts indicate, that it will. It appears that now more than ever increased capacity is required to drive down pricing. However, the question remains: even with increased capacity would demand slow? Or is this much like many other facets of our post- COVID life, “the new normal”?
Future predictions suggest that respondents are expecting prices to continue to grow at a rate of 83.5, down slightly (-0.8) from January’s future prediction of 84.3. With respondents also predicting no real growth in capacity relative to demand next year, it is unsurprising that they also expect to be paying higher prices through the rest of 2022.
Transportation Capacity
The Transportation Capacity Index registered 44.4 points in February 2022. This constitutes a small decrease (-0.4) from the January reading of 44.8. This breaks the recent upward trend in Transportation Capacity and the index remains under the critical 50 threshold. Upstream firms are not actually observing any contraction in available capacity (a first in over a year in a half), sitting right at 50.0. The same cannot be said for their Downstream counterparts, who are seeing continued rates of contraction.
The future Transportation Capacity Index decreased slightly from the previous reading, and it indicates 59.0 for the next year. As such, expectations of expanding transportation capacity for the next 12 months continue. The expectation of increases in Transportation Capacity is still stronger for upstream firms, where the future Transportation Capacity index is registering 61.6 while this index is only 55.4 for downstream firms.
Transportation Utilization
The Transportation Utilization Index registered 68.5 points in February 2022. This number denotes an increase (+6.1) from the January reading of 62.4. With this increase, the downward trend in the Transportation Utilization Index has been reversed. Upstream Transportation Utilization Index is at 64.8, while the downstream index is quite high, at 75.0. This indicates that the transportation activity is intensifying, and the utilization rates are accelerating even further for downstream companies.
It should be noted that the future Transportation Utilization Index has decreased a little, indicating a 70.2 level for the next 12 months. Despite a small drop, the future Transportation Utilization index remains well above the 50.0 thresholds, indicating continuing expectations of growth in transportation utilization. The expectations of increased Transportation Utilization are even stronger for downstream firms, where the future index registers 76.1, while the upstream transportation utilization index is 66.9.
Transportation Prices
The Transportation Prices Index registered in at 89.0 in February 2022. This corresponds to a small increase (+0.3) from the January reading of 88.7. The price pressure is even higher for downstream firms where the index is registering 90.2 (downstream price index is at 88.6). As such, the data indicates very broad and very strong upward pressure on transportation prices across the supply chains.
The future index for transportation prices indicates a value of 81.8. As such, the expectations of continued transportation price increases for the next 12 months remain strong, with the future index well above the critical level of 50.0 that indicates expansion. The price increase expectations are slightly higher for upstream firms (index is at 83.6) than for downstream firms (index is at 80.4).
About This Report
The data presented herein are obtained from a survey of logistics supply executives based on information they have collected within their respective organizations. LMI® makes no representation, other than that stated within this release, regarding the individual company data collection procedures. The data should be compared to all other economic data sources when used in decision-making.
Data and Method of Presentation
Data for the Logistics Manager’s Index is collected in a monthly survey of leading logistics professionals. The respondents are CSCMP members working at the director level or above. Upper-level managers are preferable as they are more likely to have macro-level information on trends in Inventory, Warehousing and Transportation trends within their firm. Data is also collected from subscribers to both DC Velocity and Supply Chain Quarterly as well. Respondents hail from firms working on all six continents, with the majority of them working at firms with annual revenues of over a billion dollars. The industries represented in this respondent pool include, but are not limited to Apparel, Automotive, Consumer Goods, Electronics, Food & Drug, Home Furnishings, Logistics, Shipping & Transportation, and Warehousing.
Respondents are asked to identify the monthly change across each of the eight metrics collected in this survey (Inventory Levels, Inventory Costs, Warehousing Capacity, Warehousing Utilization, Warehousing Prices, Transportation Capacity, Transportation Utilization, and Transportation Prices). In addition, they also forecast future trends for each metric ranging over the next 12 months. The raw data is then analyzed using a diffusion index. Diffusion Indexes measure how widely something is diffused, or spread across a group. The Bureau of Labor Statistics has been using a diffusion index for the Current Employment Statics program since 1974, and the Institute for Supply Management (ISM) has been using a diffusion index to compute the Purchasing Managers Index since 1948. The ISM Index of New Orders is considered a Leading Economic Indicator.
We compute the Diffusion Index as follows:
PD = Percentage of respondents saying the category is Declining,
PU = Percentage of respondents saying the category is Unchanged,
PI = Percentage of respondents saying the category is Increasing,
Diffusion Index = 0.0 * PD + 0.5 * PU + 1.0 * PI
For example, if 25 say the category is declining, 38 say it is unchanged, and 37 say it is increasing, we would calculate an index value of 0*0.25 + 0.5*0.38 + 1.0*0.37 = 0 + 0.19 + 0.37 = 0.56, and the index is increasing overall. For an index value above 0.5 indicates the category is increasing, a value below 0.5 indicates it is decreasing, and a value of 0.5 means the category is unchanged. When a full year’s worth of data has been collected, adjustments will be made for seasonal factors as well.