- LMI® at 71.4%
- Growth is INCREASING AT A INCREASING RATE for Inventory Levels, Inventory Costs, Warehousing Utilization, and Warehousing Prices, Transportation Utilization, and Transportation Prices Warehousing Capacity and Transportation Capacity are CONTRACTING
The February 2021 reading of the LMI suggests that the logistics industry has continued to expand through the beginning of the year. The February LMI reads in at 71.4, up (+4.2) from January’s reading of 67.2. This is well above the all-time average of 62.7, and significantly above (+18.8) last February’s reading of 52.6. Much of the increase in this month’s LMI are driven by increases in the rate of growth for price and cost metrics across the board. Inventory Costs, Warehousing Prices, and Transportation Prices all reached their highest levels in over two years. The high prices are likely due to the long ongoing runs of warehousing and transportation capacity contraction (contracting for six and nine consecutive months respectively). The combination of tight capacity and high prices are the primary drivers behind the increasing rate of growth detected in this month’s LMI.
In a continuation of last month, U.S. ports are slammed with a backlogged inventory. Slowing down supply chains domestically and abroad. On the last Wednesday of February, there were 58 ships either in the terminals or anchored outside of The Port of Los Angeles (Miller, 2021). This crunch has led to 13-year highs in containership charter rates and Asia-West Coast spot rates are nearing $5,000 per FEU (and 40-70% increase). Shipowners are looking to take advantage of these prices by attempting to lock these high rates in for 3-5 year contract charters[1]. The port crunch looks likely to continue as TEU volumes coming through the Port of LA in the first week of March are projected to be up by 505% from the same time last year[2]. The slow movement of ships and containers has led to a bottleneck on both sides of the Pacific, cutting shipping schedule reliability down to 34.9%, nearly halved from the 2020 average of 64%. Interestingly, despite the increased demand not many ships are being built. The order books of the three largest shipping alliances (making up 80% of the market) is only 10% of their existing fleet, down from 57% during a similar boom in 2007[3].
The inventory moving through the ports is flowing to both manufacturers and consumers. Demand for durable goods is up 3.4% in January, the most significant jump since July[4]. Additionally, U.S. household income was up 10% in January, and 49,000 jobs were added to payrolls. These increases were fueled in part by the $900 billion stimulus, which included $600 checks for many households. The House of Representatives passed an even larger $1.9 trillion bill late last week. If it passes through the Senate as well we would expect those levels to rise even more dramatically[5]. The increased consumer and industrial growth mean that the demand for logistics services will continue to grow. This poses a challenge as demand for logistics capital like trucks, ships, and warehouses increased 2-3 times faster than expected in 2020, leaving supply chains at a deficit with demand far outstripping available supply. After falling by 3.5% in 2020, analysts expect the U.S. GDP will rebound to the tune of 6.6-6.8% in 2021, and 4.3-4.5% in 2022[6]. So, on top of the increased demand that came from clogged ports and the increased growth rate for e-commerce due to the pandemic, it is likely that there will be a heightened rate of growth through the foreseeable future. This will likely lead to a continued crunch on available logistics capacity, and increased rates of growth in price.
Researchers at Arizona State University, Colorado State University, Rochester Institute of Technology, Rutgers University, and the University of Nevada, Reno, and in conjunction with the Council of Supply Chain Management Professionals (CSCMP) issued this report today.
Results Overview
The LMI score is a combination of eight unique components that make up the logistics industry, including inventory levels and costs, warehousing capacity, utilization, and prices, and transportation capacity, utilization, and prices. The LMI is calculated using a diffusion index, in which any reading above 50 percent indicates that logistics is expanding; a reading below 50 percent is indicative of a shrinking logistics industry. The latest results of the LMI summarize the responses of supply chain professionals collected in February 2021. As we have seen for most of the last nine months, February’s LMI displays continued, expansion in the logistics industry.
Overall, the LMI is up (+4..2) from January’s reading of 67.4. It is important to remember that this is a rate of growth, and not overall growth, meaning that while the logistics industry has been expanding for the last nine months, it is now doing so at a greater rate.
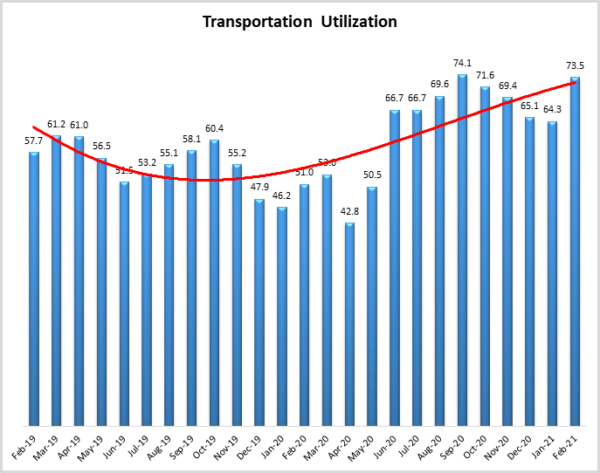
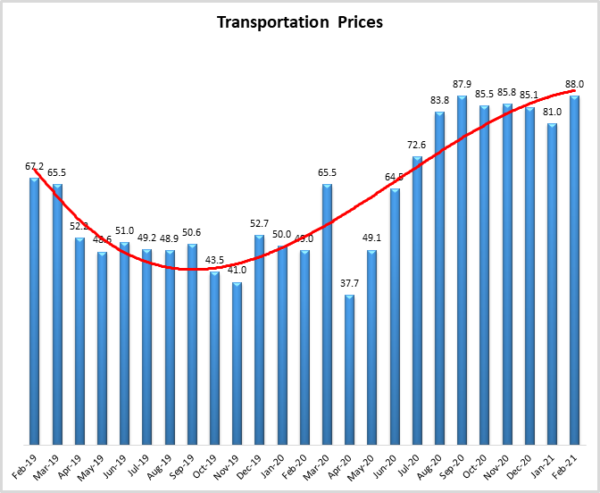
As is often the case, transportation metrics are reflective of the overall movements in the logistics industry. Transportation Capacity is down (-8.3) to 38.1, marking the ninth straight month of contraction. This has led to increases in both Transportation Utilization, up 9.2 points to 73.5, as well as Transportation Price, up 7.0 points to 88.0. This is the seventh consecutive month Transportation Prices have read in the ’80s, a streak of high growth rates in Q3 of 2018. This is a sharp contrast with this time a year ago when Transportation Prices read in 39 points lower at 49.0.
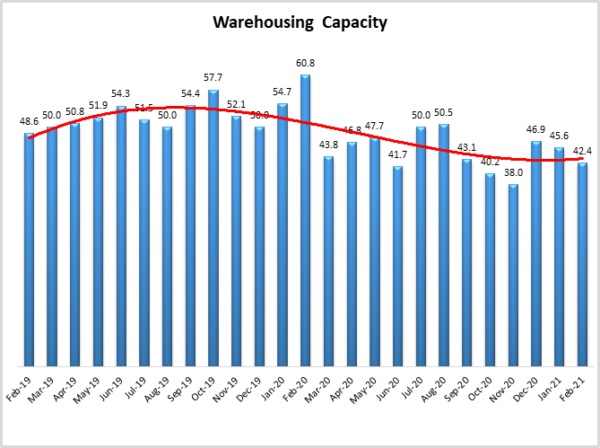
Warehouse metrics are following a similar pattern. Warehousing Capacity is down (-3.2) to 42.4. This is 18.4 points down from February 2020, when available capacity was expanding at a rate of 60.8. This is the sixth consecutive, and tenth of 12 months that this metric has contracted. The scarcity of available capacity has led to increases in both utilization, up 9.2 points to 70.2, as well as price, up 7.0 to 79.0. The increase in the growth of warehouse price is particularly driven by upstream firms, who reported a growth rate of 85.5, 16.4 points higher than the steady 69.1 rate of growth reported by their downstream counterparts.
The lack of warehouse space has led to an increased rate of Inventory Costs, which are up (+1.8) to 76.8. Inventory Levels are also up (+1.5) to a reading of 64.0. This is consistent with the speculation put forth in last month’s report that due to the constrained space, smaller increases in the amount of inventory being held is leading to price increases of a greater magnitude due to the marginal increasing cost of holding additional inventory.
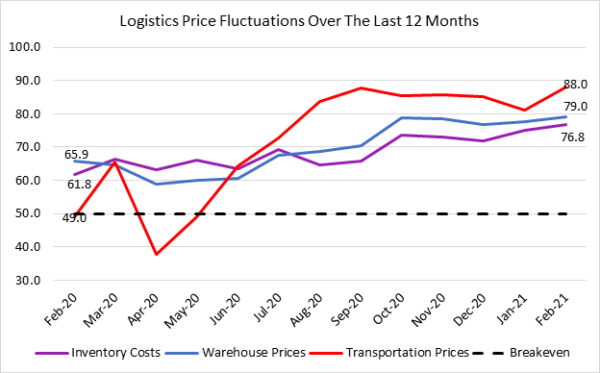
As mentioned above, price metrics are up across the board. The figure below presents movements across all three price metrics over the last 12 months. Any data point beneath the dotted black breakeven line indicates contraction, anything above indicates growth. Inventory Costs (purple line), Warehouse Prices (blue line), and Transportation Prices (red line) all exceeded their two-year highs in February. This is a marked change from this time a year ago. Over the past year, Inventory Costs are up 15.0 points, Warehousing Prices have increased by 13.1 points, and Transportation Prices are up a staggering 39.0 points. This increase in price reflects the still-widening gap between the demand for logistics services and the available supply of them.
The index scores for each of the eight components of the Logistics Managers’ Index, as well as the overall index score, are presented in the table below. Six of the eight metrics show signs of growth, with both capacity metrics continuing their run of contraction. Inventory and warehouse metrics are up, and transportation is slightly down, but still growing at significant rates Overall, we are observing significant growth through the first month of 2021.
| LOGISTICS AT A GLANCE | |||||
| Index | February 2021 Index | January 2021 Index | Month-Over-Month Change | Projected Direction | Rate of Change |
| LMI® | 71.4 | 67.2 | +4.2 | Growing | Increasing |
| Inventory Levels | 64.0 | 62.5 | +1.5 | Growing | Increasing |
| Inventory Costs | 76.8 | 75.0 | +1.8 | Growing | Increasing |
| Warehousing Capacity | 42.4 | 45.6 | -3.2 | Contracting | Increasing |
| Warehousing Utilization | 70.2 | 68.9 | +1.3 | Growing | Increasing |
| Warehousing Prices | 79.0 | 77.8 | +1.2 | Growing | Increasing |
| Transportation Capacity | 38.1 | 46.3 | -8.3 | Contracting | Increasing |
| Transportation Utilization | 73.5 | 64.3 | +9.2 | Growing | Increasing |
| Transportation Prices | 88.0 | 81.0 | +7.0 | Growing | Increasing |
This month, both upstream and downstream firms reported significant continued growth in utilization of logistics services, albeit in somewhat different ways. Upstream firms such as 3PLs or carriers (represented by the orange bars) reported more robust growth across all eight metrics in February.
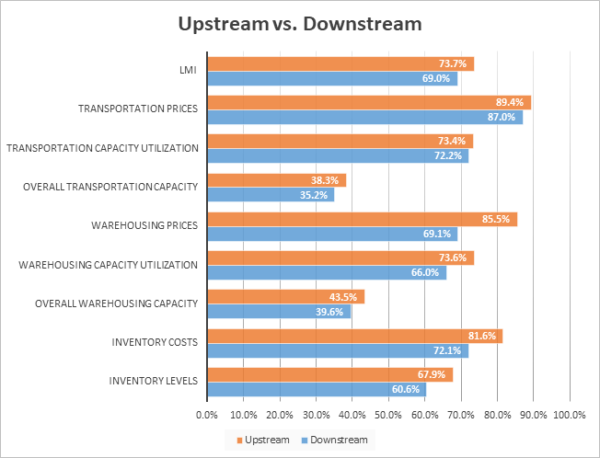 T-tests demonstrate that upstream firms expect to see Warehousing Prices increase at a significantly faster rate than their downstream counterparts. This suggests that firms further up the supply chain (who may have to hold greater levels of inventory) will continue to struggle to find relief from already-high warehouse and storage prices.
| February ‘21 | Inv. Lev. | Inv. Costs | WH Cap. | WH Util. | WH Price | Trans Cap | Trans Util. | Trans Price |
| Downstream | 60.6 | 72.1 | 39.6 | 66.0 | 69.1 | 35.2 | 72.2 | 87.0 |
| Upstream | 67.9 | 81.6 | 43.5 | 73.6 | 85.5 | 38.3 | 73.4 | 89.4 |
| Delta (abs) | 7.3 | 9.5 | 3.9 | 7.5 | 16.4 | 3.1 | 1.2 | 2.3 |
| Significant? | No | No | No | No | Yes | No | No | No |
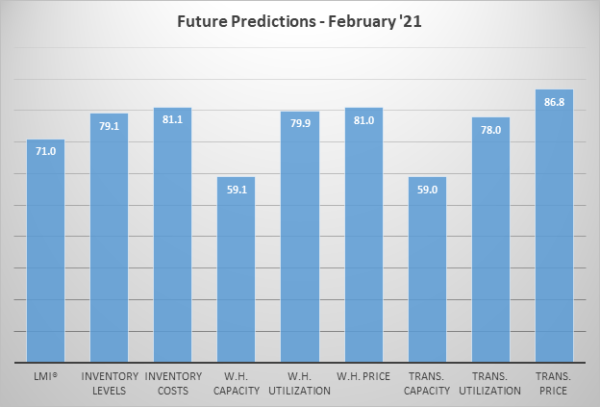
Respondents were asked to predict movement in the overall LMI and individual metrics 12 months from now. Their predictions for future ratings are presented below. They predict that prices will continue to grow at high levels across the board. While respondents believe warehousing and transportation will be coming online at a moderate clip of 59 each, it is likely that will not be sufficient to establish an equilibrium between supply and demand over the next 12 months. Demand for logistics services jumped forward by 2-3 years in 2020, it may take more than a year of building up additional capacity to catch up.
When asked to predict movement 12 months from now, upstream firms expect Warehouse Prices to grow 10 points faster than their downstream counterparts (85 to 75). Interestingly, Downstream firms expect to utilize available warehousing at an 8-point greater rate than upstream firms (84 to 76) to hold significantly higher levels of inventory (by nearly 15 points) than their downstream counterparts. Respondents seem to expect that, while upstream firms will continue to hold high levels of inventory, downstream firms will enact a JIT strategy in which goods move through the system quickly, and they utilize as much space as they can.
| Future Readings | Inv. Lev. | Inv. Costs | WH Cap. | WH Util. | WH Price | Trans Cap | Trans Util. | Trans Price |
| Downstream | 76.4 | 79.8 | 58.5 | 84.0 | 75.5 | 60.2 | 75.9 | 85.8 |
| Upstream | 80.3 | 81.3 | 57.7 | 76.1 | 85.0 | 56.5 | 78.6 | 86.9 |
| Delta (abs) | 3.9 | 1.5 | 0.7 | 7.9 | 9.5 | 3.7 | 2.6 | 1.0 |
| Significant? | No | No | No | Marginal | Yes | No | No | No |
Historic Logistics Managers’ Index Scores
This period’s along with prior readings from the last two years of the LMI is presented table below. The values have been updated to reflect the method for calculating the overall LMI:
| Month | LMI | Average for previous readings – 62.7
High – 75.7 Low – 51.3 Std. Dev – 6.44
|
| Feb ‘21 | 71.4 | |
| Jan ‘21 | 67.2 | |
| Dec ‘20 | 66.7 | |
| Nov ‘20 | 70.8 | |
| Oct ‘20 | 71.6 | |
| Sep ‘20 | 70.5 | |
| Aug ‘20 | 66.0 | |
| July ‘20 | 63.0 | |
| June ‘20 | 61.7 | |
| May ‘20 | 54.5 | |
| Apr ‘20 | 51.3 | |
| Mar ‘20 | 58.9 | |
| Feb ‘20 | 52.6 | |
| Jan ‘20 | 54.1 | |
| Dec ‘19 | 54.0 | |
| Nov ‘19 | 54.4 | |
| Oct ‘19 | 54.4 | |
| Sep ‘19 | 56.6 | |
| August ‘19 | 56.6 | |
| July ‘19 | 57.2 | |
| June ‘19 | 56.0 | |
| May’19 | 56.7 | |
| April ‘19 | 57.9 | |
| March ‘19 | 60.41 | |
| February ‘19 | 61.95 |
LMI®
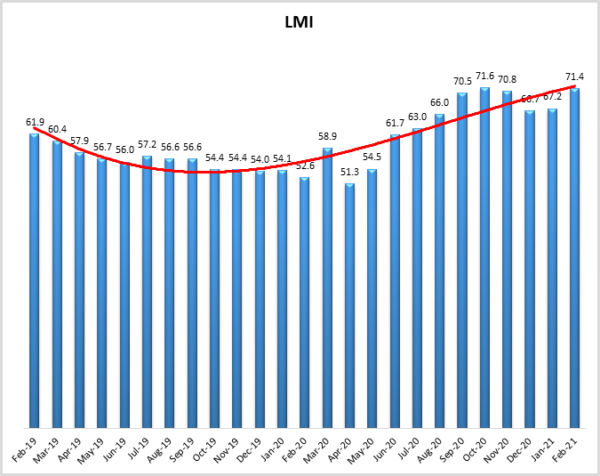
The overall LMI index is 71.4, up (4.2) from January’s reading of 67.2. This is the second-highest score for the overall index in the last two years, behind only the 71.6 measured in October. This increase is driven by continued expansion across all non-capacity metrics, including 2-year highs for all three price metrics. February’s reading is significantly higher than the index-average LMI score of 62.7.
Respondents expect some loosening of capacity constraints but continuous growth in prices over the next 12 months, leading to a future LMI prediction of 71.0, up slightly (+2.6) from January’s future prediction of 68.4, Given this, it would seem that the logistics industry is primed to continue its steady rate of growth over the next 12 months.
Inventory Levels
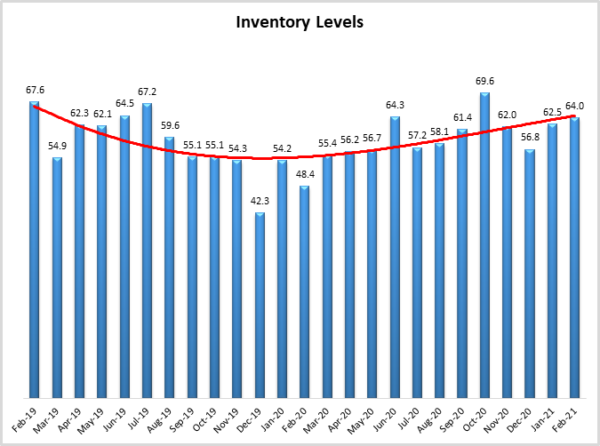
The Inventory Level value is 64.0, up (+1.5) from January’s reading of 62.5. The current value is considerably higher (+15.6) than the same time last year. Since November of 2016, there has been a consistent trend of inventory growth (50 or higher), with only two values indicating a contraction in inventory levels. Upstream respondents returned a value of 67.9, compared to 60.6 for downstream respondents. Both represent growth in inventory levels, but upstream respondents are experiencing greater growth, by 7.3 points. This is similar to last month when upstream values were 5.9 points higher than upstream. We see both upstream and downstream respondents reporting growth, but upstream is still growing faster.
When asked to predict what conditions will be like 12 months from now, the average value is 79.1, up (+10.0) from January’s future prediction of 69.0. Thus, the projected increase is greater than last month’s but indicates that respondents expect inventory values to continue increasing significantly over the next year.
Inventory Costs
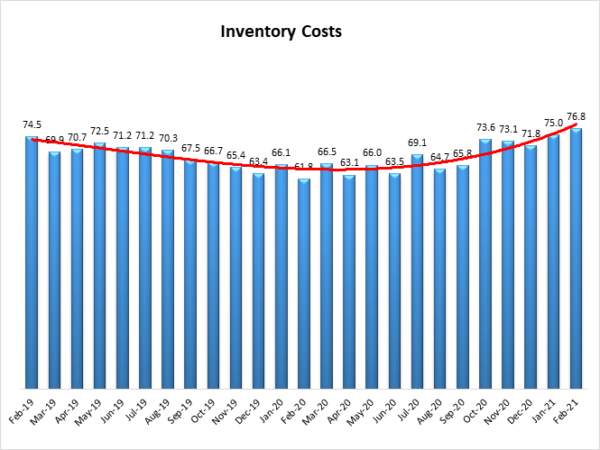
Given the continued increases in inventory levels, it is not surprising that inventory costs have continued to increase. The current value is 76.8, up (+1.8) points from January’s reading of 75.0. These continued high levels indicate strong continued growth in inventory costs, a bit above the long-term average of 70.3. The current value is 15.0 points above the value last year at this time, meaning cost growth has increased significantly over the last 12 months.
Responses from participants seem consistent with this hypothesis. When asked about what they expect inventory costs to be like 12 months from now, the index value is 81.1, consistent with last month’s prediction of 81.1. Upstream (81) and downstream (80) gave nearly identical responses.
Warehousing Capacity
The Warehousing Capacity Index registered 42.4 percent in February 2021, which means that warehouse capacity is contracting at an increasing rate for the third month in a row, being the 6th consecutive month below the 50-point mark, indicating contraction in this space. This is down rather modestly from last month, showing a 3.2 percentage point decline. In addition, this reading is sharply down by over 18 percentage points from the reading one year ago (February 2020 registered in at 60.8). Previous predictions from the LMI reports indicated that “the shift in consumer behavior as a result of the pandemic” and the continued growth bets that “e-commerce retailers are making with respect to future growth.” It appears that aside from the exogenous shock that the COVID pandemic has caused, its shift may be rather permanent.
Looking forward to the next 12 months, the predicted Warehousing Capacity index is predicted to increase at a rate of 59.1, up significantly (+7.3) from January’s future prediction of 51.8. This indicates that respondents are becoming more hopeful regarding new storage facilities coming online. However, given their future predictions on price, the new capacity may not be enough to cover the growing demand.
Warehousing Utilization
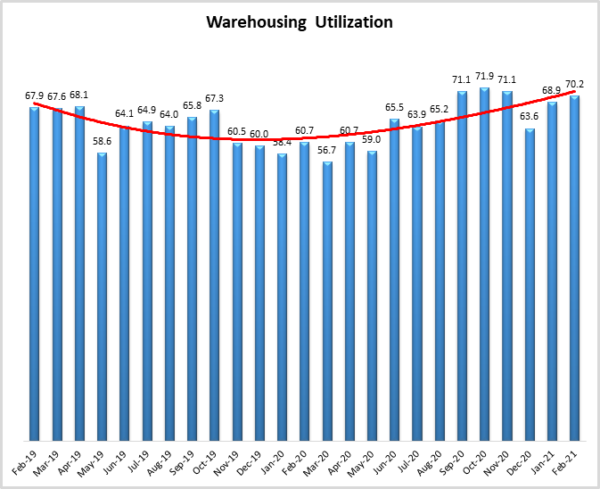
The Warehousing Utilization Index registered 70.2 percent in February 2021. This represents a rather modest 1.3 percentage point increase from last month and is up rather dramatically by nearly 10 percentage points from the February 2021 reading of 60.7. This increase in the rate at which the utilization is increasing over the past few months, coupled with the warehousing capacity dynamics (i.e. continued contraction) provides evidence to suggest that the previous month’s prediction that a market shift may occur, could be coming to fruition. As noted above, and in previous reports, the behavioral shift in commerce seems to be made manifest in the reduction in capacity and the increase in the rate at which the utilization is growing.
Looking forward to the next 12 months, the predicted Warehousing Utilization index is 79.9, up (+6.2) from January’s future prediction of 73.7. Respondents expect to utilize increasingly greater amounts of available warehouse space throughout the year as supply struggles to keep up with demand.
Warehousing Prices
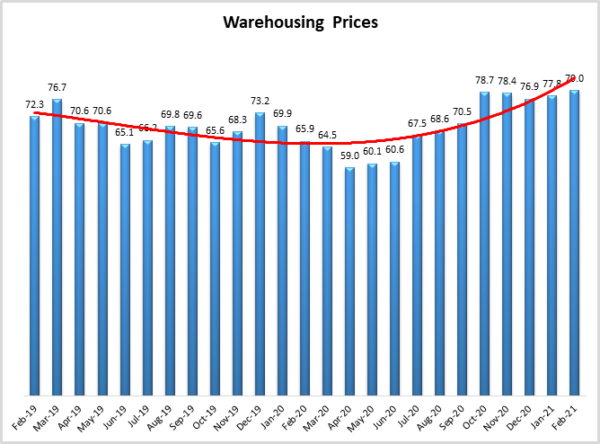
Warehousing Prices Index registered 79.0 percent in February 2021. This reading represents a rather negligible increase of just over 1 percentage point from last month, which (though marginally) continues the trend in the increased growth rate in warehousing prices amid the COVID-19 disruption(s), and previous holiday season preparations. This reading is also up by a staggering 13 percentage points from the reading one year ago. Previous predictions focused on the increase in utilization, and decrease in capacity to suggest that there would continue to be upward pressure on pricing. Indeed, and again as was indicated in the previous month, that the pricing index for warehousing has been above 60% (i.e. vastly increasing rates) since May of 2020, and has not dipped below the 50-point mark for over 24 months. These colliding trends led to the previous month’s suggestion that “should this trend continue, much more warehouse capacity needs to come online for pricing to come down”, and indeed, this remains to be the case.
Future predictions suggest that respondents are expecting prices to continue to grow at a rate of 81.0, down slightly (-2.0) from January’s future prediction of 83.0. While more warehouse capacity is expected to come online in 2021, respondents do not anticipate that it will be enough to significantly stem the tide of rising prices.
Transportation Capacity
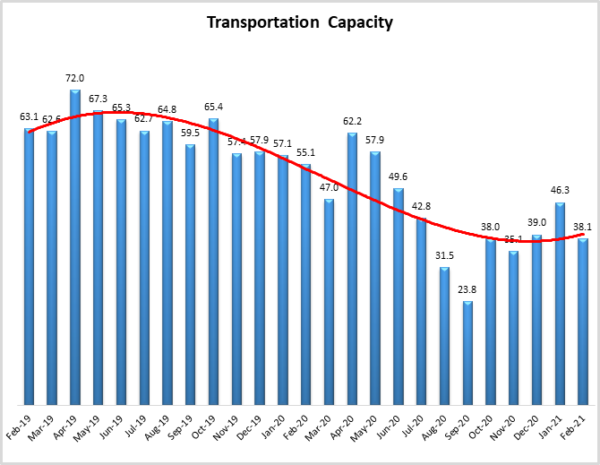
The Transportation Capacity Index registered 38.1 percent in February 2021. This constitutes a decrease of 8.2 percentage points from the January reading of 46.3. This sharp decrease is not only the 9th consecutive reading below 50.0, but it also indicates a return to accelerated contraction. This data point is certainly in line with recent reports of capacity shortages and operational difficulties across all modes of transportation. It will be interesting to see if this metric ticks back towards expansion, as respondents believe more capacity will be coming online at some point over the next year.
On the other hand, the future Transportation Capacity Index indicates 59.0 for the next year. While this denotes a slight drop from the previous projection of 61.4 it remains above 50, indicating expectations of expanding transportation capacity in the next 12 months.
Transportation Utilization
The Transportation Utilization Index registered 73.5 percent in February 2021. This number denotes a jump of 9.2 points from the December reading of 64.3, bringing the index within .6 points of the recent high of 74.1 registered in September 2020. Hence, this month, we have the second-highest transportation utilization rate recorded in the last two years.
It should be noted that the future Transportation Utilization Index is also up from the previous month (+4.5) indicating 78 percent level for the next 12 months. As such, expectations of continued growth in transportation utilization are also getting stronger.
Transportation Prices
The Transportation Prices Index registered 88.0 percent in February 2021. This corresponds to a jump of 7 percent from the January transportation prices reading of 81.0 and constitutes a new 2-year record high. This is the ninth consecutive month of increasing Transportation Prices. The upward pressure on transportation prices that gained momentum in the fall months of 2020 is even stronger now.
It looks like the upward pressure on transportation prices is here to stay, with the future index for transportation prices indicating a value of 86.8, which is also up from the previous month’s expectations of 79.9. Even with more capacity coming online over the next year respondents continue to predict strong price growth over the next 12 months.
About This Report
The data presented herein are obtained from a survey of logistics supply executives based on information they have collected within their respective organizations. LMI® makes no representation, other than that stated within this release, regarding the individual company data collection procedures. The data should be compared to all other economic data sources when used in decision-making.
Data and Method of Presentation
Data for the Logistics Manager’s Index is collected in a monthly survey of leading logistics professionals. The respondents are CSCMP members working at the director-level or above. Upper-level managers are preferable as they are more likely to have macro-level information on trends in Inventory, Warehousing, and Transportation trends within their firm. Data is also collected from subscribers to both DC Velocity and Supply Chain Quarterly as well. Respondents hail from firms working on all six continents, with the majority of them working at firms with annual revenues of over a billion dollars. The industries represented in this respondent pool include, but are not limited to Apparel, Automotive, Consumer Goods, Electronics, Food & Drug, Home Furnishings, Logistics, Shipping & Transportation, and Warehousing.
Respondents are asked to identify the monthly change across each of the eight metrics collected in this survey (Inventory Levels, Inventory Costs, Warehousing Capacity, Warehousing Utilization, Warehousing Prices, Transportation Capacity, Transportation Utilization, and Transportation Prices). In addition, they also forecast future trends for each metric ranging over the next 12 months. The raw data is then analyzed using a diffusion index. Diffusion Indexes measure how widely something is diffused, or spread across a group. The Bureau of Labor Statistics has been using a diffusion index for the Current Employment Statics program since 1974, and the Institute for Supply Management (ISM) has been using a diffusion index to compute the Purchasing Managers Index since 1948. The ISM Index of New Orders is considered a Leading Economic Indicator.
We compute the Diffusion Index as follows:
PD = Percentage of respondents saying the category is Declining,
PU = Percentage of respondents saying the category is Unchanged,
PI = Percentage of respondents saying the category is Increasing,
Diffusion Index = 0.0 * PD + 0.5 * PU + 1.0 * PI
For example, if 25% say the category is declining, 38% say it is unchanged, and 37% say it is increasing, we would calculate an index value of 0*0.25 + 0.5*0.38 + 1.0*0.37 = 0 + 0.19 + 0.37 = 0.56, and the index is increasing overall. For an index value above 0.5 indicates the category is increasing, a value below 0.5 indicates it is decreasing, and a value of 0.5 means the category is unchanged. When a full year’s worth of data has been collected, adjustments will be made for seasonal factors as well.
Logistics Managers Index
Requests for permission to reproduce or distribute Logistics Managers Index Content can be made by contacting in writing at Dale S. Rogers, WP Carey School of Business, Tempe, Arizona 85287, or by emailing [email protected] Subject: Content Request.
The authors of the Logistics Managers Index shall not have any liability, duty, or obligation for or relating to the Logistics Managers Index Content or other information contained herein, any errors, inaccuracies, omissions, or delays in providing any Logistics Managers Index Content, or for any actions taken in reliance thereon. In no event shall the authors of the Logistics Managers Index be liable for any special, incidental, or consequential damages, arising out of the use of the Logistics Managers Index. Logistics Managers Index and LMI® are registered trademarks.
About The Logistics Manager’s Index®
The Logistics Manager’s Index (LMI) is a joint project between researchers from Arizona State University, Colorado State University, University of Nevada, Reno, Rochester Institute of Technology, and Rutgers University, supported by CSCMP. It is authored by Zac Rogers Ph.D., Steven Carnovale Ph.D., Shen Yeniyurt Ph.D., Ron Lembke Ph.D., and Dale Rogers Ph.D.