All five major transportation modes – truck, rail, pipeline, vessel and air – carried less U.S. freight with North American Free Trade Agreement (NAFTA) partners Canada and Mexico by value in 2015 than in 2014. The total value of cross-border freight carried on all modes fell 7.2 percent from 2014 to $1.1 trillion in current dollars, according to the U.S. Department of Transportation’s Bureau of Transportation Statistics (BTS).
The value of commodities moving by truck declined 0.4 percent, the smallest decrease from 2014 to 2015 of any mode, 0.4 percent. The value of freight on other modes also declined: air 1.8 percent; rail 7.1 percent; vessel 29.7 percent; and pipeline 39.4 percent. A drop in the price of crude oil in 2015 played a key role in the large declines in the dollar value of goods shipped by vessel and pipeline. Average monthly prices for crude petroleum and refined fuel are available from theU.S. Energy Information Administration.
The 7.2 percent decline in the value cross-border freight from 2014 to 2015 was almost entirely due to the decline in crude oil and petroleum prices. The value of petroleum-related commodity shipments declined almost 40 percent year-over-year while the value of other freight dropped 0.9 percent. In 2015, petroleum-related commodities comprised 10.8 percent of the total value of U.S. North American freight, down from 16.6 percent in 2014. Some data used to calculate the percentages in this paragraph comes from US International Trade Commission Interactive Tariff and Trade Data, which allows the separation of petroleum and non-petroleum components of mineral fuels.
Freight by Mode
- Trucks carried 64.3 percent of U.S.-NAFTA freight, a 2.2 percentage point increase from 2005, and continued to be the most heavily utilized mode for moving goods to and from both U.S.-NAFTA partners. Trucks accounted for $359.8 billion of the $589.9 billion of imports (61.0 percent) and for $351.9 billion of the $516.4 billion of exports (68.2 percent).
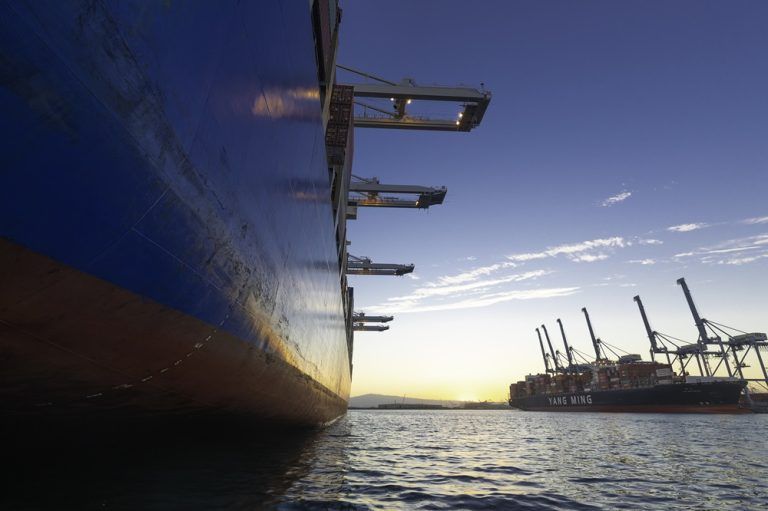
- Rail remained the second largest mode, moving 14.9 percent of all U.S.-NAFTA freight, followed by vessel, 6.6 percent; pipeline, 5.2 percent and air, 3.9 percent. The surface transportation modes of truck, rail and pipeline carried 84.4 percent of the total value of U.S.-NAFTA freight flows.
- During the last decade, rail’s percentage share rose 0.2 points while pipeline fell 1.4 points. The category of all modes of transportation cited in the following tables includes freight movements by truck, rail, vessel, pipeline, air, other and unknown modes of transport.
Freight with Canada
From 2014 to 2015, the value of U.S.-Canada freight flows fell 12.6 percent to $575.2 billion. Trucks carried 58.3 percent of the value of the freight to and from Canada, followed by rail, 15.7 percent; pipeline, 9.3 percent; vessel, 4.9 percent; and air, 4.7 percent. The surface transportation modes of truck, rail and pipeline carried 83.3 percent of the value of total U.S.-Canada freight flows.
Freight with Mexico
From 2014 to 2015, the value of U.S.-Mexico freight fell 0.6 percent to $531.1 billion. Trucks carried 70.9 percent of the value of the freight to and from Mexico, followed by rail, 14.1 percent; vessel, 8.5 percent; air, 3.1 percent; and pipeline, 0.7 percent. The surface transportation modes of truck, rail and pipeline carried 85.7 percent of the value of total U.S.-Mexico freight flows.
See BTS Transborder Statistics Annual Release for summary tables and additional data. See North American Transborder Freight Data on the BTS website for additional data for surface modes since 1995 and all modes since 2004.