- LMI® at 69.7
- Growth is INCREASING AT AN INCREASING RATE for: Inventory Levels, Warehousing Utilization, Warehousing Prices, Transportation Utilization, and Transportation Prices.
- Growth is INCREASING AT A
- DECREASING RATE for Inventory Levels
- Warehousing Capacity and Transportation Capacity are CONTRACTING
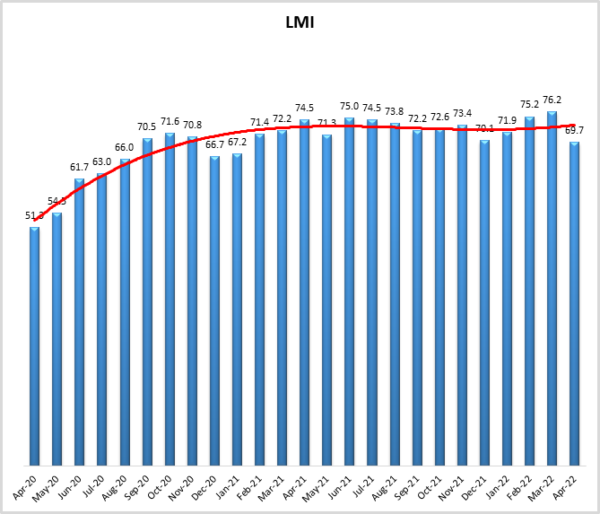
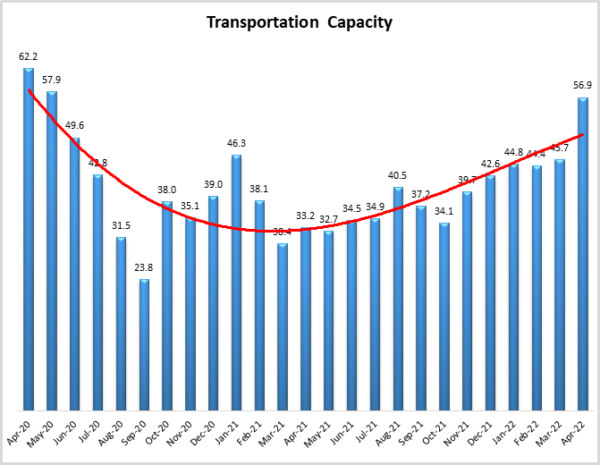
After reaching an all-time high of 76.2 in March, the overall LMI is down (-6.5) to 69.7 in April. This slowdown (which should be pointed out is still comfortably above the all-time average of 65.3) is largely driven by a shift in Transportation metrics. After 23 consecutive months of contraction Transportation Capacity has finally shifted back into expansion, bumping up 11.2 points to a reading of 56.9. There was an equivalent dip in Transportation Price expansion, down 15.8 points to 73.9. Despite the slowdown in transportation, respondents still indicate growth in the sector, just at a slower pace than what we’ve seen over the last 18 months. There is much less change in Inventory and Warehousing metrics as costs continue to grow and capacity remains tight
Researchers at Arizona State University, Colorado State University, Rochester Institute of Technology, Rutgers University, and the University of Nevada, Reno, and in conjunction with the Council of Supply Chain Management Professionals (CSCMP) issued this report today.
Results Overview
The LMI score is a combination of eight unique components that make up the logistics industry, including inventory levels and costs, warehousing capacity, utilization, and prices, and transportation capacity, utilization, and prices. The LMI is calculated using a diffusion index, in which any reading above 50 percent indicates that logistics is expanding; a reading below 50 percent is indicative of a shrinking logistics industry. The latest results of the LMI summarize the responses of supply chain professionals collected in April 2022. Overall, the LMI is down (-6.5) from March’s all-time high reading of 75.2. The dip is fueled by the first expansion of Transportation Capacity in nearly two years and a subsequent dip in the rate of growth for Transportation Prices. Inventory and Warehousing metrics remain are down slightly but still, show high rates of growth as supply chains continue struggling to find the capacity needed to deal with high levels of inventory.
The economy is clearly in a complex place. GDP in the U.S. was down 1.4% year-over-year and 0.4% when adjusted for inflation. Interestingly, consumer spending grew through Q1, up 0.7%[1]. April was also tough on the market, the Nasdaq dipped 4.2% on the final Friday of April, capping off the worst month for the composite index since the recession of 2008. Since the start of 2022 the Nasdaq is down 21%, the S&P 500 is down 13%, and the Dow is off by 9%[2]. At the same time, wages continue to grow, up about 6% from a year ago, and unemployment remains low at 3.6%[3]. Goldman Sachs reports that the US. Currently has 5.3 million more available jobs than it does workers – the highest this gap has been since the end of World War 2[4] (Goldman Sachs, 2022).
The large shifts in Transportation Prices (gold line) and Transportation Capacity (maroon line) over the six-year history of the LMI can be seen in the chart below. We have often stated that transportation metrics are the most dynamic piece of the LMI and the most reflective of the overall economy. Specifically, anytime there is an inversion between the lines representing Transportation Prices or Capacity, it usually means there has been some shift in the overall economy. For instance, after experiencing a 65-point spread in April of 2018 (coming on the heels of the Republican Tax Cut), there was an inversion in early 2019 as the freight market slowed dramatically – particularly upstream. This inversion, during which thousands of carriers went out of business, lasted until the outbreak of COVID-19 in America in early 2020. Transportation Price exceeded Capacity in March of 2020 as goods were pushed forward in anticipation of lockdown, and then dropped down again from April to May as much of the world fell into lockdown. The most recent inversion occurred in June 2020 as some restrictions lifted and supply chains shifted into high gear in an attempt to first make up the deficit built up during lockdowns, and then simply to keep up with burgeoning international demand. The deficit between Transportation Prices and Costs was near its peak a year ago with a 59.4-point spread. Today, that spread is only 17 points as the last two months have seen prices drop dramatically, and Capacity shift from contraction to expansion. It can be observed that the two curves have not yet inverted, suggesting that while the frantic pace in the transportation market has slowed down, we have not yet tilted into a full-on recession.
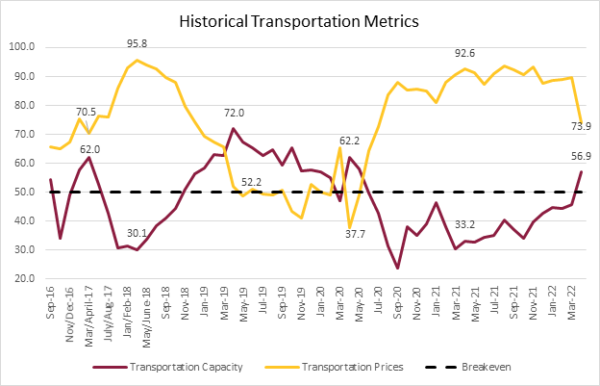
The freight market has slowed, but it has not stopped. In late April, FreightWaves’ tender rejection index sat at 10.89%, a far cry from its reading of 25.45% at this time last year. This tells us that carriers had the capacity to take 3 out of every 4 loads available in April 2021 but can pick up roughly 9 out of 10 in April 2022. This is reflected in our Transportation Capacity metric, which as predicted in last month’s report moved from contraction up (+11.2) to expansion at a rate of 56.9. It should be noted that during April 2019 the tender rejection rate was just over 4%[5], so although a rate of 10-11% is down from the robust market carriers have been dealing with over the last 18 months, it is still double the rates observed during the freight recession of 2019. Interestingly, there are also reports that over 37,000 trailers were ordered in March – the highest figure since December 2020[6]. Demand for trailers has outstripped supply for the last 18 months, it will be interesting to observe whether this demand remains high, or if this was a temporary blip. Orders for new Class-8 trucks also remain fairly consistent, with very few order cancellations as firms as hesitant to “get out of line” when they’ve been waiting for a year or more for new capacity to come online[7].
Transportation Price growth is down sharply (-15.8) from March’s reading of 89.7. While this slowdown is significant, price growth is still healthy (April’s reading of 73.9 is only a half-point lower than the metric’s all-time average of 74.4). with the increased capacity Transportation Utilization is down (5.5) slightly as well, although like Prices it is still growing at a rate similar to the all-time mean (64.4 – 0.1 points above April’s reading). At this point, the overall numbers suggest that the freight market is regressing back towards the mean. However, it should be acknowledged that smaller carriers, or perhaps carriers who came into the market very recently to take advantage of the rate of growth, may struggle with lower demand as shippers might be able to move away from the spot market and back towards contracted rates with more established carriers. Additionally, smaller carriers will have a more difficult time adjusting to the higher cost of fuel (which we discuss below) as they cannot purchase it at wholesale prices. On the other hand, the shifts in transportation metrics represent relief for smaller shippers as they are now able to move freight more easily, with some even reporting cold calls for carriers looking for loads – something that would have been unfathomable just a few months ago[8]. What we may be seeing is freed up capacity now available to service pent-up demand. The consumer economy is the primary driver of the U.S. economy and consumer spending grew through Q1, up 0.7%[9]. We may be seeing supply chains reset themselves more than we are seeing consumer sentiment fall off the deep end. Consumer spending held up the economy during the downturn in 2019 as well, but whether that can continue in the face of the highest rates of inflation the U.S. has experienced since the early 1980s, along with slower growth abroad limiting trade, remains an open question. The option to move from expensive over-the-road options to intermodal is limited as well, as railroads remain congested, and a paucity of available rail cars is making it more difficult to ship a plethora of items, including important agricultural products like grain or fertilizer[10]. The rail issues are due to both a lack of workers and increased demand as more shippers utilize intermodal transportation to avoid the high costs of over-the-road transportation.
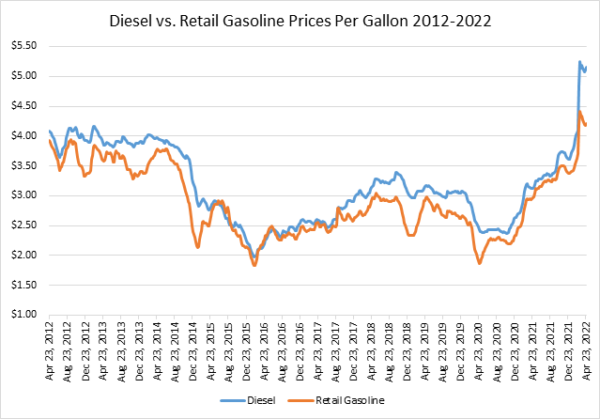
The primary driver of this inflation has been increased fuel prices. Data from the U.S. Energy Information Administration (EIA) was used to make the chart below tracking the price of diesel (blue line) and retail gasoline (orange line) in the U.S. over the last 10 years. Diesel prices were above $5.16/gallon in the last week of April and have been above $5/gallon – a threshold that had never been crossed – since mid-March[11]. Historically, diesel and retail gasoline have moved together, but the pressures of 2022 are driving the two metrics further apart than what we might normally expect. Case in point, from 2012 to 2021, the average spread between diesel and gasoline in the U.S. was $0.26; through the first 17 weeks of 2022, It has been $0.59. This spread was elevated throughout the month, ranging from $0.87 in the first week to $0.95 in the last week of April. Diesel is up 43% from the last week of December, whereas gasoline is “only” up by 25%. This has a significant impact on inflation as diesel fuel is used to move the vast majority of class-8 trucks as well to operate a significant amount of industrial machinery (notably in the agriculture sector). Beyond the obvious reasons, such as the Russian invasion of Ukraine cutting off key diesel supply, this increased spread may also indicate hoarding-type practices as large carriers make significant wholesale purchases to take advantage of quantity discounts as well as to avoid potential price increases further down the road. Importantly, the ability to increase U.S. oil production is currently limited by shortages in steel, workers, and other equipment needed to increase drilling activities. At a time when more American oil is needed, the Association of American Railroads is reporting that U.S. carloads of petroleum and petroleum products are down 15.5% through the first four months of 2022[12].
It is interesting that despite these record fuel prices spot-market trucking rates have actually decreased. DAT reports that spot load requests are down significantly (-44.8% from March to April), which has driven spot rates for dry van down by 6.5% (although it should be pointed out that rates are still up 9.2% from a year ago[13]. At the same time, contract rates are falling, but at the expected slower pace – and are still up 16% year-over-year[14]. Consumer demand is still there and spending was back up in March
As mentioned above, consumer spending has continued to grow. Inventory Levels seem to reflect this. While their rate of growth was down slightly (-3.3) to 72.3, they still come in at the fourth-highest rate in the history of the index. Unsurprisingly, Inventory Costs remain high as well, experiencing the same slight drop (-3.3), and reading in at 87.7 – well above the all-time average of 74.4. It will be interesting to observe how inventories are impacted by the shutdowns throughout China. The Chinese PMI dropped to 47.4 – solidly into contraction territory and its lowest level since February 2020. Factory production and export orders are even lower, coming in at 44.4, and 41.9 respectively[15]. Despite allowing some businesses to come back online in “bubble” conditions, Shanghai’s lockdown seems unlikely to end soon. In the last week of April, there were 30,000 active cases, with nearly 2,500 new cases being reported on April 25th. Many carriers have announced they will not be calling on the Port of Shanghai until at least mid-May due to the port productivity being down by 20-30%[16]. Of course, the shutdowns are not just impacting port operations, factory and shipping transportation is down dramatically all the way up the Chines supply chain, with only 20% of Shanghai-based truck fleets currently in operation. Sailings out of China match the TEU volumes seen in the early pandemic. It is not unreasonable to expect a slowdown at US ports sometime in Q2 that is similar to what we saw in 2020, followed by further congestion as importers race to catch up[17]. The difference between 2020 and 2022 is that during the former, US consumers were stuck at home, and last-mile delivery of goods buoyed transportation fleets around the country. It seems unlikely that major lockdowns will reemerge in the U.S. in 2022, meaning that U.S. consumers will continue to spend on services and in-person commerce, limiting the potential lifeline that fleets enjoyed in the aftermath of China’s previous shutdown.
The series of disruptions in China has inspired firms to shift Firms are attempting to mitigate potential issues by nearshoring from places like Mexico. American manufacturers procured some goods (e.g. produce, construction materials) from Mexico at six times greater volume in 2021 relative to 2020. At the same time, RFPs to Chinese suppliers were down 9%[18]. There are limits to this mobility, however, as the infrastructure and economies of scale, as well as upper-tier suppliers and raw materials centered in China, would take years, if not decades, to fully replicate[19].
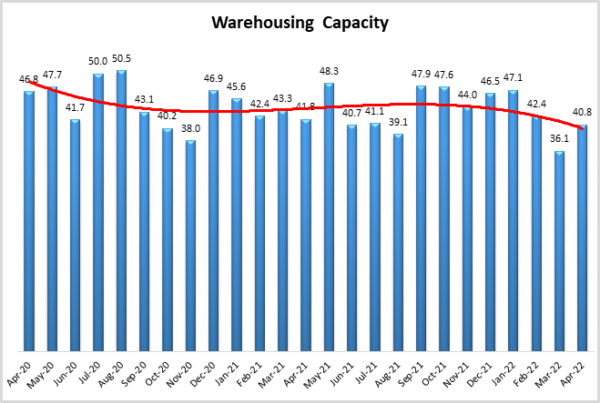
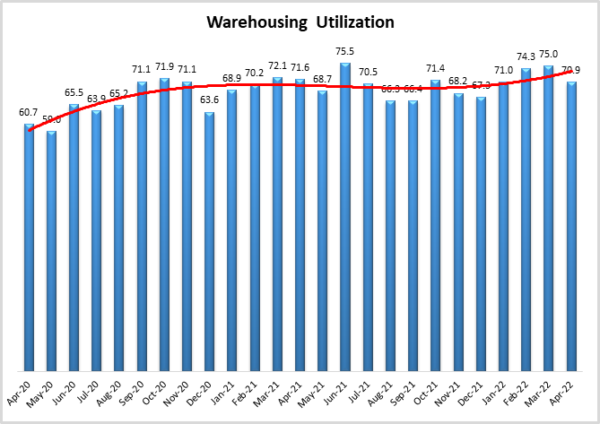
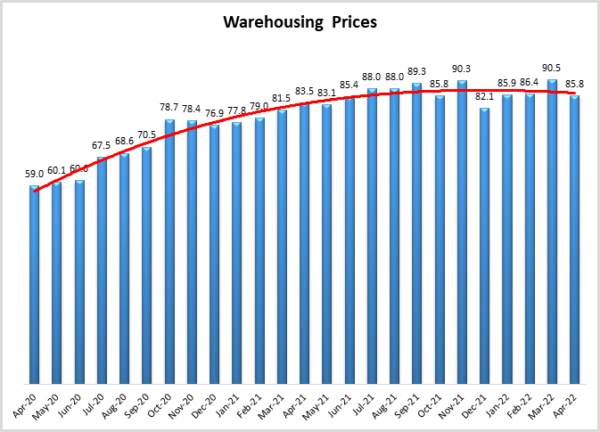
Unlike what we observe with the Transportation metrics, Warehousing Capacity remains in contraction at a slightly slowed (+4.8) rate of 40.8. Even if demand for goods dries up, the inventory does not just vanish. The high levels of inventory discussed above are keeping warehouses full. Warehousing Utilization grew at a rate of 70.9, down slightly (-4.1), but still above the all-time average of 67.4. This is particularly pronounced for downstream firms who report a rate of Warehousing Utilization Growth 10.4 points higher (76.4 to 66.0) than their downstream counterparts. While our metrics suggest that on the whole, demand for warehousing is still outstripping supply, one of the biggest retailers on the planet is trending in the other direction., Amazon doubled the size of its fulfillment network over the two years of the pandemic to keep up with spiking eCommerce demand[20]. Warehousing and transportation jobs skyrocketed over the last 18 months and were major drivers of the employment recovery. However, Amazon seems to be tapping the breaks on this expansion as they signaled in late April that they are “no longer chasing physical or staffing capacity”[21]. This comes on the back of Amazon reporting its slowest rate of sales growth in 20 years[22] as the movement of consumers back towards in-person retail and services, along with the investment so many other firms made into online channels suggests that eCommerce has hit a temporary saturation point. That being said, most firms were unable to add significant warehousing volume over the last 18 months, it will be interesting to observe whether Amazon’s slowdown is specific to them, or if it represents a canary in the coalmine. A slowdown in demand for new warehousing would be a balm to some firms, as Warehousing Prices continue to grow at a torrid pace, down slightly (-4.8) from the all-time high reading registered in March to a still blistering 85.8. While a slowdown in inventory coming in from China could have a deflationary impact on pricing, it is unlikely we will see Warehousing Prices regress to the mean as long as Warehousing Capacity continues to contract.
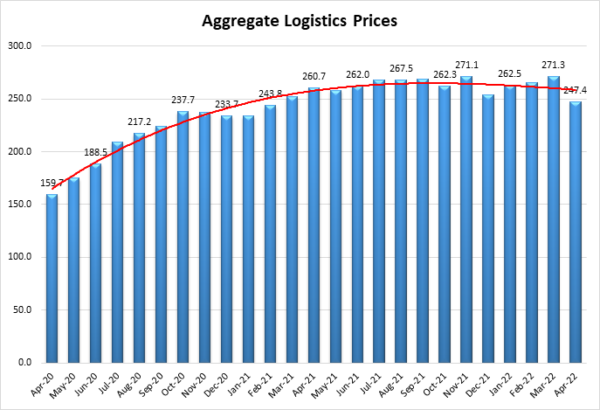
In summation, Inventory and Warehousing metrics remain elevated, but Transportation has clearly slowed. Whether this slowdown will result in recessionary pressures or is simply the market moderating towards more sustainable levels, remains to be seen. The slowing but the still elevated rate of expansion in the logistics industry is encapsulated in the Aggregate Logistics Prices presented below. Aggregate Logistics Prices capture all three price metrics and range from 0-to 300. Aggregate Prices hit their all-time high in March, reading in at 271.3. In April they were down (-23.9) to 247.4. As with many of the metrics in April, this is down slightly from historic, and likely unsustainable highs, but still well above the all-time average for the metric, which in this case is 223.9. The logistics industry is slowing down, but it hasn’t yet slammed to a halt.
The index scores for each of the eight components of the Logistics Managers’ Index, as well as the overall index score, are presented in the table below. Seven of the eight metrics show signs of growth. As predicted in last month’s report, Transportation Capacity is increasing for the first time since May of 2020. Warehousing Capacity continues contracting for the 21st consecutive month. For the moment, supply chains are flush with inventory which is keeping inventory and warehousing metrics high. Whether this shifts in the coming months with the shutdowns in China remain to be seen.
| LOGISTICS AT A GLANCE | |||||
| Index | April 2022 Index | March 2022 Index | Month-Over-Month Change | Projected Direction | Rate of Change |
| LMI® | 69.7 | 76.2 | -6.6 | Growing | Decreasing |
| Inventory Levels | 72.3 | 75.7 | -3.3 | Growing | Decreasing |
| Inventory Costs | 87.7 | 91.0 | -3.3 | Growing | Decreasing |
| Warehousing Capacity | 40.8 | 36.1 | 4.8 | Contracting | Decreasing |
| Warehousing Utilization | 70.9 | 75.0 | -4.1 | Growing | Decreasing |
| Warehousing Prices | 85.8 | 90.5 | -4.8 | Growing | Decreasing |
| Transportation Capacity | 56.9 | 45.7 | 11.2 | Growing | From Contracting |
| Transportation Utilization | 64.3 | 69.7 | -5.5 | Growing | Decreasing |
| Transportation Prices | 73.9 | 89.7 | -15.8 | Growing | Decreasing |
This month, both upstream (blue bars) and downstream (orange bars) firms reported considerable rates of continued growth in the utilization of logistics services. Downstream firms reported a marginally higher level of Transportation Utilization, a significantly higher rate of Warehousing Utilization, but a marginally lower rate of Warehousing Price growth. Upstream firms saw their first growth in Transportation Capacity in March, Downstream firms now join them in April.
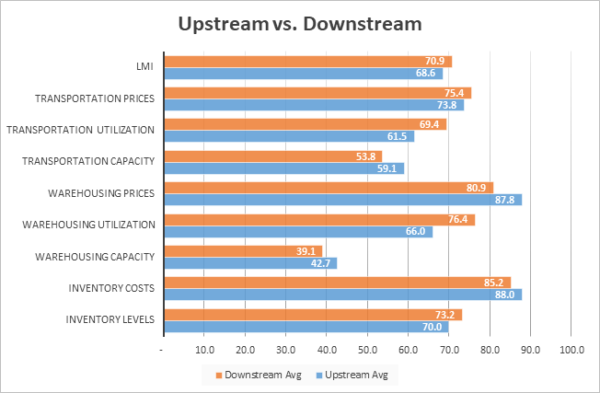
It is possible that the high levels of inventories currently held by retailers are causing them to utilize every inch of warehousing and transportation space they can find. Prices may be higher on the upstream side because there is no longer room downstream to transfer goods, and so stockpiles are building up – stockpiles that are being held in increasingly expensive (e.g. temporarily leased) space.
| Inv. Lev. | Inv. Costs | WH Cap. | WH Util. | WH Price | Trans Cap | Trans Util. | Trans Price | LMI | |
| Upstream | 70.0 | 88.0 | 42.7 | 66.0 | 87.8 | 59.1 | 61.5 | 73.8 | 68.6 |
| Downstream | 73.2 | 85.2 | 39.1 | 76.4 | 80.9 | 53.8 | 69.4 | 75.4 | 70.9 |
| Delta | 3.2 | 2.8 | 3.6 | 10.4 | 6.9 | 5.3 | 7.9 | 1.7 | 2.3 |
| Significant? | No | No | No | Yes | Marginal | No | Marginal | No | No |
Respondents were asked to predict movement in the overall LMI and individual metrics 12 months from now. Their predictions for future ratings are presented below. Respondents predict that Inventory Levels and Costs will continue to rise over the next year, although at a less bullish rate than before as they likely anticipate a shortage of goods stemming from the Chinese lockdowns. Due to the increased levels of anticipated inventories, respondents do not predict any growth in Warehousing Capacity, leading to a continuation of the Warehousing Utilization and Price growth we have observed over the last two years. We do however observe a significant shift across our transportation metrics. Respondents had been predicting increased Transportation Capacity would come for the last six months. However, they are more optimistic about it now, as they likely anticipate demand will come down from the historic highs over the last couple of years. Accordingly, respondents also anticipate much slower rates of growth in Transportation prices in Utilization. It should be pointed out however that they are still predicting some growth – perhaps banking on continuing strength in the consumer demand sector. It will be interesting to observe how these movements shake out over the next 12 months.
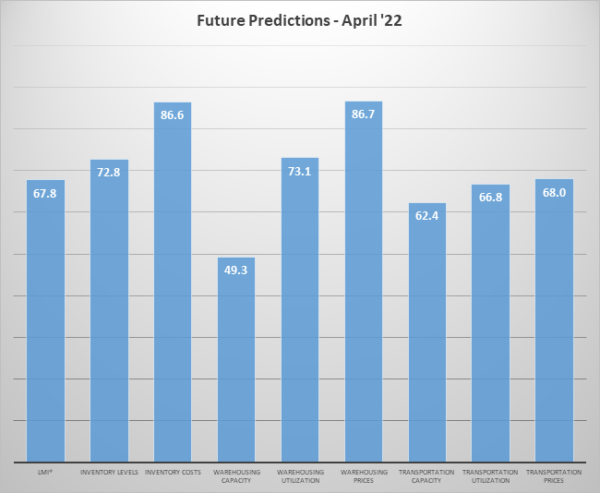
The exact nature of the future predictions varies by supply chain position. This month we see that most clearly in the predictions for future Inventory Costs, Warehousing Prices, and Transportation Utilization.
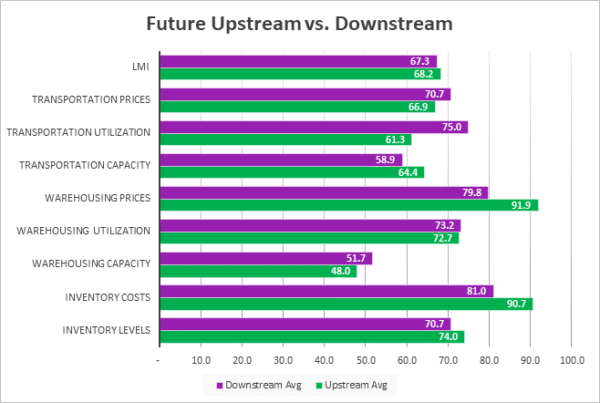 In April 2022 we detected significant differences between Upstream and Downstream predictions for three of the eight components of the LMI. Downstream firms anticipate higher Inventory Costs over the next 12 months as they work through the current glut, deal with potential Chinese shortages and subsequent congestion, and are forced to move it using ever more expansive transportation methods – the latter of which may explain their significantly higher expectations for Transportation Utilization. Unsurprisingly, they anticipate that the higher costs of inventory will transfer over to Warehousing Price, predicting growth above 90.0 for that metric as well.
| Futures | Inv. Lev. | Inv. Costs | WH Cap. | WH Util. | WH Price | Trans Cap. | Trans Util. | Trans Price | LMI |
| Upstream | 74.0 | 90.7 | 48.0 | 72.7 | 91.9 | 64.4 | 61.3 | 66.9 | 68.2 |
| Downstream | 70.7 | 81.0 | 51.7 | 73.2 | 79.8 | 58.9 | 75.0 | 70.7 | 67.3 |
| Delta | 3.3 | 9.6 | 3.7 | 0.5 | 12.1 | 5.4 | 13.8 | 3.8 | 0.9 |
| Significant? | No | Yes | No | No | Yes | No | Yes | No | No |
Historic Logistics Managers’ Index Scores
This period along with prior readings from the last two years of the LMI is presented table below. The values have been updated to reflect the method for calculating the overall LMI:
| Month | LMI | Average for last 3 readings – 73.7
All-time Average – 65.3 High – 76.5 Low – 51.3 Std. Dev – 7.23
|
| Apr ‘22 | 69.7 | |
| Mar ‘22 | 76.2 | |
| Feb ‘22 | 75.2 | |
| Jan ‘22 | 71.9 | |
| Dec ‘21 | 70.1 | |
| Nov ‘21 | 73.4 | |
| Oct ‘21 | 72.6 | |
| Sep ‘21 | 72.2 | |
| Aug ‘21 | 73.8 | |
| July ‘21 | 74.5 | |
| June ‘21 | 75.0 | |
| May ‘21 | 71.3 | |
| Apr ‘21 | 74.5 | |
| Mar ‘21 | 72.2 | |
| Feb ‘21 | 71.4 | |
| Jan ‘21 | 67.2 | |
| Dec ‘20 | 66.7 | |
| Nov ‘20 | 70.8 | |
| Oct ‘20 | 71.6 | |
| Sep ‘20 | 70.5 | |
| Aug ‘20 | 66.0 | |
| July ‘20 | 63.0 | |
| June ‘20 | 61.7 | |
| May ‘20 | 54.5 | |
| Apr ‘20 | 51.3 |
LMI®
The winds may be changing as the overall LMI read in at 69.7 in April. While this still represents a significant rate of growth and exceeds the all-time average of 65.3, it is down significantly (-6.5) from March’s all-time high of 76.2. This reading also marks the first time since January 2021 that the overall index has come in lower than 70.0 – ending the streak of consecutive readings over 70 at 14. This dip is largely due to changes in the transportation market, which has softened significantly given decreased consumer demand and high diesel prices encouraging more efficient shipping.
Despite the slowdown, respondents are still bullish on expansion, predicting a future growth rate of 67.8 over the next 12 months, down (-2.5) from March’s future prediction of 70.2. The U.S. economy contracted in Q1; it will be interesting to observe how respondent predictions change if this downward movement continues.
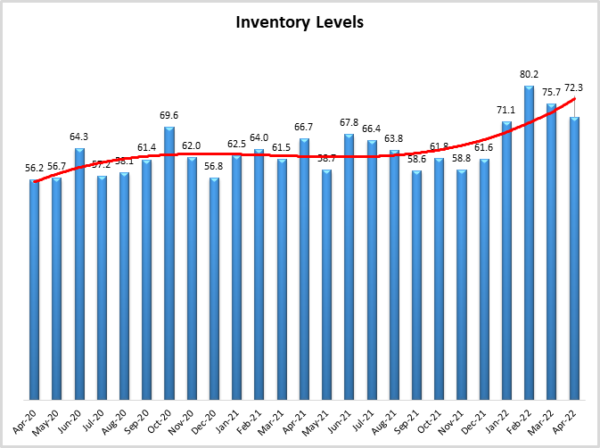
Inventory Levels
The Inventory Level value is 72.3, down slightly (-3.4) from March’s reading of 75.7. Even with the dip, this is the fourth-highest value ever for this index, outstripped by March and the all-time high of 80.2 we saw in February. There have now been four consecutive months above 70.0. There have only been two previous readings above 70, and the last was in April of 2018. The current value is 5.6 higher than the same time last year, and 16.1 points higher than two years ago when the ripple effects of the initial Chinese slowdowns were being felt most keenly. The current reading is above the all-time average value for this metric of 62.1.
When asked to predict what conditions will be like 12 months from now, the average value is 72.8, up from last month’s value (70.1). Upstream respondents are expecting higher increases in inventory than downstream (74.0 vs 70.7). The average is almost the same as the current inventory index value of 72.3, meaning expected inventory growth rates over the next year are very close to the current rate of change.
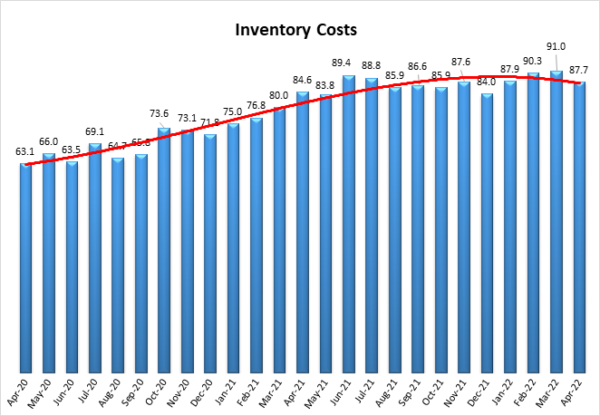
Inventory Costs
The current Inventory Costs index value of 87.7 is down slightly (-3.3) from the all-time record for the index of 91.0 which was set last month (and up 3.3 points from April 2021 and up 24.6 from April 2020). Given the near-record high Inventory Levels index value, it is not surprising that Inventory Costs are also close to their recent record. These continued high levels indicate strong continued growth in inventory costs, above the long-term average of 74.4. Inventory cost values have never fallen below 50, over the life of the index. This month, upstream respondents reported a slightly higher average (88.0 vs 85.2). Both segments of the supply chain are reporting very similar results. Last month, upstream respondents reported slightly higher cost growth (91.2 vs 90.9).
When asked to predict what conditions will be like 12 months from now, the average value is 86.6, very consistent (+0.1) from March’s future prediction of 86.5. In a continuation of March, Upstream respondents are more bullish on future cost growth, coming in 9.7 points higher than downstream (90.7 vs 81.0) than their downstream counterparts.
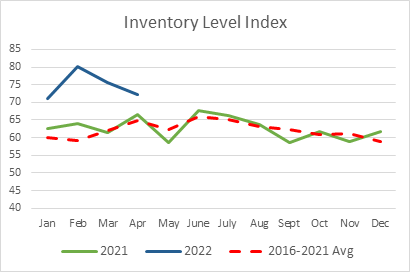
Additional Inventory Analysis
To drive home how unusual inventory has been in 2022, we provide a few additional graphs. The graph below shows lines with the Inventory Level Index values for 2021 and 2022, by month, as well as a dashed line showing the average value from the previous years. It can be clearly seen that the values from the past four months are significantly above the average values from this time of year in previous years. Also, the 2020 Index values were right in line with the long-term averages, generally speaking
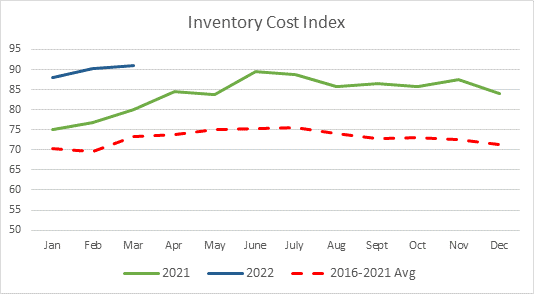
We present a similar graph for Inventory Costs, plotting the index for 2021 and 2022, along with the average over 2016-2021. We can see that the inventory cost index was much higher than the average value for all of 2021. The values for 2022 are above the average values, and above 2021, but not by very much.
Warehousing Capacity
The reading for April 2022’s Warehousing Capacity comes in at 40.8, reflecting a 4.7-point upward shift from March. This reading is also quite close to the reading from April 2021 of 39.1, though is down 6 points from the reading two years ago (46.8). This is the 20th consecutive, and 22nd out of 24 months that available Warehousing Capacity has contracted. Storage space has been at a premium since the outbreak of COVID-19 and the glut of inventory that firms are currently holding has only exacerbated the issue. It will be interesting to see how China’s “zero COVID” eventually impacts inventories. Sailings from China in April 2022 were similar to those in early 2020. It is likely that U.S. firms will see the ripple effects on imports at some point later in Q2. It is likely of course that there will be a subsequent rebound period, in which another deluge of goods comes in and demand warehousing capacity increases, placing a new wave of pressure on this space. The respite, though only mildly attenuated this month, could be necessary for increased capacity to come online to prepare for this potentially increased demand.
Looking forward to the next 12 months, respondents remain fairly neutral on the prospect of meaningful change to capacity. The predicted Warehousing Capacity index is 49.3 for April, drifting back just slightly into contraction and down (-4.2) from March’s future prediction of 53.5. Respondents clearly expect to continue having issues securing enough warehouse space to meet demand.
Warehousing Utilization
The Warehousing Utilization reading came in at 70.9 for April 2022, this reflects a 4.1-point decline from the month prior and a marginal .7-point decrease from the reading one year prior, though it is up nearly 10 points from April of 2020. Though the reading indicates that Warehousing Utilization is continuing to increase, there are two points that are noteworthy: the first is that when comparing the reading from April 2020, which was ostensibly the beginning of the COVID eCommerce boom, the reading not (and one year prior) reflect a 10-point shift upward. This suggests that the demand for warehousing has increased and (likely) that consumers have shifted behavioral patterns toward eCommerce in a meaningful and potentially permanent way. The second point to note is that the slight decrease in the utilization is in line with the capacity reading above (and as will be shown below, the pricing reading as well). This will need to be monitored over the next several months to see if this pattern continues, and the unrelenting pressure in the warehousing space will be assuaged.
Looking forward to the next 12 months, the predicted Warehousing Utilization index is 73.1, up slightly (+1.6) from March’s future prediction of 71.5. Respondents continue to expect to utilize increasingly greater amounts of available warehouse space throughout the year as supply struggles to keep up with demand.
Warehousing Prices
Warehousing prices registered at 85.8 for the month of April, reflecting a 5.3-point increase from the March reading, a 2.3-point increase from this time a year ago, and a staggering 26-points up from April of 2020. The slowdowns in China have not yet impacted the volume of TEUs coming into the U.S. and many firms – particularly Downstream retailers – are still dealing with the excess inventory caused by the backlogs of 2021. The next several months will be critical to watch, as the geopolitical situation affecting global supply chains (i.e. Ukraine, zero COVID in China, etc.) will certainly have an effect on pricing; the direction of which remains to be seen. If the volume of shipments from China increases considerably in the coming months, this may put pressure on demand for warehousing, and increase the rate at which the utilization is growing in addition to its prices (of other readings of the LMI, in addition to warehousing as well). Time will tell whether or not these three readings reflect a step-change or a blip in the readings.
Future predictions suggest that respondents are expecting prices to continue to grow at a rate of 86.7, down slightly (-0.7) from March’s future prediction of 87.4 but still representative of a significant upward movement in price. Respondents are not optimistic about added Warehousing Capacity this year, and it is unsurprising that they also expect to be paying higher prices through the rest of 2022.
Transportation Capacity
The Transportation Capacity Index registered in at 56.9 in April 2022. This constitutes a huge jump of 11.2 percentage points from the March reading of 45.7 and moves the Transportation Capacity Index over the critical 50.0 thresholds, into expansion territory. This is the first month with an expansion since May 2020. The index is even higher, indicating 59.1 for Upstream firms, while the Downstream average is only 53.8. The trendline now takes a marked U-shape, as capacity increases in April 2022 begin to resemble growth rates during the early stages of lockdown in April 2020.
The future Transportation Capacity Index also jumped higher, indicating 62.4 for the next year. This is significantly (+11.5) from March’s future prediction. Upstream firms also have a higher future expectation, with an average of 64.4, versus 58.9 for Downstream firms. This might suggest that we will see a situation similar to 2018-19 when consumer retail demand buoys the freight market in the face of slower industrial demand.
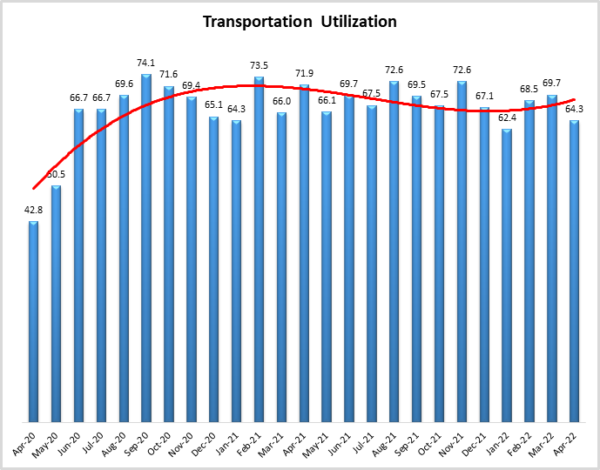
Transportation Utilization
The Transportation Utilization Index registered in at 64.3 in April 2022. This number denotes a decrease of 5.4 points from the March reading of 69.7. Once again we see a difference depending on supply chain position as the Downstream Transportation Utilization Index reads in at 69.4, and the Upstream Index is at 61.5. Despite the drop, the Transportation Utilization Index remains well above 50.0, still indicating continued expansion.
The future Transportation Utilization Index decreased from the previous level, but still indicates expectations of expansion, at a 66.8 level for the next 12 months – down (-5.1) from March’s future reading of 71.9. The expectations of increased transportation utilization are much stronger for downstream firms, where the future index registers 75.0, while the upstream transportation utilization index is 61.3. Hence, despite a drop in utilization index, congestion is still observed, especially upstream.
Transportation Prices
The Transportation Prices Index registered in at 73.9 in April 2022. This corresponds to a drop of 15.8 points from the March of 89.7. This is the second-largest drop in Transportation Prices in the history of the index. Only the 27.9-point decrease in April 2020 – the month the U.S. shut down due to COVID – was greater. The 73.9 level registered this month is the lowest level since July 2020. While the index remains above 50, indicating that prices are still increasing, the intensity is much lower than at any time in the past 1.5 years. Further, the decrease in price pressure is across the supply chains, with the upstream price index at 73.8 and the downstream price index at 75.4
The future index for Transportation Prices indicates a value of 68.0. As such, the expectations of future Transportation Price increases dropped 12.6 points from the March prediction of 80.6. The price increase expectations are slightly higher for upstream firms (index is at 66.9) than for downstream firms (index is at 70.7).
![]()
About This Report
The data presented herein are obtained from a survey of logistics supply executives based on information they have collected within their respective organizations. LMI® makes no representation, other than that stated within this release, regarding the individual company data collection procedures. The data should be compared to all other economic data sources when used in decision-making.
Data and Method of Presentation
Data for the Logistics Manager’s Index is collected in a monthly survey of leading logistics professionals. The respondents are CSCMP members working at the director level or above. Upper-level managers are preferable as they are more likely to have macro-level information on trends in Inventory, Warehousing and Transportation trends within their firm. Data is also collected from subscribers to both DC Velocity and Supply Chain Quarterly as well. Respondents hail from firms working on all six continents, with the majority of them working at firms with annual revenues over a billion dollars. The industries represented in this respondent pool include, but are not limited to Apparel, Automotive, Consumer Goods, Electronics, Food & Drug, Home Furnishings, Logistics, Shipping & Transportation, and Warehousing.
Respondents are asked to identify the monthly change across each of the eight metrics collected in this survey (Inventory Levels, Inventory Costs, Warehousing Capacity, Warehousing Utilization, Warehousing Prices, Transportation Capacity, Transportation Utilization, and Transportation Prices). In addition, they also forecast future trends for each metric ranging over the next 12 months. The raw data is then analyzed using a diffusion index. Diffusion Indexes measure how widely something is diffused, or spread across a group. The Bureau of Labor Statistics has been using a diffusion index for the Current Employment Statics program since 1974, and the Institute for Supply Management (ISM) has been using a diffusion index to compute the Purchasing Managers Index since 1948. The ISM Index of New Orders is considered a Leading Economic Indicator.
We compute the Diffusion Index as follows:
PD = Percentage of respondents saying the category is Declining,
PU = Percentage of respondents saying the category is Unchanged,
PI = Percentage of respondents saying the category is Increasing,
Diffusion Index = 0.0 * PD + 0.5 * PU + 1.0 * PI
For example, if 25 say the category is declining, 38 say it is unchanged, and 37 say it is increasing, we would calculate an index value of 0*0.25 + 0.5*0.38 + 1.0*0.37 = 0 + 0.19 + 0.37 = 0.56, and the index is increasing overall. An index value above 0.5 indicates the category is increasing, a value below 0.5 indicates it is decreasing, and a value of 0.5 means the category is unchanged. When a full year’s worth of data has been collected, adjustments will be made for seasonal factors as well.
Logistics Managers Index
Requests for permission to reproduce or distribute Logistics Managers Index Content can be made by contacting in writing at: Dale S. Rogers, WP Carey School of Business, Tempe, Arizona 85287, or by emailing [email protected] Subject: Content Request.
The authors of the Logistics Managers Index shall not have any liability, duty, or obligation for or relating to the Logistics Managers Index Content or other information contained herein, any errors, inaccuracies, omissions or delays in providing any Logistics Managers Index Content, or for any actions taken in reliance thereon. In no event shall the authors of the Logistics Managers Index be liable for any special, incidental, or consequential damages, arising out of the use of the Logistics Managers Index. Logistics Managers Index, and LMI® are registered trademarks.
About The Logistics Manager’s Index®
The Logistics Manager’s Index (LMI) is a joint project between researchers from Arizona State University, Colorado State University, University of Nevada, Reno, Rochester Institute of Technology, and Rutgers University, supported by CSCMP. It is authored by Zac Rogers Ph.D., Steven Carnovale Ph.D., Shen Yeniyurt Ph.D., Ron Lembke Ph.D., and Dale Rogers Ph.D.
[1] Casselman, B. (2022, April 28). U.S. Economy Shrank in First Quarter, but Underlying Measures Were Solid. The New York Times. https://www.nytimes.com/2022/04/28/business/economy/us-gdp-q1-2022.html
[2] Banerji, G., & Ostroff, C. (2022, April 29). Tech Rout Drags Nasdaq to Worst Month Since 2008. Wall Street Journal. https://www.wsj.com/articles/global-stocks-markets-dow-update-04-29-2022-11651217787
[3] Smith, T. J. (2022, April 26). Hot Job Market, an Economic Relief, Is a Wall Street Worry. The New York Times. https://www.nytimes.com/2022/04/26/business/economy/jobs-wall-street.html
[4] Goldman Sachs. (2022, April 19). Will the US go into recession? Goldman Sachs. https://www.goldmansachs.com/insights/pages/will-the-us-go-into-recession.html
[5] Mulvey, T. (2022, April 15). Rejection rates continue rapid descent, pulling rates down with them. FreightWaves. https://www.freightwaves.com/news/rejection-rates-continue-rapid-descent-pulling-rates-down-with-them
[6] Cannon, J. (2022b, April 28). Trailer orders reach 15 months high. Commercial Carrier Journal. https://www.ccjdigital.com/economic-trends/article/15291342/trailer-orders-reach-15-month-high
[7] Cannon, J. (2022a, April 27). Freight market shows signs of strength despite headwinds. Commercial Carrier Journal. https://www.ccjdigital.com/economic-trends/article/15291354/freight-market-shows-signs-of-strength-despite-headwinds
[8] Dalheim, B. (2022, April 27). Trucking demand falls to 22-month low. Furniture Today. https://www.furnituretoday.com/logistics/trucking-demand-falls-to-22-month-low/
[9] Casselman, B. (2022, April 28). U.S. Economy Shrank in First Quarter, but Underlying Measures Were Solid. The New York Times. https://www.nytimes.com/2022/04/28/business/economy/us-gdp-q1-2022.html
[10] Thomas, P. (2022, April 29). America’s Snarled Railroads Are the Latest Hit to Farmers. WSJ. https://www.wsj.com/articles/train-delays-bog-down-u-s-farm-sector-11651224781
[11] EIA. (2022, April 25). Weekly U.S. No 2 Diesel Retail Prices (Dollars per Gallon). U.S. Energy Information Administration – Gasoline and Diesel Fuel Update. https://www.eia.gov/dnav/pet/hist/LeafHandler.ashx?n=PET&s=EMD_EPD2D_PTE_NUS_DPG&f=W
[12] Page, P. (2022, April 30). Logistics Report: Amazon’s Pause in Profits; Redirecting Gas Flows; Drilling Supply Chain Woes. The Wall Street Journal. https://createsend.com/t/d-F6A8B7E6FEA034572540EF23F30FEDED?mod=hp_minor_pos15
[13] DAT. (2022, April 30). Trucking Industry Trends: Apr 18 – Apr 24, 2022. DAT. https://www.dat.com/trendlines
[14] Rudolph, M. (2022, April 29). Shippers are back in the driver’s seat on rates. FreightWaves. https://www.freightwaves.com/news/shippers-are-back-in-the-drivers-seat-on-rates
[15] Cheng, J. (2022, April 30). China’s Manufacturing Activity Pummeled by Covid Restrictions. Wall Street Journal. https://www.wsj.com/articles/chinas-manufacturing-activity-contracted-further-in-april-11651285563
[16] Kulisch, E. (2022, April 26). Crisis or hiccup? Assessing the logistics impact of China lockdowns. FreightWaves. https://www.freightwaves.com/news/crisis-or-hiccup-assessing-the-logistics-impact-of-china-lockdowns
[17] Fuller, C. (2022, April 25). Xi’s lockdowns will pull the rug out from under US truckers this summer. FreightWaves. https://www.freightwaves.com/news/xis-lockdowns-will-pull-the-rug-out-from-under-us-truckers-this-summer
[18] O’Neal, L. (2022a, April 1). Mexican Factories Gain in Supply-Chain Revamps. Wall Street Journal. https://www.wsj.com/articles/mexican-factories-gain-in-supply-chain-revamps-11648831914
[19] O’Neal, L. (2022b, April 18). U.S. Companies Face Hurdles in Moving Production Closer to Home. Wall Street Journal. https://www.wsj.com/articles/u-s-companies-face-hurdles-in-moving-production-closer-to-home-11650301164
[20] Solomon, M. (2022b, April 28). Amazon posts big net loss, drop in operating income. FreightWaves. https://www.freightwaves.com/news/amazon-posts-big-net-loss-drop-in-operating-income
[21] Iyengar, R. (2022, April 29). Amazon stock plunges as growth slows. CNN. https://www.cnn.com/2022/04/28/tech/amazon-earnings-loss/index.html
[22] Herrera, S. (2022, April 29). Amazon’s Flagship Online-Shopping Business Stalls After Decades of Growth. WSJ. https://www.wsj.com/articles/amazons-flagship-online-shopping-business-stalls-after-decades-of-dominance-11651232316