LMI® at 51.3%
Growth is INCREASING AT AN INCREASING RATE for: Inventory Levels, and Inventory Costs.
Growth is INCREASING AT A DECREASING RATE for: Warehouse Utilization and Warehousing Prices
Warehousing Capacity, Transportation Utilization, and Transportation Prices are CONTRACTING
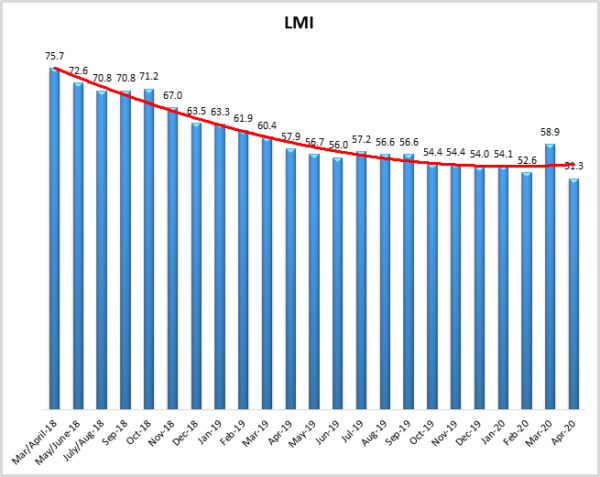
As hypothesized in last month’s report, the spike in logistics activity recorded in March proved to be temporary, with the overall Logistics Managers’ Index (LMI) falling (-7.6) to an all-time low of 51.3. April’s numbers, combined with the decline we observed during the last week of March[1] suggests that the temporary surge in activity was due to the initial spike in demand for products such as cleaning wipes and toilet paper, with a subsequent decline as multiple sectors of the economy were taken offline. April’s all-time low index reading of 51.3 comes exactly two years after its all-time high reading of 75.7. This is a return to the steady decline we have observed over the last two years after last month’s temporary spike.
Researchers at Arizona State University, Colorado State University, Rochester Institute of Technology, Rutgers University, and the University of Nevada, Reno, and in conjunction with the Council of Supply Chain Management Professionals (CSCMP) issued this report today.
Results Overview
The LMI score is a combination of eight unique components that make up the logistics industry, including inventory levels and costs, warehousing capacity, utilization, and prices, and transportation capacity, utilization, and prices. The LMI is calculated using a diffusion index, in which any reading above 50 percent indicates that logistics is expanding; a reading below 50 percent is indicative of a shrinking logistics industry. The latest results of the LMI summarize the responses of supply chain professionals collected in April 2019. This month’s LMI is a tale of two sectors, Transportation and Warehousing. In a return to the trends of the last two years, the overall LMI score is at an all-time low of 51.3, down (-7.6) from the temporary spike we observed in March. The twelve lowest readings in the history of the LMI have come in the last 13 months, with last month’s COVID-related spike the only exception. Five of the eight metrics are currently demonstrating growth. Warehouse Capacity, Transportation Utilization, and Transportation Prices are currently contracting. This is interesting as this is the first time that Transportation Prices and Warehouse Capacity have both been in a state of contraction, over the 3.5 years of this index these measures have been negatively correlated When demand for logistics services is high Warehouse Capacity decreases, and Transportation Prices increase. That they are moving in the same direction suggests that while demand is down for Transportation, inventories remain quite high and the demand for Warehousing is up.
This is the 43rd consecutive month in which we have observed a score over 50.0, and growth in the LMI. With the global economy currently in free-fall, it may be surprising to see this streak continue. The primary reason the LMI continues to grow (albeit at an anemic rate of 51.3) is the strong Warehousing sector. Warehousing Prices are down (-5.5), but remain in a state of growth at 59.0. We see the opposite situation with Warehousing Capacity, which is up slightly (+3.0) but still contracting at 46.8. Demand for new products is frozen across multiple industries including electronics, automobiles, furniture, and apparel[2]. This has led to a buildup of inventory so severe that a Wall Street Journal headline declares large clothing retailers will be forced to have “Black Friday in July” to clear the backlog[3]. Like water in a sink whose drain has been plugged, this inventory has nowhere to go, and must, therefore, be warehoused. This is reflected in the increasing (+4.0) rate of growth for Warehousing Utilization. It is interesting to note that while Warehousing is up, the rates of growth are in decline from March. With little-to-no consumer demand, firms will likely attempt to unload inventory and decrease their storage footprint. If firms can achieve this, and Transportation remains slow, it is possible that we will read the first-ever contraction in the LMI in the near future.
The record drop in Transportation Prices (-27.9) to 37.7 comes after last month’s record jump (+16.5 from February to March). This, combined with a similar drop in Transportation Utilization (-10.3), is behind the record jump in available Transportation Capacity (+15.2). Outside of the grocery industry, firms aren’t moving much inventory, and freight volumes have consistently been as low as they would be for national holidays like Labor Day or the Fourth of July[4]. While the freight market shows some signs of stabilization, we are clearly a long way from the high-flying days of two years ago, when Transportation Prices were at a record high of 95.8, 58.1 points higher than they are today.
Reflecting on the current state of stagnated growth, Inventory Levels continue to grow at 56.2, nearly the same (+0.8) rate as in March. The rate of change for Inventory Costs is down slightly (-3.4), but still growing at the robust pace of 63.1. Last month’s surge in demand, combined with the effective closure of many industries, has left many firms over-inventoried, and scrambling to dispose of it. This will likely lead to an opportunity for firms such as value retailers or salvage dealers and may put additional stress on landfills and manufacturers with liberal returns policies.
The index scores for each of the eight components of the Logistics Managers’ Index, as well as the overall index score, are presented in the table above. Five of the eight metrics show signs of growth, but many of them are moving at low or considerably decreased rates. The overall LMI® index score is at its lowest point in the history of the index. Our reading indicates a continued trend of slowing yet steady growth in the logistics industry.
| LOGISTICS AT A GLANCE | |||||
| Index | April 2020 Index | March 2020 Index | Month-Over-Month Change | Projected Direction | Rate of Change |
| LMI® | 51.31 | 58.87 | -7.6 | Growing | Decreasing |
| Inventory Levels | 56.21 | 55.39 | +0.8 | Contracting | Increasing |
| Inventory Costs | 63.10 | 66.49 | -3.4 | Growing | Decreasing |
| Warehousing Capacity | 46.77 | 43.75 | +3.0 | Contracting | From Growing |
| Warehousing Utilization | 60.71 | 56.73 | +4.0 | Growing | Increasing |
| Warehousing Prices | 58.97 | 64.50 | -5.5 | Growing | Decreasing |
| Transportation Capacity | 62.19 | 46.98 | 15.2 | Contracting | From Contracting |
| Transportation Utilization | 42.77 | 53.04 | -10.3 | Contracting | From Growing |
| Transportation Prices | 37.66 | 65.52 | -27.9 | Contracting | From Growing |
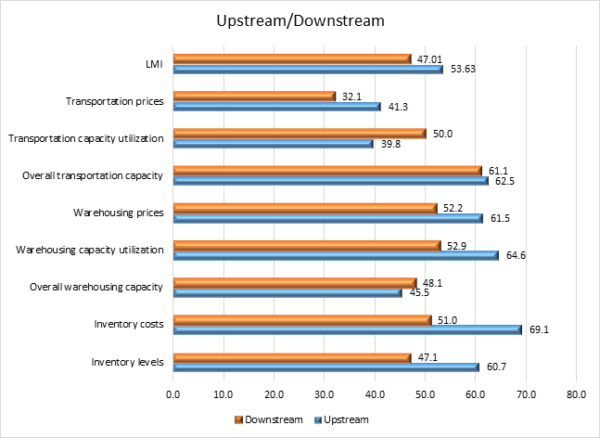
However, as we see in the comparison of upstream and downstream respondents, the effects of COVID-19 do not appear to be consistent in all stages of the supply chain. Respondents classified as upstream are those that do not interact directly with consumers. These tend to be warehousing firms, carriers, and manufacturers. Downstream respondents are firms that do interact with consumers, such as retailers.
| LMI | Inv. Levels | Inv. Costs | W.H. Capacity | W.H. Utilization | W.H Prices | Trans. Capacity | Trans. Utilization | Trans. Prices | |
| Downstream | 47.0 | 47.1 | 51.0 | 48.1 | 52.9 | 52.2 | 61.1 | 50.0 | 32.1 |
| Upstream | 53.6 | 60.7 | 69.1 | 45.5 | 64.6 | 61.5 | 62.5 | 39.8 | 41.3 |
| Difference? | 6.6 | 13.6 | 18.1 | -2.6 | 11.8 | 9.3 | 1.4 | -10.2 | 9.2 |
| Significant? | Not Significant | Significant | Significant | Not Significant | Significant | Significant | Not Significant | Mildly Significant | Mildly Significant |
The graph and table show that Upstream respondents reported significantly higher Inventory Levels, Inventory Costs, Warehouse Utilization, and Warehouse Prices. Suggesting that non-consumer facing firms are more burdened by inventory than their consumer-facing counterparts. This implies that the glut of inventory and subsequent growth in Warehousing metrics is mostly happening upstream, creating more of a burden for manufacturers, 3PL’s, and distributors, than for retailers.
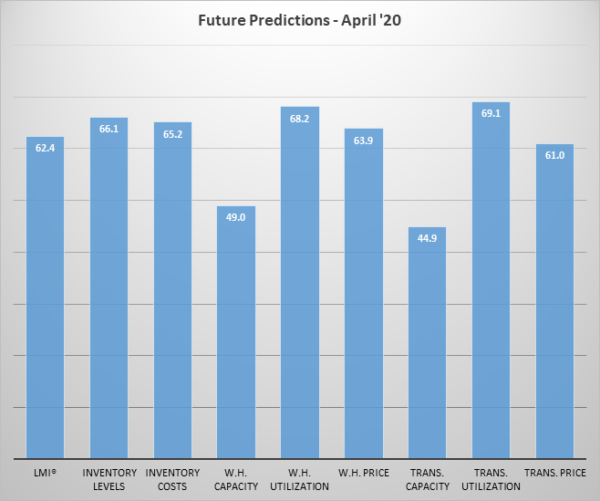
Respondents were asked to predict movement in the overall LMI and individual metrics 12 months from now. Their predictions for future ratings are presented below and, as has become a pattern, seem to be somewhat more optimistic than our current readings. Respondents seem to be predicting better times ahead as far as the logistics industry is concerned. The logistics industry getting back to these levels in the next year is largely a function of how soon the economy comes back online, and whether or not we see a secondary wave of COVID-19 infections in the Fall and Winter.
Historic Logistics Managers’ Index Scores
This period’s along with prior readings from the last two years of the LMI is presented table below. The values have been updated to reflect the method for calculating the overall LMI:
| Month | LMI | Average for previous readings – 61.5
High – 75.7 Low – 51.3 Std. Dev – 6.4
|
| Apr ‘20 | 51.3 | |
| Mar ‘20 | 58.9 | |
| Feb ‘20 | 52.6 | |
| Jan ‘20 | 54.1 | |
| Dec ‘19 | 54.0 | |
| Nov ‘19 | 54.4 | |
| Oct ‘19 | 54.4 | |
| Sep ‘19 | 56.6 | |
| August ‘19 | 56.6 | |
| July ‘19 | 57.2 | |
| June ‘19 | 56.0 | |
| May’19 | 56.7 | |
| April ‘19 | 57.9 | |
| March ‘19 | 60.41 | |
| February ‘19 | 61.95 | |
| January ‘19 | 63.33 | |
| December ‘18 | 63.54 | |
| November ‘18 | 66.98 | |
| October ‘18 | 71.20 | |
| September ‘18 | 70.80 | |
| July/August ‘18 | 70.80 | |
| May/June ‘18 | 72.55 | |
| March/April ‘18 | 75.71 |
LMI®
The overall LMI index is at a new all-time low of 51.3, down (-7.6) from last month’s 58.9. This marks the fourth time in seven months that the overall LMI has hit a new low. As speculated in the previous report, March’s spike in logistics activity appears to have been a temporary aberration from the recent downward trend in the logistics industry, likely spurred on by the rush of activity in the first few weeks of quarantine. There was a sudden demand and the logistics industry responded, but now it seems as though that demand has faded away, and logistics activity is lower now than we have previously recorded.
Respondents predict that over the next year, the LMI will be at 61.0, down slightly (-1.4) fro March’s future prediction of 62.4. To achieve these numbers the global economy would need to once again be functioning normally. The LMI’s ability to achieve this predicted level depends largely on the length and breadth of the current lockdown, and our ability to recover from it.
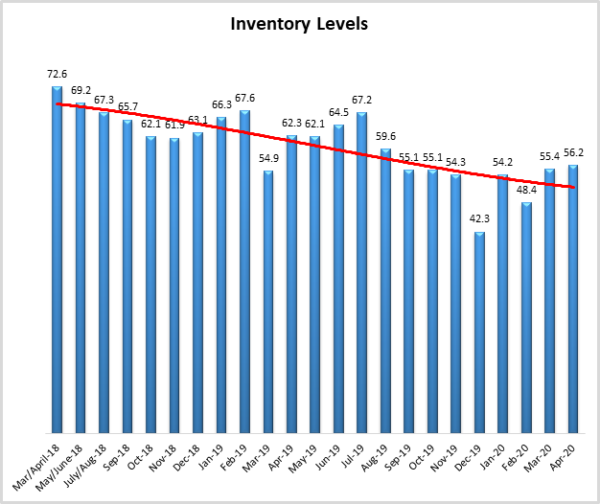
Inventory Levels
The Inventory Level value is 56.2, which is 0.8 points above the value last month of 55.4, 7.8 points above the value two months ago, and 16.4 points below the level two years ago at this time. This means inventories are not increasing as quickly now as they were increasing one or two years ago at this time. As we noted in previous months, the sharp decline the four months ago could have represented the beginning of an extended decline for the index, or, given past volatility, could have reflected fluctuations in the index. There is now more evidence for the latter. Whether this would have occurred naturally or is driven by the glutting of inventory caused by the economic lockdown is unclear.
As discussed above upstream firms reported an inventory level of 60.7 while downstream companies reported a level of 47.1. Some retailers are currently open and running out of many products. Others are not currently open for business, and sitting on piles of inventory.
When asked to predict what will conditions will be like 12 months from now, the average value is 66.1, up (+5.2) from March’s future prediction of 60.9.
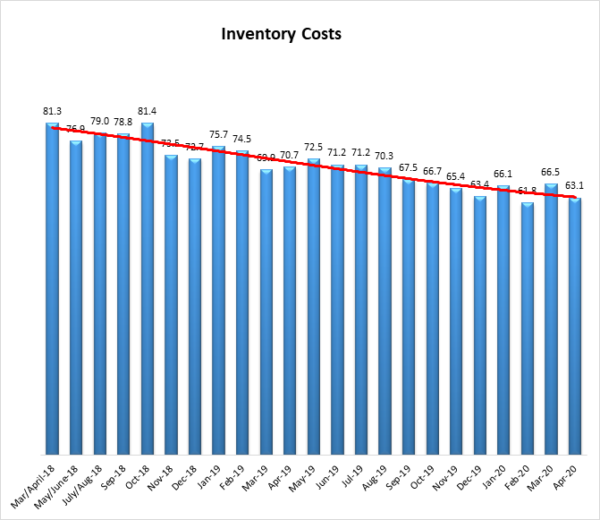
Inventory Costs
As inventory levels continue their slight growth, it is not surprising that inventory costs have continued to increase, although the rate has slowed. The current value is 63.1, down (-3.4) from the previous reading of 66.5, this is also below the 70.7 value last year at this time, and 18.2 points below the 81.3 value of two years ago. In the first year shown in the graph, there was only 1 value below 70, but most recently, there has been a string of eight in a row below that value. If current trends continue, it would not be surprising to see a new lowest value, sometime in the near future.
Looking forward to the next 12 months, the predicted Inventory Costs are 65.2, down significantly (-6.4) from last month’s future prediction of 71.6. This value reflects the expected continued inventory cost growth. Respondents clearly expect inventory costs to continue to be high for the next 12 months.
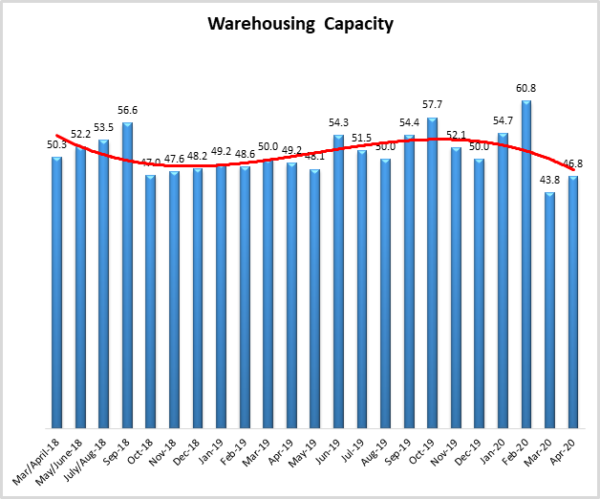
Warehousing Capacity
The Warehousing Capacity Index registered 46.8 percent in April 2020. This represents a mild increase of 3 percentage points from the March 2020 reading of 43.8.8, though it is on par with the April 2019 value of 49.2. Likely, the sharp decline in the capacity of warehousing (from previous highs) is directly related to the supply chain disruption that the SARS-COV-2 (COVID-19) virus had on domestic and global supply chains. The reading indicates that the capacity for warehousing, though slightly less than March 2020, continues to contract. The reading suggests that the demand for goods in some industries (i.e. grocery), along with cratering demand in other industries (i.e. apparel, automotive, etc.) at the consumer level has caused retailers/wholesalers/manufacturers to need significantly more warehousing to maintain service levels; hence the rapid drop in this measure.
Looking forward to the next 12 months, the predicted Warehousing Capacity index is 49.0, up (+7.8) from March’s future prediction of. 41.2.
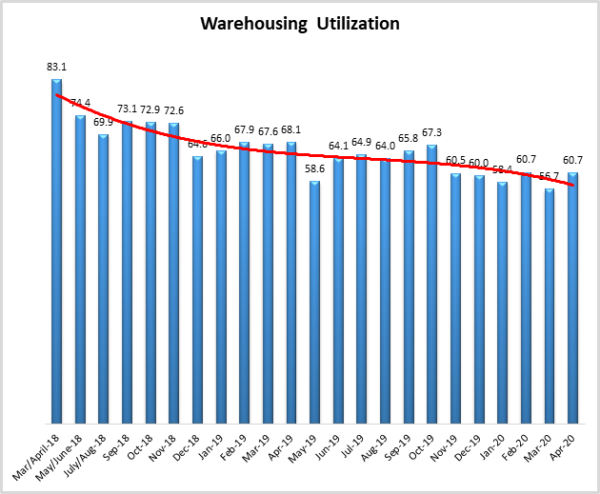
Warehousing Utilization
The Warehousing Utilization Index registered 60.7 percent in April 2020. This represents a slight increase of 4 percentage points from last month and is down by 7.4 points from the April 2019 reading of 68.1. This reading is likely a carryover effect from the massive supply chain disruption caused as a result of the COVID-19 outbreak. As noted above, the capacity is contracting, and as such the rate at which warehousing is being utilized continues to increase.
Looking forward to the next 12 months, the predicted Warehousing Utilization index is 60.7, down (-1.1) from March’s future prediction of 61.8.
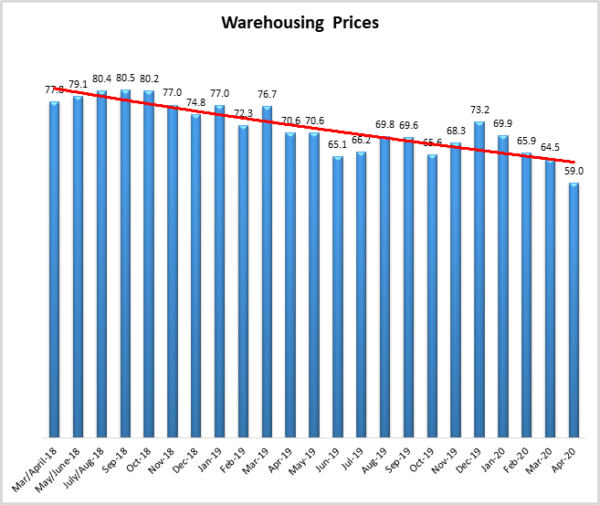
Warehousing Prices
Warehousing Prices Index registered 59.0 percent in April 2020. This reading shows a 5.5 point drop in the rate of increase, though the data indicate that the prices for warehousing are continuing to increase. This reading is also down rather sharply by 10.6 points from one year ago. This also continues the trend of the decreased rate of growth in pricing. Though still increasing, given the decline in the rate of growth from last month, and taken together with the increased utilization and decreasing capacity, it may be that the market is reflecting the price sensitivity in demand and adjusting as necessary; particularly in response to COVID-19’s impact on domestic supply chains.
Looking forward to the next 12 months, the predicted Warehousing Prices index is 63.9, down (-2.8) from March’s future prediction of 66.7.
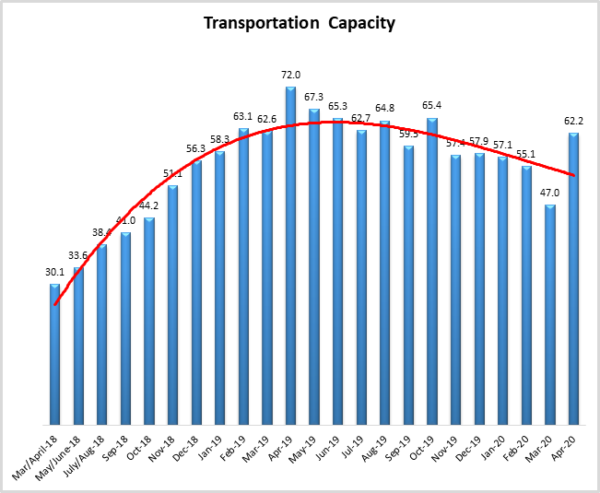
Transportation Capacity
The Transportation Capacity Index registered 62.2 percent in April 2020. This constitutes a large increase of 15.2 percentage points from the March reading of 47.0. Transportation is back to its pattern of growth after contracting last month for the first time since October 2018. This excess capacity is a clear indicator that the demand for product movement is down.
It should be noted the data indicates a score of only 44.9 percent for the next year, projecting expectations of decreasing transportation capacity in the next 12 months.
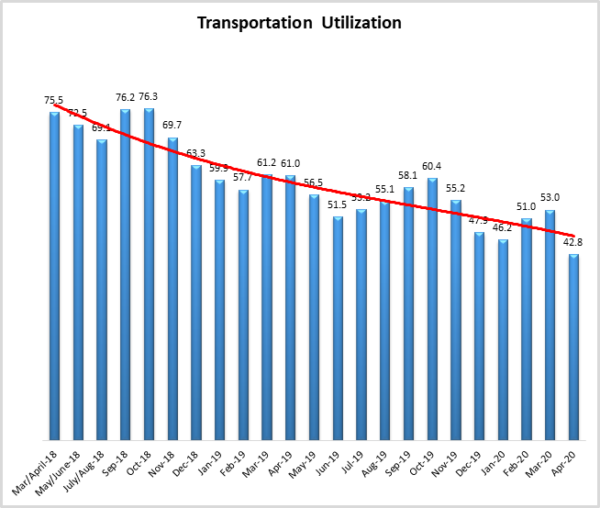
Transportation Utilization
The Transportation Utilization Index registered 42.8 percent in April 2020. This constitutes a large decrease of 10.2 percentage points from the March reading of 53.0. This is the lower level ever recorded for the Transportation Utilization Index and indicates that respondents are using less of the transportation options available to them.
Conversely, the future Transportation Utilization Index indicates a 69.1 percent level for the next 12 months, indicating expectations a significant reverse, and strong growth in the future.
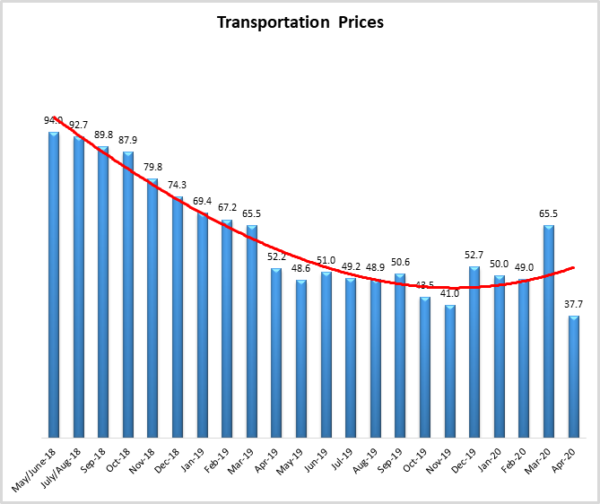
Transportation Prices
The Transportation Prices Index registered 37.7 percent in April 2020. This constitutes the lowest level ever recorded for the Transportation Prices Index and a record drop of 27.8 percent from the March transportation prices reading of 65.5. Transportation Prices have been the most dynamic, as well as the most predictive, metric in the LMI. This record low reading suggests that consumer demand has dried up in April, and will likely be slow to come back to pre-crisis levels.
The future index for transportation prices remains elevated, with a future Transportation Prices Index value of 61.0 indicating expectations of price increases over the next 12 months.
About This Report
The data presented herein are obtained from a survey of logistics supply executives based on information they have collected within their respective organizations. LMI® makes no representation, other than that stated within this release, regarding the individual company data collection procedures. The data should be compared to all other economic data sources when used in decision-making.
Data and Method of Presentation
Data for the Logistics Manager’s Index is collected in a monthly survey of leading logistics professionals. The respondents are CSCMP members working at the director-level or above. Upper-level managers are preferable as they are more likely to have macro-level information on trends in Inventory, Warehousing, and Transportation trends within their firm. Data is also collected from subscribers to both DC Velocity and Supply Chain Quarterly as well. Respondents hail from firms working on all six continents, with the majority of them working at firms with annual revenues over a billion dollars. The industries represented in this respondent pool include, but are not limited to Apparel, Automotive, Consumer Goods, Electronics, Food & Drug, Home Furnishings, Logistics, Shipping & Transportation, and Warehousing.
Respondents are asked to identify the monthly change across each of the eight metrics collected in this survey (Inventory Levels, Inventory Costs, Warehousing Capacity, Warehousing Utilization, Warehousing Prices, Transportation Capacity, Transportation Utilization, and Transportation Prices). In addition, they also forecast future trends for each metric ranging over the next 12 months. The raw data is then analyzed using a diffusion index. Diffusion Indexes measure how widely something is diffused, or spread across a group. The Bureau of Labor Statistics has been using a diffusion index for the Current Employment Statics program since 1974, and the Institute for Supply Management (ISM) has been using a diffusion index to compute the Purchasing Managers Index since 1948. The ISM Index of New Orders is considered a Leading Economic Indicator.
We compute the Diffusion Index as follows:
PD = Percentage of respondents saying the category is Declining,
PU = Percentage of respondents saying the category is Unchanged,
PI = Percentage of respondents saying the category is Increasing,
Diffusion Index = 0.5 * PD + 0.5 * PU + 1.0 * PI
For example, if 25% say the category is declining, 38% say it is unchanged, and 37% say it is increasing, we would calculate an index value of 0*0.25 + 0.5*0.38 + 1.0*0.37 = 0 + 0.19 + 0.37 = 0.56, and the index is increasing overall. For an index value above 0.5 indicates the category is increasing, a value below 0.5 indicates it is decreasing, and a value of 0.5 means the category is unchanged. When a full year’s worth of data has been collected, adjustments will be made for seasonal factors as well.


