- Growth is INCREASING AT AN INCREASING RATE for Inventory Levels, Inventory Costs, Warehousing Prices, Transportation Capacity, Transportation Utilization, and Transportation Prices
- Growth is INCREASING AT A DECREASING RATE for Warehousing Utilization
- Warehousing Capacity and Transportation Capacity are CONTRACTING
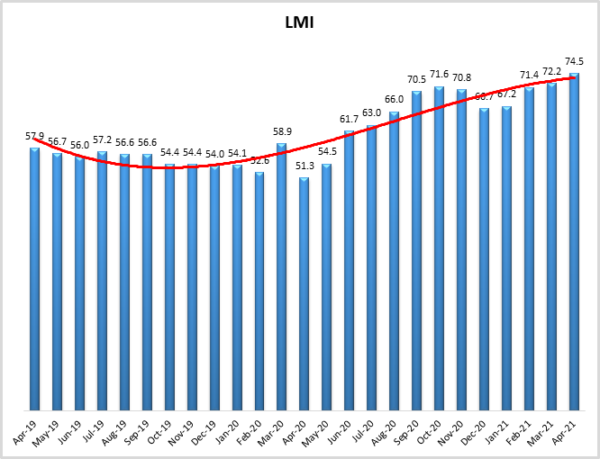
The tightness that has been observed in the logistics industry over the last nine months continued unabated in April 2021. This month’s LMI comes in at 74.5, the second-highest reading in the history of the index. This seems to be largely driven by tight capacity, high prices for transportation and warehousing, as well as record-high levels of growth in Inventory Costs. This is a sharp turn from this time last year, when the April 2020 LMI read in at a record-low 51.3, when prices were low and a high level of slack capacity was available due to the COVID-19 lockdown. The logistics industry and overall economy we observe today are 180 degrees different from last year. April 2020 was the height of the COVID-related lockdown when many news stories were about either rising hospitalization rates or the things people were doing (e.g. learning to bake bread) with all of their extra time. In April 2021 those days seem to be behind us in the U.S., where GDP grew 6.4% in Q1[1], jobless claims have dropped to their lowest level since the pandemic[2], and (buoyed by returns to work and stimulus checks) household income is up 21.1% this Spring[3].
The re-heating of the economy has been interesting as pent-up demand has led to a ramp-up in both the consumption and production of consumer and industrial goods. At the same time, consumers are continuing to rely heavily on methods of shopping they grew accustomed to during lockdowns, such as at-home delivery or pick-up from the store. These channels of consumption tend to require a greater number of trucks and more expansive warehouse networks than more traditional alternatives. Going from the lowest LMI reading on record to the second-highest seems to capture the sensation of whiplash being felt by many in the industry. We observe high prices, including record-high Warehousing Prices and Inventory Costs, tight capacity, and an overall LMI of 74.5, up (+2.3) to the second-highest reading in the history of the index. The combination of increasing demand, and increasingly restricted supply will likely continue to be an issue going forward, as respondents are not optimistic about rapid increases in available capacity.
Researchers at Arizona State University, Colorado State University, Rochester Institute of Technology, Rutgers University, and the University of Nevada, Reno, and in conjunction with the Council of Supply Chain Management Professionals (CSCMP) issued this report today.
Results Overview
The LMI score is a combination of eight unique components that make up the logistics industry, including inventory levels and costs, warehousing capacity, utilization, and prices, and transportation capacity, utilization, and prices. The LMI is calculated using a diffusion index, in which any reading above 50 percent indicates that logistics is expanding; a reading below 50 percent is indicative of a shrinking logistics industry. The latest results of the LMI summarize the responses of supply chain professionals collected in April 2021. As we have seen for most of the last year, April’s LMI displays continued, expansion in the logistics industry. Overall, the LMI is up (+2.3) from March’s reading of 72.2. April’s score is the second-highest in the history of the index. This high score is largely fueled by increasing costs, and tightening capacities across the board.
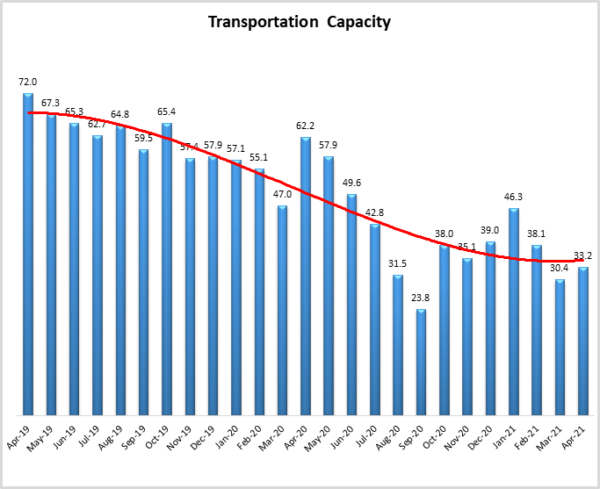
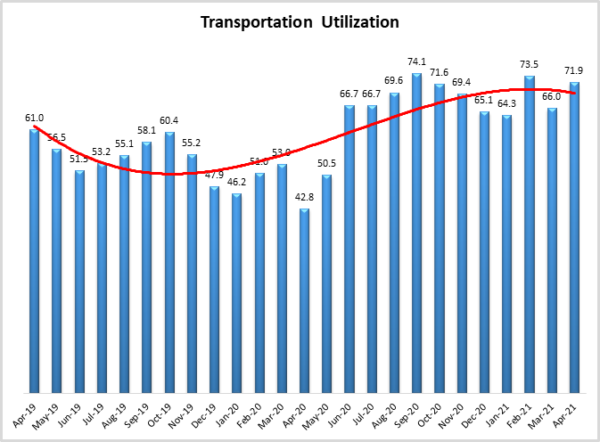
Transportation metrics reflect the supply and demand mismatch across modes that was discussed above. Transportation Capacity continues to contract, although at a slightly slower (+2.8) rate of 33.2. Even with this slight reduction, this is still one of the tightest transportation markets we have ever measured – an observation that is seemingly backed up by the high tender rejection rates and significant backlogs class-9 truck orders. The effects of the tight capacity has spilled over into the other two transportation metrics. Both Transportation Utilization (+5.9) and Transportation Prices (+2.1) are up to readings of 71.9 and 92.6 respectively. Both of these readings exceed the average levels for these metrics, particularly for Transportation Prices which show now sign of slowing down.
The increase in transportation prices and strain in capacity is being felt across almost every mode of transportation. Domestically, First quarter intermodal volume was up 10% y-0-y, the third consecutive quarter of growth and the highest quarterly gain since 2013. Trans-Pacific container rates from Asia to the U.S. have doubled year-over-year, costing about $5,000/box[4]. This container shortage is expected to last into at least 2022. Ironically, the economics of this shortage seem to be incentivizing many firms to act in ways that are counter-productive to ending it. The high cost of containers is enticing carriers to get back to China as quickly as possible so they can take another load. In addition to the blank sailings coming back from the U.S. to China discussed in last month’s report, a recent trend has emerged in which ships from China are returning on the backhaul route from the U.S. with 5-8% fewer containers, exacerbating the lack of containers available to come back across the Pacific[5].
Similar tightness is being reported for over-the-road networks. While rejection rates are down somewhat, the FreightWaves Tender Rejection Index still indicates that nearly one out of four potential loads are being rejected by carriers[6]. The lack of capacity, which is consistent with this month’s LMI reading of 33.2 – a significant rate of contraction, has led to a spike in prices. Many trucking companies are reporting strong profit margins but also that they are having problems increasing their fleets to meet growing demand[7]. Fleets have been slow to grow for many reasons, chief among them the lack of semiconductors needed for their manufacture. The component shortage has led to record class-8 truck order backlogs and manufacturers have actually seen the rate of orders decrease due in part to frustrated carriers[8]. The effects of the semiconductor shortage and lack of supply chain capacity are being felt across multiple industries, with firms such as Apple and Ford warning investors of production slowdowns[9] [10].
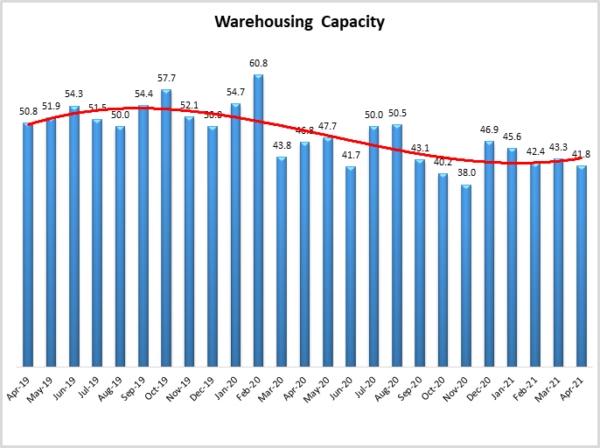
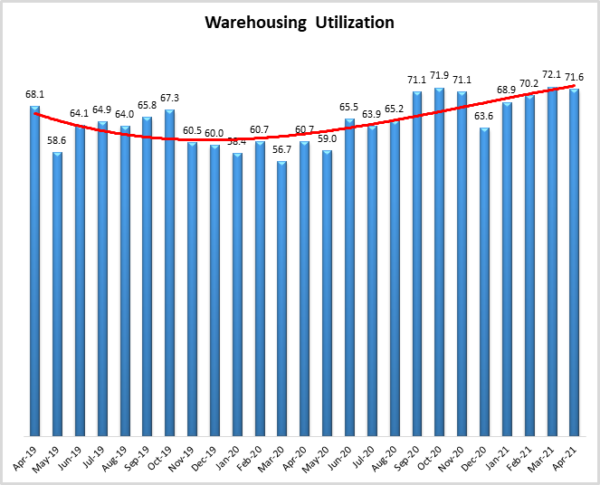
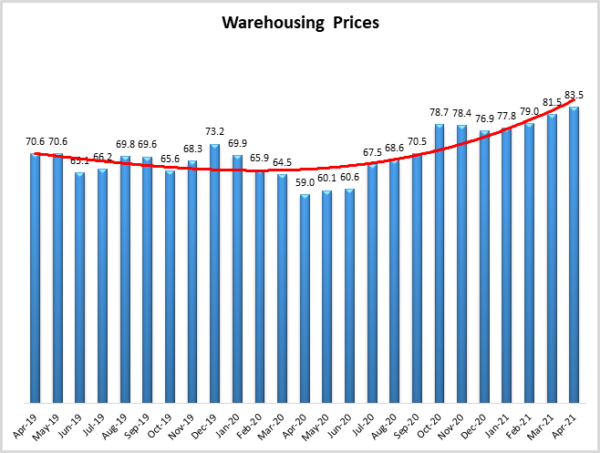
Cost growth is not only limited to transportation, as for the second month in a row, Warehouse Prices have reached an all-time high in the history of the index. In April they are up (+2.0) to a level of 83.5. This is a function of the continued decrease in Warehousing Capacity which is down (-1.5) to 41.8 – indicating significant levels of contraction. The rate of growth for Warehousing Utilization have more or less held steady (-0.5) reading in at 71.6.
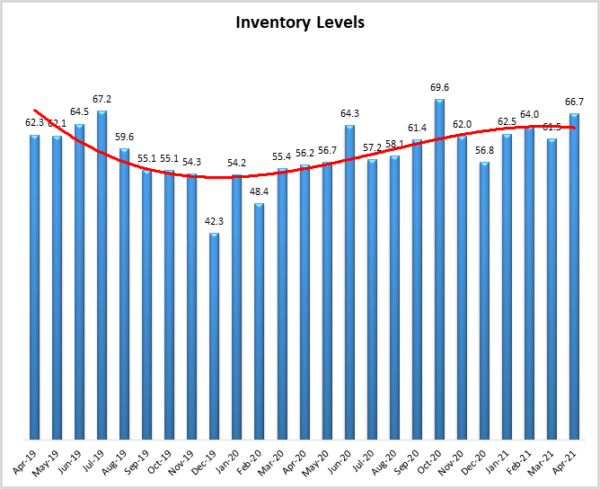
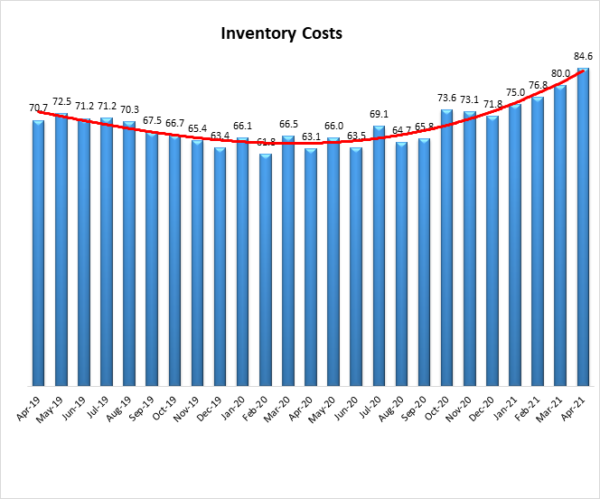
Due to the tightness in capacity, even moderate levels of growth in Inventory Levels, are leading to rapid cost increases. This month epitomizes that as Inventory Levels are up (+5.2) to 66.7. This is a strong rate of growth, but it is still within a single standard deviation of the 60.9, which is the all-time average for this metric. In contrast, Inventory Costs are up (+4.6) to an all-time high reading of 84.6. The contractions in available Warehousing and Transportation Capacity discussed above have created an environment in which each additional wave of inventory added to a firm’s supply chain is more costly than the last. There may not be much relief on the horizon for inventories, despite the rate of manufacturing growth, overall volume is still down from 2019[11], suggesting that industrial production is still in the process of fully recovering. There are indicators that this might change soon however, as the daily freight rates for large capsize ships recently reached an 18-month high. This is largely driven by growing imports of commodities and raw materials used for manufacturing into China[12]. While increased industrial production is welcome news for many, it will be fascinating to observe how this will affect already-strained ocean carriers.
It is telling that rates of growth for both Warehousing Prices and Inventory Costs are at all-time index highs, while Transportation Prices are growing at their fifth fastest rate. The sum of the three cost/price metrics are 260.7, the highest cumulative total of all three metrics on recoded in the nearly five-year history of the LMI. This suggests that, when viewed holistically, overall logistics costs are growing at their fastest rate over the last five years. As many firms manage inventory, warehousing, and transportation, this seems to be somewhat relevant. Much of this growth has happened in the last year, which can be observed in the figure below, in which Inventory Cost growth rates are up 20.4 points, Warehouse Prices are up 35.6 points, and Transportation Prices are up a staggering 64.9 points from a year ago (when they were actually contracting fairly rapidly.
This chart epitomizes the sense of “whiplash” that many firms are feeling as they deal with wild swings in the costs associated with their supply chains. Unfortunately for the firms who must bear these costs (but perhaps fortunately to providers), there is little relief in sight. U.S. ports are expecting imports to increase by 21% this year [13], with the reopened economy and consumer appetite for goods leading to core inflation peaking around 2.6% in the summer of 2021 [14].
The index scores for each of the eight components of the Logistics Managers’ Index, as well as the overall index score, are presented in the table below. Six of the eight metrics show signs of growth, with both capacity metrics continuing their runs of contraction. Inventory and warehouse metrics are up, and transportation is slightly down, but still growing at significant rates. The logistics industry remains tight and based on future predictions and industry experts seem likely to stay that way through the rest of the year.
| LOGISTICS AT A GLANCE | |||||
| Index | April 2021 Index | March 2021 Index | Month-Over-Month Change | Projected Direction | Rate of Change |
| LMI® | 74.5 | 72.2 | +2.2 | Growing | Increasing |
| Inventory Levels | 66.7 | 61.5 | +5.1 | Growing | Increasing |
| Inventory Costs | 84.6 | 80.0 | +4.6 | Growing | Increasing |
| Warehousing Capacity | 41.8 | 43.3 | -1.5 | Contracting | Decreasing |
| Warehousing Utilization | 71.6 | 72.1 | -0.5 | Growing | Decreasing |
| Warehousing Prices | 83.5 | 81.5 | +2.0 | Growing | Increasing |
| Transportation Capacity | 33.2 | 30.4 | +2.8 | Contracting | Increasing |
| Transportation Utilization | 71.9 | 66.0 | +5.9 | Growing | Increasing |
| Transportation Prices | 92.6 | 90.6 | +2.1 | Growing | Increasing |
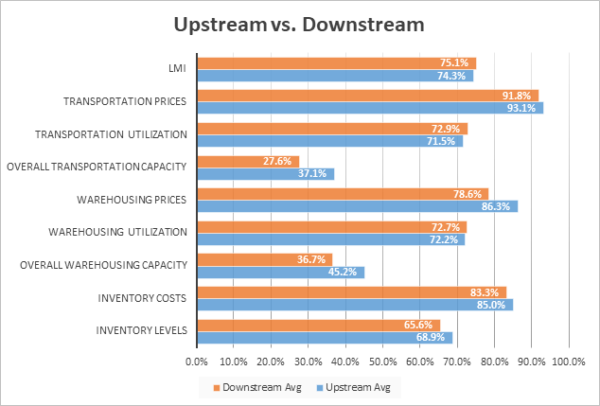
This month, both upstream (blue bars) and downstream (orange bars) firms reported significant continued growth in the utilization of logistics services. We observed some differences in both available Transportation and Warehousing Capacity and the cost of Warehousing.
T-tests demonstrate that downstream firms are reporting a significantly lower rate of growth for Transportation Capacity and Warehousing Capacity. Conversely, upstream firms are reporting significantly higher rates in Warehousing Prices. It is interesting that downstream firms are having a harder time finding more constrained urban warehouses, while upstream firms pay more to hold their backlog of inventory.
| April ‘21 | Inv. Lev. | Inv. Costs | WH Cap. | WH Util. | WH Price | Trans Cap | Trans Util. | Trans Price |
| Downstream | 65.6 | 83.3 | 36.7 | 72.7 | 78.6 | 27.6 | 72.9 | 91.8 |
| Upstream | 68.9 | 85.0 | 45.2 | 72.2 | 86.3 | 37.1 | 71.5 | 93.1 |
| Delta (abs) | 3.3 | 1.7 | 8.6 | 0.5 | 7.7 | 9.6 | 1.4 | 1.2 |
| Significant? | No | No | Marginal | No | Yes | Yes | No | No |
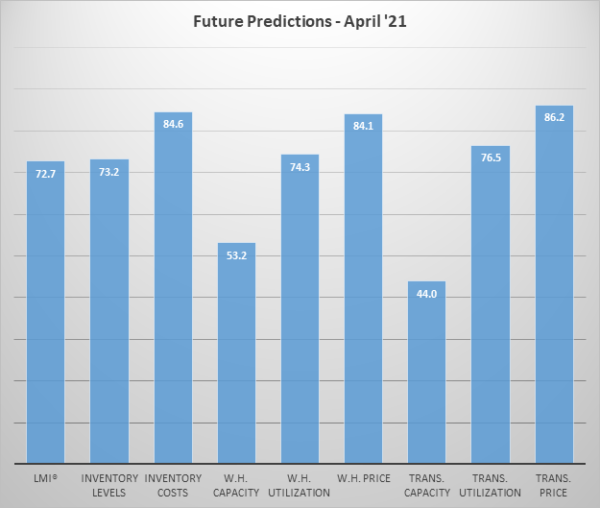
Respondents were asked to predict movement in the overall LMI and individual metrics 12 months from now. Their predictions for future ratings are presented below. Despite the continued need for more capacity, respondents do not expect much to come online, predicting moderate growth for warehousing capacity at 53.2, and a continuing contraction in Transportation Capacity with a reading of 44.0. Both of these readings are down from last month when respondents were slightly more optimistic about the potential for increased supply. They in turn predict continued high rates of growth for costs in inventory, warehousing, and transportation, with all three metrics registering in the mid-’80s. Given the continued heating of the U.S. economy and the restrictions placed on truck manufacturing by the semiconductor shortage, it seems likely that it will take more than a year of building up additional capacity to catch up.
Interestingly, we see some divergence from our upstream and downstream respondents when asked to predict future movements, as can be seen in the figure below:
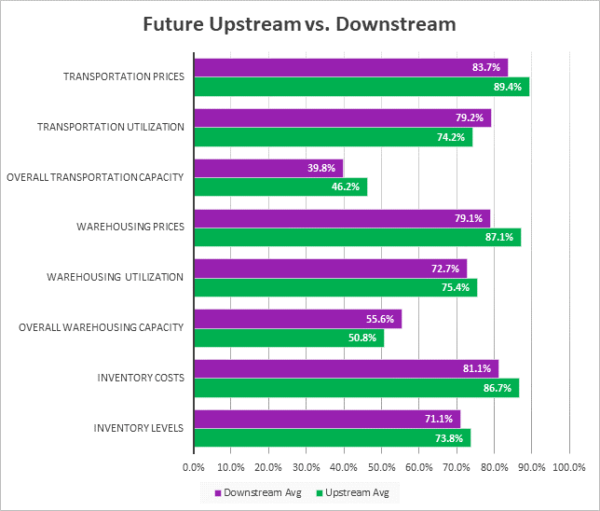
Similar to what we saw above, statistical analysis confirms that downstream firms (purple bars) are expecting significantly greater growth in Warehouse Prices, demonstrating the increasing tightness in facilities that are located close enough to customers to provide adequate levels of service. Whether this difference in price and capacity changes holds true over the next 12 months remains to be seen.
| Future Readings | Inv. Lev. | Inv. Costs | WH Cap. | WH Util. | WH Price | Trans Cap | Trans Util. | Trans Price |
| Downstream | 71.1 | 81.1 | 55.6 | 72.7 | 79.1 | 39.8 | 79.2 | 83.7 |
| Upstream | 73.8 | 86.7 | 50.8 | 75.4 | 87.1 | 46.2 | 74.2 | 89.4 |
| Delta (abs) | 2.7 | 5.6 | 4.8 | 2.7 | 8.0 | 6.4 | 4.9 | 5.7 |
| Significant? | No | No | No | No | Yes | No | No | No |
Historic Logistics Managers’ Index Scores
This period’s along with prior readings from the last two years of the LMI are presented table below. The values have been updated to reflect the method for calculating the overall LMI:
| Month | LMI | Average for previous readings – 63.1
High – 75.7 Low – 51.3 Std. Dev – 6.68
|
| Apr ‘21 | 74.5 | |
| Mar ‘21 | 72.2 | |
| Feb ‘21 | 71.4 | |
| Jan ‘21 | 67.2 | |
| Dec ‘20 | 66.7 | |
| Nov ‘20 | 70.8 | |
| Oct ‘20 | 71.6 | |
| Sep ‘20 | 70.5 | |
| Aug ‘20 | 66.0 | |
| July ‘20 | 63.0 | |
| June ‘20 | 61.7 | |
| May ‘20 | 54.5 | |
| Apr ‘20 | 51.3 | |
| Mar ‘20 | 58.9 | |
| Feb ‘20 | 52.6 | |
| Jan ‘20 | 54.1 | |
| Dec ‘19 | 54.0 | |
| Nov ‘19 | 54.4 | |
| Oct ‘19 | 54.4 | |
| Sep ‘19 | 56.6 | |
| August ‘19 |
LMI®
The overall LMI index is 74.5, up (2.3) from March’s reading of 72.2. This is the highest score for the overall index in the last two years and the second-highest overall score in the history of the index. This is approximately a 50% increase from a year ago when the April reading came in at 51.3. The rapid rates of growth are driven by high rates of price expansion and record-high inventory costs.
Respondents expect some loosening of capacity constraints but continuous growth in prices over the next 12 months, leading to a future LMI prediction of 72.4, similar (+0.7) to March’s future prediction of 71.7. This suggests that the logistics industry will continue to experience significant levels of growth over the next 12 months.
Inventory Levels
The Inventory Level value is 66.7, up (+5.2) from last month’s reading. The current value is 10.5 points and clearly above the all-time average value for this metric of 60.9. This month, upstream respondents returned a value of 68.9, compared to 65.6 for downstream respondents. Both represent significant growth in inventory levels, but upstream respondents are experiencing greater growth, by 3.3 points. Last month downstream values were 8.7 points higher than upstream, and 11-point swing.
When asked to predict what conditions will be like 12 months from now, the average value is 73.2, down (-4.3) from last month’s value of 77.5. This is also above the current inventory index value of 66.7. Respondents expect inventory values to continue increasing significantly over the next year.
Inventory Costs
Given the continued increases in inventory levels, it is not surprising that inventory costs have continued to increase. The current value is 84.6 which is not only up (+4.6) from last month’s reading but is also the all-time high for this metric. The current value is 21.5 points above the value last year at this time, and 13.9 points above the reading from two years ago.
When asked about what they expect inventory costs to be like 12 months from now, respondents predicted that inventory levels would come in at 84.6, down slightly (-1.4) from last month’s value of 86.0. Upstream (85.8) and downstream (87.5) gave similar responses.
 Warehousing Capacity
The ebb and flow of the Warehousing Capacity Index continue to oscillate, as this month it registered 41.8 percent in April 2021, meaning that warehouse capacity is still below the 50 percent mark, now for the 8th month in a row. Furthermore, it represents a break from last month’s slight uptick. This result is slightly down (-1.5) from March’s reading of 43.3. Interestingly, this reading is down by 5 points from the reading one year ago (April 2020 registered in at 46.8), which was at the height of the COVID-19 pandemic. Previous predictions from the LMI reports indicated a sea change of sorts, from the pre-COVID days to the present. Continued data support the idea that the consumer demand for eCommerce appears only to be growing, and as a result, so too has the demand for warehousing. This is reflective of the contraction in this space, one year after COVID hit its height.
Looking forward to the next 12 months, the predicted Warehousing Capacity index is predicted to increase at a rate of 53.2, down slightly (-1.4) from March’s more optimistic reading of 54.6. This indicates that respondents are not particularly hopeful regarding new storage facilities coming online.
 Warehousing Utilization
The Warehousing Utilization Index registered 71.6 percent in April 2021. This represents a rather small .5 percentage point decrease from last month but is up dramatically by nearly 11 percentage points from the April 2021 reading of 60.7. This represents a break from the warehousing capacity numbers’ one-year retrospective, where there is a continued contraction. Here, with the utilization numbers it seems that in conjunction with the decreased capacity, the utilization is still tightening, thereby indicating the pressure on this space. The continued increase, alongside the continued contraction in the warehousing capacity, should put continued pressure on prices (as is the case this month), necessitating increased warehousing capacity to come online.
Looking forward to the next 12 months, the predicted Warehousing Utilization index is 74.3, down (-5.1) from March’s future prediction of 79.4. Respondents expect to utilize increasingly greater amounts of available warehouse space throughout the year as supply struggles to keep up with demand.
Warehousing Prices
Warehousing Prices Index registered 83.5 percent in April 2021. This represents an increase (+2.0) from last month’s reading of 81.5. This is the second month in a row we observe an all-time high in this metric, continuing the trend in the (apparently unrelenting) increased growth rate amid the COVID-19 disruption(s). This reading is also up by a dramatic 24.5 percentage points from the reading one year ago. Previous predictions focused on the increase in utilization, and decrease in capacity to suggest that there would continue to beupward pressure on pricing, and it seems that the pressure is unrelenting. This necessitates, as has been suggested, increased capacity to come online to balance out the demand and pricing dynamics. Previously, our team suggested that “given that capacity has not increased, and utilization of warehousing has continued to grow, it seems that there will be no relief in pricing anytime soon”, unfortunately, it seems that this prediction has come to fruition.
Future predictions suggest that respondents are expecting prices to continue to grow at a rate of 84.1, down slightly (-0.9) from March’s future prediction of 85.0, but still representing a significant increase. As mentioned above, April 2021’s rates of growth for this metric represent an all-time high, and with the low anticipated increase in capacity, respondents do not expect much relief through the rest of 2021
Transportation Capacity
The Transportation Capacity Index registered 33.2 percent in April 2021. This constitutes a small increase of 2.8 percentage points from the March reading of 30.4. Despite this modest increase in transportation capacity, the index remains historically low, indicating continued downward pressure on transportation capacity. As mentioned above, orders for trucks have actually gone down, as firms seem to be growing frustrated by the ever-growing backlog, with seemingly little relief on the horizon.
Future capacity predicts more of the same, reading in at 44.0, down (-5.6) from March’s future prediction of 50.6. This dip brings the index below the critical threshold of 50 and indicating expectations of contraction in transportation capacity for the next 12 months.
Transportation Utilization
The Transportation Utilization Index registered 71.9 percent in April 2021, up (+5.9) from March’s reading of 66.0. The index remains elevated and close to historical highs, indicating continued expansion in transportation utilization. Generally, Transportation Prices and Utilization move together, the slower growth of the utilization metric may indicate that prices have become so high that some shippers are choosing to delay shipments or find other alternatives.
It should be noted that the future Transportation Utilization Index is also up to 76.5 (+8.5) from March’s future prediction of 68.0. previous month indicating a 76.5 percent level for the next 12 months. As such, expectations of continued growth in transportation utilization remain very strong.
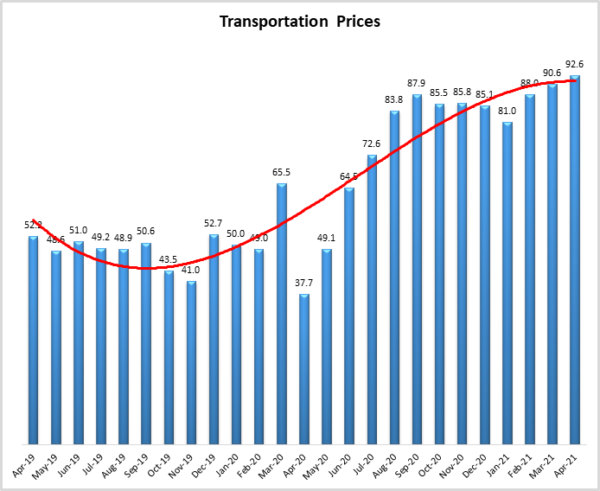
Transportation Prices
The Transportation Prices Index registered 92.6 in April 2021. This is up (+2.0) from March’s readings of 90.6. They are the fifth-highest in the history of the index as well as the highest over the last 2.5 years. The upward pressure on transportation prices that gained momentum in the fall months of 2020 continues to get stronger and stronger.
It looks like the strong upward pressure on transportation prices is here to stay, with the future index for transportation prices indicating a value of 86.2, up (+4.1) from March’s future prediction of 82.1. Respondents have been faced with steep rates of price growth since last summer, and at this point, they do not seem hopeful that there will be much relief over the next year.
About This Report
The data presented herein are obtained from a survey of logistics supply executives based on information they have collected within their respective organizations. LMI® makes no representation, other than that stated within this release, regarding the individual company data collection procedures. The data should be compared to all other economic data sources when used in decision-making.
Data and Method of Presentation
Data for the Logistics Manager’s Index is collected in a monthly survey of leading logistics professionals. The respondents are CSCMP members working at the director level or above. Upper-level managers are preferable as they are more likely to have macro-level information on trends in Inventory, Warehousing and Transportation trends within their firm. Data is also collected from subscribers to both DC Velocity and Supply Chain Quarterly as well. Respondents hail from firms working on all six continents, with the majority of them working at firms with annual revenues of over a billion dollars. The industries represented in this respondent pool include, but are not limited to: Apparel, Automotive, Consumer Goods, Electronics, Food & Drug, Home Furnishings, Logistics, Shipping & Transportation, and Warehousing.
Respondents are asked to identify the monthly change across each of the eight metrics collected in this survey (Inventory Levels, Inventory Costs, Warehousing Capacity, Warehousing Utilization, Warehousing Prices, Transportation Capacity, Transportation Utilization, and Transportation Prices). In addition, they also forecast future trends for each metric ranging over the next 12 months. The raw data is then analyzed using a diffusion index. Diffusion Indexes measure how widely something is diffused, or spread across a group. The Bureau of Labor Statistics has been using a diffusion index for the Current Employment Statics program since 1974, and the Institute for Supply Management (ISM) has been using a diffusion index to compute the Purchasing Managers Index since 1948. The ISM Index of New Orders is considered a Leading Economic Indicator.
We compute the Diffusion Index as follows:
PD = Percentage of respondents saying the category is Declining,
PU = Percentage of respondents saying the category is Unchanged,
PI = Percentage of respondents saying the category is Increasing,
Diffusion Index = 0.0 * PD + 0.5 * PU + 1.0 * PI
For example, if 25% say the category is declining, 38% say it is unchanged, and 37% say it is increasing, we would calculate an index value of 0*0.25 + 0.5*0.38 + 1.0*0.37 = 0 + 0.19 + 0.37 = 0.56, and the index is increasing overall. For an index value above 0.5 indicates the category is increasing, a value below 0.5 indicates it is decreasing, and a value of 0.5 means the category is unchanged. When a full year’s worth of data has been collected, adjustments will be made for seasonal factors as well.
Logistics Managers Index
Requests for permission to reproduce or distribute Logistics Managers Index Content can be made by contacting in writing at: Dale S. Rogers, WP Carey School of Business, Tempe, Arizona 85287, or by emailing [email protected] Subject: Content Request.
The authors of the Logistics Managers Index shall not have any liability, duty, or obligation for or relating to the Logistics Managers Index Content or other information contained herein, any errors, inaccuracies, omissions or delays in providing any Logistics Managers Index Content, or for any actions taken in reliance thereon. In no event shall the authors of the Logistics Managers Index be liable for any special, incidental, or consequential damages, arising out of the use of the Logistics Managers Index. Logistics Managers Index, and LMI® are registered trademarks.
About The Logistics Manager’s Index®
The Logistics Manager’s Index (LMI) is a joint project between researchers from Arizona State University, Colorado State University, University of Nevada, Reno, Rochester Institute of Technology and Rutgers University, supported by CSCMP. It is authored by Zac Rogers Ph.D., Steven Carnovale Ph.D., Shen Yeniyurt Ph.D., Ron Lembke Ph.D., and Dale Rogers Ph.D.


