Composite leading indicators (CLIs), designed to anticipate turning points in economic activity relative to trend six to nine months ahead, now point to stable growth momentum in the OECD area as a whole following last month’s assessment of stabilising growth momentum, but continue to point to easing growth momentum in the United States, Germany and the euro area as whole.
Among other large OECD economies, the assessment for France continues to point to stable growth momentum, which is now also the case for Canada. In the United Kingdom, although large margins of error persist due to Brexit uncertainty, growth momentum is expected to remain stable, albeit around historically low trend growth rates. Stabilising growth momentum remains the assessment for Japan with similar signals now emerging in Italy.
Among major emerging economies, the CLIs continue to point to stable growth momentum in the industrial sector of China, although the recent rise in trade tensions has introduced a higher degree of uncertainty than usual. Stable growth momentum also remains the assessment for India and Russia, with similar signals now emerging in Brazil.
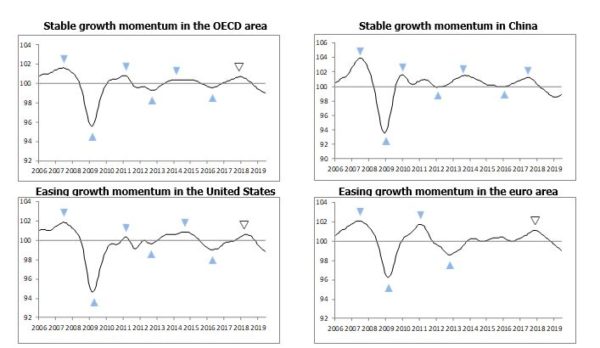
The above graphs show country specific composite leading indicators (CLIs). Turning points of CLIs tend to precede turning points in economic activity relative to trend by approximately six months. The horizontal line at 100 represents the trend of economic activity. Shaded triangles mark confirmed turning-points of the CLI. Blank triangles mark provisional turning-points that may be reversed.
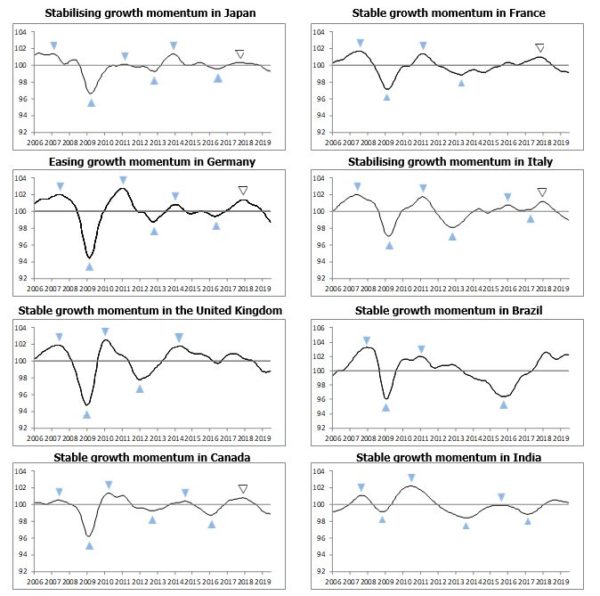
The graphs show country specific composite leading indicators (CLIs). Turning points of CLIs tend to precede turning points in economic activity relative to trend by approximately six months. The horizontal line at 100 represents the trend of economic activity. Shaded triangles mark confirmed turning-points of the CLI. Blank triangles mark provisional turning-points that may be reversed.
Table 1: Composite Leading Indicators*
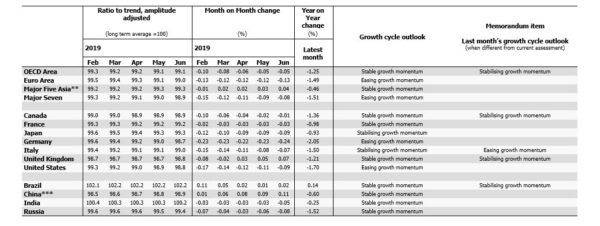
* CLI data for 32 OECD member countries and 6 OECD non-member economies are available at:
http://stats.oecd.org/default.aspx?datasetcode=MEI_CLIhttps://mail.google.com/mail/u/0/?pli=1#inbox/WhctKJVZkNpsgHfkMdLwdrXFBRVcrCMKtBZFKxGQpzBMLljHhsKcMlvBQpCglbfVjRHcWmG?projector=1&messagePartId=0.1
** China, India, Indonesia, Japan and Korea.
*** The reference series for China is the value added of industry, at 1995 constant prices,100 million Yuan.