-
LMI® at 51.1
-
Growth is INCREASING AT AN INCREASING RATE for Warehousing Capacity and Transportation Capacity
-
Growth is INCREASING AT AN DECREASING RATE for Inventory Levels, Inventory Costs, Warehousing Utilization, and Warehousing Prices
-
NO MOVEMENT FOR Transportation Utilization
-
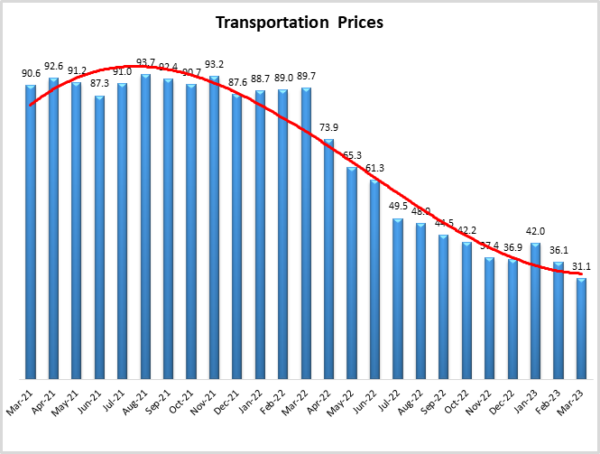
Transportation Prices ARE DECREASING
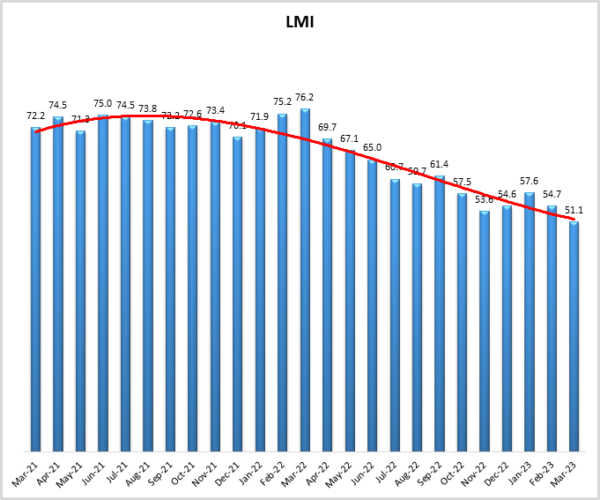
The Logistics Managers’ Index reads at 51.1 in March, this is down (-3.6) from February’s reading of 54.7 in February. This is the lowest reading for the overall index in the 6.5-year history of the LMI. This is being driven by an all-time low in Transportation Prices, which are down (-5.0) to 31.1, reaching a nadir for the second consecutive month. Relatedly, Transportation Utilization reads in at 50.0, indicating no upward movement for the first time in 2023. Inventory Levels (55.6) continue to grow, though at a decreasing (-6.8) rate. And both Transportation (71.4) and Warehousing Capacity (58.2) continue their upward climb.
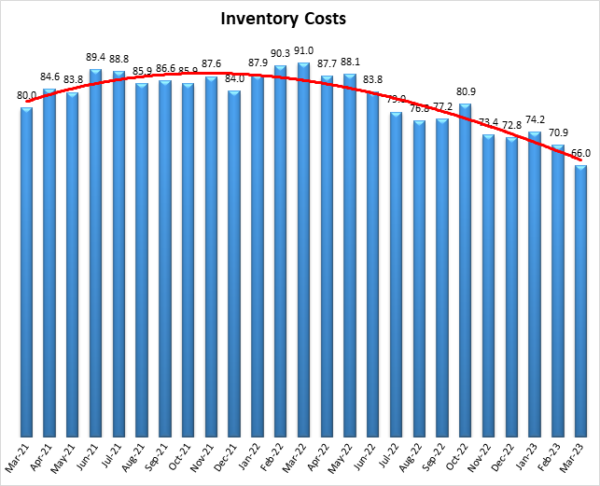
Interestingly, Inventory Costs (66.0) read in below 70.0 – which we consider being the threshold of significant levels of expansion – for the first time since September 2020. Transportation and Warehousing both contribute to the costs of holding inventory. This metric moving to a more moderate rate of growth is a strong indicator that the high supply costs that have been the primary source of overall inflation in the U.S. for much of the last year are beginning to subside; something that will hopefully be taken into account by the Federal Reserve as they consider their course of action throughout the rest of 2023.
Researchers at Arizona State University, Colorado State University, Florida Atlantic University, Rutgers University, and the University of Nevada, Reno, in conjunction with the Council of Supply Chain Management Professionals (CSCMP) issued this report today.
Results Overview
The LMI score is a combination of eight unique components that make up the logistics industry, including inventory levels and costs, warehousing capacity, utilization, and prices, and transportation capacity, utilization, and prices. The LMI is calculated using a diffusion index, in which any reading above 50.0 indicates that logistics is expanding; a reading below 50.0 is indicative of a shrinking logistics industry. The latest results of the LMI summarize the responses of supply chain professionals collected in March 2023.
The overall economy continues to be somewhat mixed. Things are clearly slower than they have been, but it does not seem that we are in an official recession. The U.S. economy grew at a pace of 2.6% in Q4 2022, which is slightly lower than what was expected[1]. This is partial because seasonally adjusted consumer spending grew by 0.2% in February, down significantly from the 2% growth observed in January. Inflation was up 5% year-over-year, but at a slower pace than what we saw in January’s 5.3%. Increased interest rates have led to the U.S. money supply falling year-over-year in every month since December – reaching its fasted rate of decline since the 1930s (which economically speaking, is never a decade you’d like to be compared to)[2]. However, the slowing rates of inflation, combined with the recent troubles in the banking system have led Jerome Powell to suggest the Fed’s program of interest rate increases may be slowing down in the near future[3]. This all led to some optimism on Wall Street, leading the S&P 500 and Nasdaq to expand by 7.3% and 16.77% in Q1 – which was the best quarter for the Nasdaq since 2020[4]. These mixed economic messages are epitomized by the LMI’s overall index score of 51.1 (-3.6). This is the slowest rate of growth we have ever tracked in the 6.5 years of the index, but it is still growth. Things have clearly been slowing down, but the macroeconomy has not yet come to a halt.
Volumes moving through the Port of Los Angeles have been slowly climbing since reaching their nadir in February, with volume creeping back up over 100,000 TEUs in the second week of April[5]. This is likely an echo of the increase in Chinese manufacturing volumes we observed last month, as completed goods are now making their way to the U.S. The Chinese manufacturing PMI was down slightly in February but still expanding[6]. When combined with the robust expansion in Chinese services, it certainly seems the world’s second-largest economy is coming back to life, with some of the byproduct likely to be inventory trickling into the U.S.
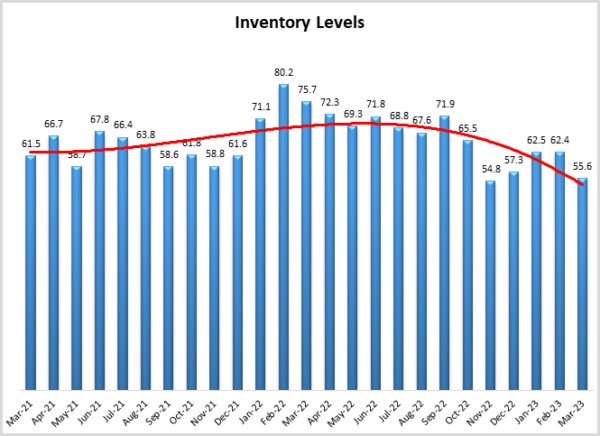
Inventory Levels are growing at a rate of 55.6, which is lower than what we’ve seen (-6.8) in 2023 but similar to November and December. This growth is likely focused more on retail and consumables as goods that are tied to housing and other areas that are most impacted by interest rates have piled up over the last year. Consumers are still spending though, and some new inventory coming into the U.S. will be necessary as some large retailers such as Nike report significant progress in whittling down inventories. Although for some firms, moving inventory so quickly required many goods to be sold at a discount which bumped up topline sales in 2022 – something that is likely to fall in 2023[7]. The slowdown in spending and a glut of inventory has led some firms to put additional pressure on their suppliers. The shortages that plague supply chains have long since ended and large firms are attempting to reestablish dominance over their suppliers, canceling orders and pushing for cost-cutting measures[8]. While Inventory Level expansion has slowed, we still see fairly robust growth in Inventory Costs, which read in at 66.0 (-4.8). It is interesting that Inventory Costs have fallen below 70.0 – which we define as the cutoff for significant rates of growth – for the first time since September 2020. Respondents predict that the expansion of this metric will continue to slow down over the next year. If this were to come true, it could signal significant relief for consumers and firms at every level of the supply chain.
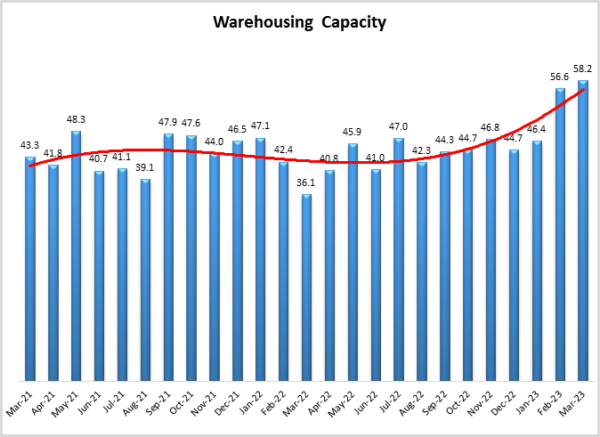
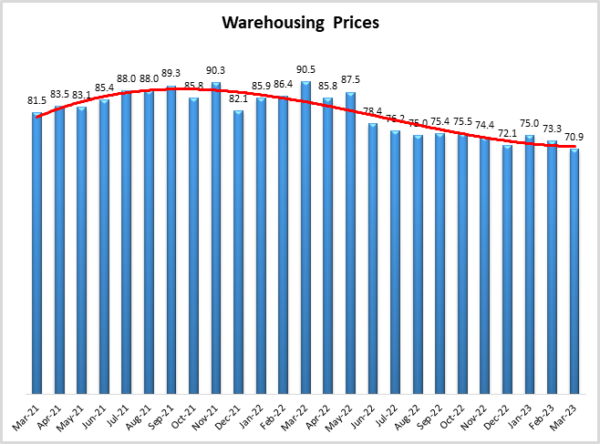
After 30 months of expansion, Warehousing Capacity is up (+1.6) for the second consecutive month to 58.2. Industrial property sales were down 55% year-over-year through January and February. This is not only slowed because of decreased demand but also due to the increased costs of wages and materials. As lending tightens due the concerns regarding the U.S. banking system, procuring the capital necessary to overcome these obstacles will become more difficult. Despite all this, the average rental rate for industrial space was up 18.6% during Q4[9]. This is reflected in the continued growth of Warehousing Prices, which is down slightly (-2.4) but still reads in at a robust 70.9. There were many months where we observed several metrics growing quickly at rates in the 70s, 80s, and 90s. In March of 2023, only Warehousing Prices remain in the realm of significant expansion. This likely reflects the long-term contracts that many firms are under – keeping them in warehouses longer than they really need them at elevated prices. In many ways, Warehousing Prices are a lagging indicator. If demand continues to soften and this metric was to dip much further, there is a chance that the overall index could shift into contraction.
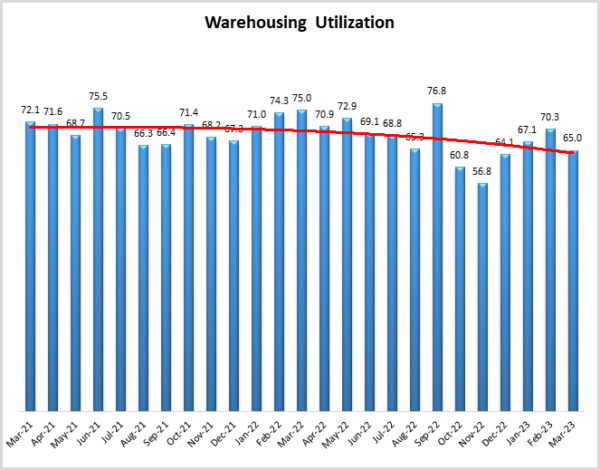
The other warehousing metric that remains relatively strong is Warehousing Utilization, which is also down (-5.3) but still growing at a rate of 65.0. Utilization remains high for many reasons, one of them being that some upstream firms are struggling with inventory clogging up their warehouses after their customers cancelled orders following the slowdown in consumer demand. Amazon was sued by their Vietnamese supplier Gillimex who alleged that Amazon’s promises of high order levels led them to invest heavily in now-unneeded warehousing capacity8. There is also the issue that new capacity is not being built in all of the markets where firms are looking for it. An increased number of city codes placing permanent or temporary moratoriums on warehouse development as a reaction to 1.6 billion square feet of space that has been built since 2020[10]. Warehousing metrics are clearly on a downward trend, but as of this moment, it has only led to some market stabilization, not a full-blown meltdown for the sector.
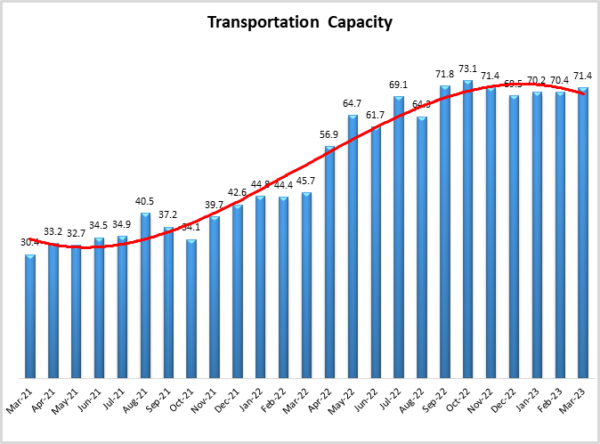
The same cannot be said for our transportation metrics. The freight recession that has been discussed over the last few months seems to have reared its head in March. Flagship Transport has unexpectedly closed, with the approximately 455 drivers who worked for the company no longer receiving paychecks or any contact from company executives[11]. This comes only a few weeks after FreightWorks Transport with its roughly 200 employees shut down due to “massive rate and volume concessions”[12]. Further consolidation of the freight industry is evident in Knight-Swift’s $808 million acquisition of U.S. Xpress. This adds significant size to the firms that were already the largest truckload operator in the U.S.[13]. The recent Parcel Shipping Index from Pitney Bowes shows that parcel volumes were down 2% year-over-year in 2022 – dropping from 21.7 billion to 21.2 billion parcels shipped. They do point out however that this is still over a billion parcels above the pre-COVID projections for volume in 2022. Interestingly, they show drops in volume for USPS, UPS, and FedEx, but year-over-year stability for Amazon[14]. This is consistent with other metrics suggesting that consumers are still spending money on direct retail, even as other parts of the economy softened. The drying up of transportation demand extends to the oceans, where carriers are struggling to fill the capacity they built up over the last few years. With many of the contracts that were in place now expiring, importers are choosing between locking in low rates or taking advantage of the very favorable spot market[15]. This softening is reflected in the continued expansion of the available Transportation Capacity index which is up (+1.0) to 71.4, the fourth-highest reading for this metric in the history of the index. The abundance of capacity has led to firms being less precious on Transportation Utilization, with the metric dropping (-1.9) to 50.0 – putting this metric squarely back into “no movement” territory after it had expanded during the first two months of the year.
The decline in demand has led to some cost benefits. In a sign of how markets have stabilized, diesel fuel in the U.S. was down to $4.13 per gallon in the last week of March. This is down $1.06 from a year ago when fuel markets were still reeling from the Russian invasion of Ukraine[16]. The situation is even better for large carriers, as wholesale fuel prices came in $1.43 lower per gallon than the retail prices paid by smaller firms[17]. This is reflected in the continued drop (-5.1) in Transportation Prices which read in at an all-time low of 31.1 in March. It will be interesting to observe if prices are significantly affected by OPEC’s April 2nd announcement that they would be cutting production by a million barrels per day[18]. Markets were able to restabilize after 2 million barrels of production were cut last Fall, but with as tightly balanced as the fuel market has been we might expect at least some upward movement in price.
The other big transportation story to keep an eye on going forward is the new regulations passed in California. California has pushed forward legislation banning diesel trucks from operating at their busy ports[19]. With the prominence of California’s ports, the impacts of this are likely to be wide-ranging. In addition to this, on March 31st the EPA gave California approval to require that 50% of all heavy-duty truck sales be fully electric by 2035[20]. Firms continue to invest in electric vehicle supply chains. Ford announced a $4.5 billion investment in a nickel processing plant in Indonesia in an attempt to ensure they have a constant assurance of supply[21]. Up to now, carriers have been slow to adopt greener alternatives due to the continued high cost of technology and alternative fuels. As of early 2023, electric trucks are approximately three times as expensive as their traditional counterparts, and ocean carriers are looking at a $3 trillion. However, given the importance of the California market, the passage of these new regulations all but ensures these bills will need to be paid eventually for carriers operating in the U.S.
There is still some hope that the freight market will pick back up later in 2023, but the optimism that many carriers had been reporting for the second half of 2023 seems to have faded somewhat. While many still anticipate some growth, many are pessimistic that 2023 will see a return to the busy times of 2020-21. Shelly Simpson, president of freight at JB Hunt recently told shareholders that she is “slightly less optimistic than our customers”[22].
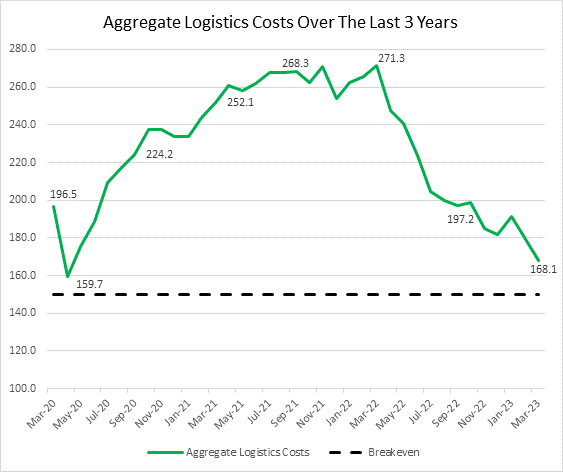
Combining our three cost metrics (Inventory Costs, Warehousing Prices, and Transportation Prices) can provide a picture of aggregate logistics costs. The green line in the chart below presents the movement in aggregate logistics costs from March 2020-March 2023. Because the scores of three metrics are combined, the chart ranges from 0-300 with 150 (dashed black line) representing the breakeven point. In March 2023 aggregate costs are down to 168.1. This is the second-lowest reading in the history of the index, ahead of only the 159.7 occurring in April 2020 at the height of COVID. Quickly after reaching that nadir, aggregate costs embarked on nearly two consecutive years of growth, cresting at an all-time high of 271.3. These high supply costs were reflective of and contributed to, supply-driven inflation. Supply shortages and costs have been significant drivers of inflation. This contribution is captured in the Federal Reserve’s sources of inflation tracker, in which supply-driven has outstripped demand-driven inflation in 7 of the last 12 months (Shapiro 2023). The decrease in supply as a contributor to inflation tracks roughly with aggregate logistics costs. This partially explains why the rates of inflation growth have slowed as much as they have despite consumer spending continuing to increase. The Fed’s program of interest rate increases has impacted demand, but this chart combined with other economic factors suggests that a loosening of supply capacity has been as, if not more, responsible for easing inflation. If the declining rates of inflation lead to a pause in the raising of interest rates, demand may increase again – which would of course push aggregate logistics costs back up – although not likely to the unsustainable levels observed one year ago.
One bit of nuance with this month’s readings is that the situation improved somewhat in the second half of March. The most notable here was the significant tightening of Warehousing Capacity from 64.3 to 51.9, and the Increase in Transportation Utilization from 45.6 to 54.6. That capacity tightened and utilization increased suggests that the logistics industry picked up steam as the month went along. Further evidence of this is that the overall index was actually in contraction territory through the first half of March but started expanding again in the last few weeks. Almost every metric reflected a busier second half of March. The exception to this was the Inventory metrics. Inventory Levels dipped nine points from 60.0 to 51.0, suggesting that firms continued to shed goods throughout March. This could point to an increased movement of goods due to sales and a need for imports to increase in April. Whether or not this slight increase in the back half of March will be the start of a trend that continues into April, or is simply a blip, remains to be seen.
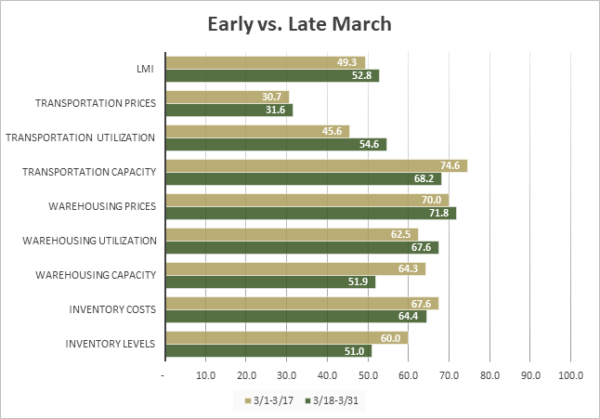
| Inv. Lev. | Inv. Costs | WH Cap. | WH Util. | WH Price | Trans Cap | Trans Util. | Trans Price | LMI | |
| March 1-17 | 60.0 | 67.6 | 64.3 | 62.5 | 70.0 | 74.6 | 45.6 | 30.7 | 49.3 |
| March 18-31 | 51.0 | 64.4 | 51.9 | 67.6 | 71.8 | 68.2 | 54.6 | 31.6 | 52.8 |
| Delta | 9.0 | 3.2 | 12.4 | 5.1 | 1.8 | 6.4 | 9.0 | 0.9 | 3.5 |
| Significant? | No | No | Yes | No | No | No | Marginal | No | No |
The index scores for each of the eight components of the Logistics Managers’ Index, as well as the overall index score, are presented in the table below. The only metric that is contracting is Transportation Prices, which are down for the ninth consecutive month and have reached a new all-time low. Transportation Utilization has moved from expansion to no movement, reading in at 50.0.
| LOGISTICS AT A GLANCE | |||||
| Index | March 2023 Index | February 2023 Index | Month-Over-Month Change | Projected Direction | Rate of Change |
| LMI® | 51.1 | 54.7 | -3.6 | Growing | Slower |
| Inventory Levels | 55.6 | 62.4 | -6.8 | Growing | Slower |
| Inventory Costs | 66.0 | 70.9 | -4.8 | Growing | Slower |
| Warehousing Capacity | 58.2 | 56.6 | +1.6 | Growing | Faster |
| Warehousing Utilization | 65.0 | 70.3 | -5.3 | Growing | Slower |
| Warehousing Prices | 70.9 | 73.3 | -2.4 | Growing | Slower |
| Transportation Capacity | 71.4 | 70.4 | +1.0 | Growing | Faster |
| Transportation Utilization | 50.0 | 51.9 | -1.9 | No Movement | From Growing |
| Transportation Prices | 31.1 | 36.1 | -5.0 | Contracting | Faster |
In a marked change from what we had observed through the first few two months of 2023, in March we find no significant differences between our Downstream (orange bars) and Upstream (blue bars) respondents. In February, Downstream firms reported significantly elevated levels of all three transportation metrics, suggesting that perhaps the ongoing freight slowdown was impacting B2B more than B2C operations. There is no longer evidence of this in March, as we now see very little difference across the different levels of the supply chain. There is some evidence that imports will be picking up over the next month, whether or not we will see any of this activity reflected in Upstream responses sometime soon remains to be seen.
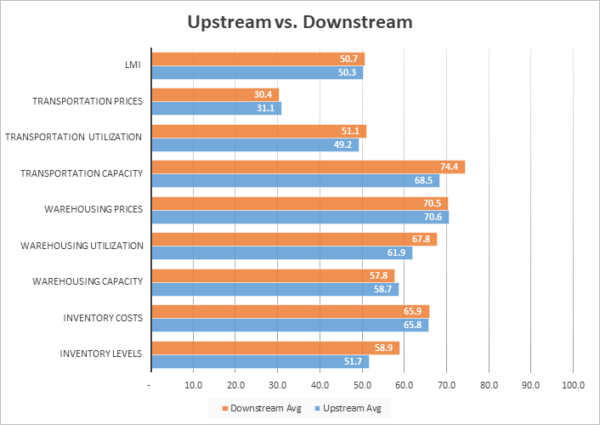
| Inv. Lev. | Inv. Costs | WH Cap. | WH Util. | WH Price | Trans Cap | Trans Util. | Trans Price | LMI | |
| Upstream | 51.7% | 65.8% | 58.7% | 61.9% | 70.6% | 68.5% | 49.2% | 31.1% | 50.3% |
| Downstream | 58.9% | 65.9% | 57.8% | 67.8% | 70.5% | 74.4% | 51.1% | 30.4% | 50.7% |
| Delta | 7.2% | 0.1% | 1.0% | 5.9% | 0.2% | 6.0% | 1.9% | 0.6% | 0.4% |
| Significant? | No | No | No | No | No | No | No | No | No |
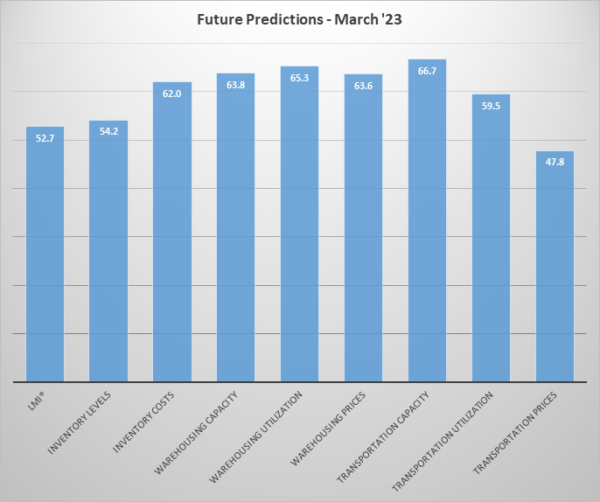
Respondents were asked to predict movement in the overall LMI and individual metrics 12 months from now. The future predictions for March are similar to what we saw in February, but slightly more pessimistic in their outlook. Similar to last month, respondents expect that inventories will continue building, but at a modest rate. They also anticipate Warehousing Capacity continuing to open up, believing that Warehousing Prices and Utilization will come down with it. Average Warehousing Price growth was 84.5 in 2021 and 80.3 in 2022. If the rate of growth truly comes in at 63.6 in 2023, it would be a marked shift – providing relief to warehousing tenants and consumers. At the same time, Transportation Prices are predicted to continue contracting over the next 12 months, as respondents grow increasingly pessimistic about an increase in volume.
Unlike what we observed with the present Upstream (green bars)/Downstream (purple bars) split, there are some differences in expectations for future change depending on the supply chain position of our respondents[23]. Respondent expectations differ significantly for Warehousing Capacity, with Upstream firms anticipating much more looseness in the market, leading to marginally lower rates of Warehousing Utilization. Despite expectations across the board of relatively soft Transportation Capacity and Prices, Downstream firms expect a marginally higher rate of Transportation Utilization. This may be indicative of the quicker turnover that happens at the retail level as B2C firms attempt to move back towards the JIT practices that require more frequent use of transportation.
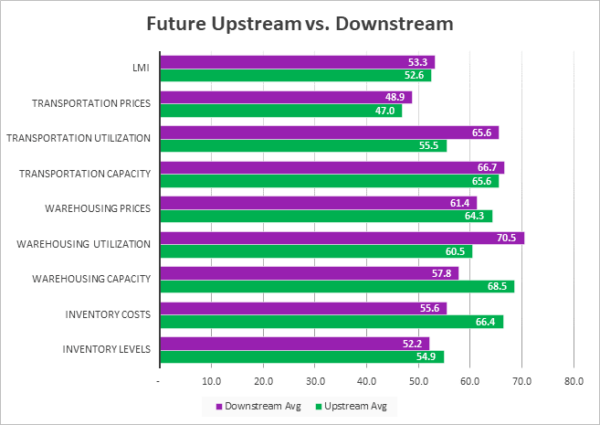
| Futures | Inv. Lev. | Inv. Costs | WH Cap. | WH Util. | WH Price | Trans Cap. | Trans Util. | Trans Price | LMI |
| Upstream | 54.9 | 66.4 | 68.5 | 60.5 | 64.3 | 65.6 | 55.5 | 47.0 | 52.6 |
| Downstream | 52.2 | 55.6 | 57.8 | 70.5 | 61.4 | 66.7 | 65.6 | 48.9 | 53.3 |
| Delta | 2.7 | 10.8 | 10.8 | 10.0 | 2.9 | 1.0 | 10.1 | 1.9 | 0.7 |
| Significant? | No | Marginal | Yes | Marginal | Yes | No | Marginal | No | No |
Historic Logistics Managers’ Index Scores
This period along with prior readings from the last two years of the LMI is presented table below:
| Month | LMI | Average for last 3 readings – 54.5
All-time Average – 64.3 High – 76.2 Low – 51.1 Std. Dev – 7.3
|
| Mar ‘23 | 51.1 | |
| Feb ‘23 | 54.7 | |
| Jan ‘23 | 57.6 | |
| Dec ‘22 | 54.6 | |
| Nov ‘22 | 53.6 | |
| Oct ‘22 | 57.5 | |
| Sep ‘22 | 61.4 | |
| Aug ‘22 | 59.7 | |
| July ‘22 | 60.7 | |
| June ‘22 | 65.0 | |
| May ‘22 | 67.1 | |
| Apr ‘22 | 69.7 | |
| Mar ‘22 | 76.2 | |
| Feb ‘22 | 75.2 | |
| Jan ‘22 | 71.9 | |
| Dec ‘21 | 70.1 | |
| Nov ‘21 | 73.4 | |
| Oct ‘21 | 72.6 | |
| Sep ‘21 | 72.2 | |
| Aug ‘21 | 73.8 | |
| July ‘21 | 74.5 | |
| June ‘21 | 75.0 | |
| May ‘21 | 71.3 | |
| Apr ‘21 | 74.5 | |
| Mar ‘21 | 72.2 |
LMI®
The overall LMI fell for a second consecutive month in March down (-3.6) to a reading of 51.1, from February’s reading of 54.7. March of 2022 saw the highest-ever reading in the history of the overall index at 76.2. March of 2023 stands in sharp contrast to that, as the reading of 51.1 is the lowest ever reading – a 25.1-point drop. This drop continues to be propelled by shifts in Transportation Prices, which also registered their lower-ever reading in March 2023. For the moment, the LMI is still in very slight expansionary territory and is being propped up by strong growth in Warehousing Prices and Inventory Costs. Although as mentioned above, those metrics will likely soften if an additional influx of inventory and demand does not happen in the next few months.
Respondents expect this feeble rate of growth to continue over the next 12 months, predicting an expansion rate of 52.7, down (-4.0) from February’s prediction of 56.7. The all-time average for the overall index is 64.3 (pre-COVID average was 61.9). If these predictions are accurate, the doldrums the industry is currently in could be continuing throughout 2023.
Inventory Levels
The Inventory Level value is 55.6, down (-6.8) from February’s reading of 62.4., almost identical (+0.1) to January’s reading of 62.5. This is 20.1 points lower than the same time last year, and down 5.9 from two years ago. The index value is very close to where it was in November, which was the lowest point in the past two years. Retailers continue to add inventory faster than others, as Downstream respondents reported greater inventory growth by 7.2 pts, (58.9 vs 51.7). This is an extension of the trends from last month when Downstream respondents reported slightly greater inventory growth by 0.9 pts, (63.8 vs 62.9).
When asked to predict what conditions will be like 12 months from now, the average value is 54.2, down slightly from last month’s 55.7. Upstream respondents returned a higher average (54.9 vs 52.2). Looking at the graph, the trendline is predicting a steep reduction in the index value, but respondents are predicting the value a year from now to be the same as the current value. The Federal Reserve has signaled that it intends to slow interest rate increases, and companies seem to expect business as usual over the next year. One might expect that if companies were actively planning for a recession, responses would reflect a net decrease in inventory levels.
Inventory Costs
The current Inventory Costs index value reads in at 66.0, down (-3.9) from February’s reading of 70.9. In a sign of how things have changed in the last year, this is down by 25.0 points from last March, when this metric hit its all-time high of 91.0. This is the first reading below 70.0 – which we consider to be a “significant” rate of expansion – since September 2020. As noted above, a significant portion of ongoing inflation stems from supply costs. As this continues to reduce, it is likely that firms and consumers will continue to see some relief from inflation. The rate of growth is steady across the supply chain with Downstream respondents reporting slightly higher inventory cost numbers by 1.1 points, (65.9 vs 65.8).
Above, we saw that respondents expect inventory levels to increase slightly over the next 12 months (54.2). It is not surprising that inventory costs are expected to grow significantly (62.0) over the next 12 months, down (-3.9) from February’s future prediction of 65.9. Upstream respondents (66.4) expect greater inventory cost increases than Downstream respondents (55.6).
Warehousing Capacity
The warehouse capacity index registered at 58.2 in March of 2023 which is up (+1.6 point) from February’s reading of 56.6. This marks two straight months of expansion following 2.5 years of contraction. It is a rather dramatic increase of over 22.1 points from the reading one year ago and is up 14.9 points from the reading two years ago. Clearly, there is growth in the capacity of the warehousing space, and this might forebode potential economic slowdowns ahead. It appears as though the system is not at balance where the deviation between the upstream and downstream is 10.8 percentage points apart, and the difference is statistically significant. As is seen below, despite the increased capacity, prices continue to grow – this is likely reflective of the long-term contracts that are often used in the Warehousing sector. It will be interesting to observe if continued capacity growth eventually drags prices down, and what the lag on that might be.
Looking forward to the next 12 months, respondents continue to expect available Warehousing Capacity to grow at a rate of 63.8, which is up slightly (+2.4) from February’s future prediction of 61.4. This is expected to be a significantly faster expansion for Upstream (68.5) than Downstream (57.8) firms. Similar to what we see with Transportation Utilization rates, this may foreshadow some optimism regarding consumer spending.
Warehousing Utilization
As one would expect given increased capacity, Warehousing Utilization came in at 65.0, which is down (-5.3) from February’s reading of 70.3. This is down 5.9 points from the reading one year ago, and down 7.1 points from the reading in March 2021. This decreasing rate of growth breaks the trend of the previous 4 months of increasing growth in this metric. When taken with Warehousing Capacity, continued growth in Warehousing Utilization suggest that even as new space comes online, it is being utilized. This may also reflect the continued growth in prices, and firms’ attempt to maximize the utilization of high-cost storage space. Growth is distributed across the supply chain, with a 5.9-point difference between Upstream capacity (61.9) and Downstream capacity (67.8).
Looking forward to the next 12 months, the predicted Warehousing Utilization index is 65.3, down (-2.3) from February’s future prediction of 67.6 but still indicative of growth. Downstream firms are expecting a significantly higher (70.5 to 60.5) rate of expansion than their Upstream counterparts, but both still anticipate growth, suggesting that firms will be waiting to snap up whatever additional capacity does come online fairly quickly in 2023.
Warehousing Prices
The Warehousing Price index reads in at 70.9, down (-2.4) from February’s reading of 73.3. This is down 19.6 points from the all-time high recorded in March of 2023. As we noted with Warehousing Utilization, there is still growth here, but at a steadily declining rate. This is likely reflective of the increase in available capacity finally providing relief to both long- and short-term contracts. It is pointed out though that every reading above 70.0 is classified as a significant rate of expansion – a rate that is being felt both Upstream (70.6) and Downstream (70.5). It will be interesting to see whether the rate of change continues to decrease next month, and this metric dips below 70.0 for the first time since August 2020.
Future predictions suggest this may happen, as respondents are expecting prices to continue to grow at a rate of 63.6, down notedly (-7.1) from February’s future prediction of 70.4 and 10.1 points lower than what we saw in January. While this is still indicative of growth, the expected slowdown suggests that enough Warehousing Capacity will come online in 2023 to finally provide some relief to firms and consumers. Unlike what we observe in our other warehousing metrics, there is no noticeable split here between Upstream (64.3) and Downstream (64.1) predictions.
Transportation Capacity
The Transportation Capacity Index registered 71.4 percent in March 2023. This constitutes a modest increase (+1.0) from the February reading of 70.4. As such, the Transportation Capacity Index continues to remain elevated and near all-time highs. The Upstream Transportation Capacity index is slightly lower, indicating 68.5 while the Downstream index indicates 74.4. There are still elevated levels of growth across the supply chain, but it is more pronounced in the B2B sector. Whether this will shift as the number of TEUs coming in from China continues to increase remains to be seen.
The future Transportation Capacity Index continues to indicate expansion, registering 66.7, which is up (+3.8) from February’s future prediction of 62.9. Upstream firms indicate a future Transportation Capacity index of 65.6 while Downstream firms indicate a future expectation of 66.7. As such, it can be concluded that the expectations of continued Transportation Capacity expansion are relatively uniformly diffused across the supply chains.
Transportation Utilization
The Transportation Utilization Index registered 50.0 in March 2023, down (-1.9) from February’s reading of 51.9. With this decrease we are at the critical level of 50 that separates expansion and contraction, meaning that we essentially saw no change from last month. There was some growth in the Downstream Transportation Utilization Index is at 51.1, while the upstream index is slightly lower at 49.2. However, this is not a significant difference, meaning our data indicates that there is very little change in the current Transportation Utilization rates, and this relative stability is spread rather evenly across the supply chain.
The future Transportation Utilization Index reads in at 59.5, which is down significantly (-8.6) from February’s future prediction of 68.1, possibly reflecting the growing pessimism noted above. The expectations of future growth are diffused across the supply chain, with Downstream firms expecting slightly greater expansion rates (65.6) than Upstream firms (55.5).

Transportation Prices
The Transportation Prices Index reads 31.1 in March 2023, down (-5.0) from February’s reading of 36.1. With this drop, the Transaction Prices Index established a brand new all-time low. This is 58.6 points lower than what we saw a year ago, and down 59.5 points from the heady days of March 2021. After over two years of growth, there have now been nine months of contraction. We were always expecting a correction to come after the runaway growth of 2020-2021, but that expectation does not make the reality less severe. Unlike what we have seen in past months, this is distributed fairly evenly across the supply chain. The Upstream Price index is set at 31.1 and the Downstream Transportation Price index reads in at 30.4.
The future index for Transportation Prices reads in at 47.8, down (-2.2) from February’s future prediction of 50.0 and back into contraction territory. These expectations are significantly greater for Downstream firms (61.5) than Upstream firms (44.4). This suggests that Downstream firms anticipate some bounce-back at the consumer level, while Upstream firms may be more pessimistic. It will be interesting to observe whether this split holds, and we return to dynamics similar to what we saw in 2019 (although even then the split wasn’t quite this severe).
About This Report
The data presented herein are obtained from a survey of logistics supply executives based on information they have collected within their respective organizations. LMI® makes no representation, other than that stated within this release, regarding the individual company data collection procedures. The data should be compared to all other economic data sources when used in decision-making.
Data and Method of Presentation
Data for the Logistics Manager’s Index is collected in a monthly survey of leading logistics professionals. The respondents are CSCMP members working at the director level or above. Upper-level managers are preferable as they are more likely to have macro-level information on trends in Inventory, Warehousing and Transportation trends within their firm. Data is also collected from subscribers to both DC Velocity and Supply Chain Quarterly as well. Respondents hail from firms working on all six continents, with the majority of them working at firms with annual revenues over a billion dollars. The industries represented in this respondent pool include but are not limited to Apparel, Automotive, Consumer Goods, Electronics, Food & Drug, Home Furnishings, Logistics, Shipping & Transportation, and Warehousing.
Respondents are asked to identify the monthly change across each of the eight metrics collected in this survey (Inventory Levels, Inventory Costs, Warehousing Capacity, Warehousing Utilization, Warehousing Prices, Transportation Capacity, Transportation Utilization, and Transportation Prices). In addition, they also forecast future trends for each metric ranging over the next 12 months. The raw data is then analyzed using a diffusion index. Diffusion Indexes measure how widely something is diffused or spread across a group. The Bureau of Labor Statistics has been using a diffusion index for the Current Employment Statics program since 1974, and the Institute for Supply Management (ISM) has been using a diffusion index to compute the Purchasing Managers Index since 1948. The ISM Index of New Orders is considered a Leading Economic Indicator.
We compute the Diffusion Index as follows:
PD = Percentage of respondents saying the category is Declining,
PU = Percentage of respondents saying the category is Unchanged,
PI = Percentage of respondents saying the category is Increasing,
Diffusion Index = 0.0 * PD + 0.5 * PU + 1.0 * PI
For example, if 25 says the category is declining, 38 says it is unchanged, and 37 says it is increasing, we would calculate an index value of 0*0.25 + 0.5*0.38 + 1.0*0.37 = 0 + 0.19 + 0.37 = 0.56, and the index is increasing overall. For an index value above 0.5 indicates the category is increasing, a value below 0.5 indicates it is decreasing, and a value of 0.5 means the category is unchanged. When a full year’s worth of data has been collected, adjustments will be made for seasonal factors as well.


