Growth is INCREASING AT AN INCREASING RATE for Inventory Costs, Warehousing Utilization, Warehousing Prices, Transportation Utilization, and Transportation Prices.
Growth is INCREASING AT A DECREASING RATE for Inventory Levels Warehousing Capacity and Transportation Capacity are CONTRACTING.
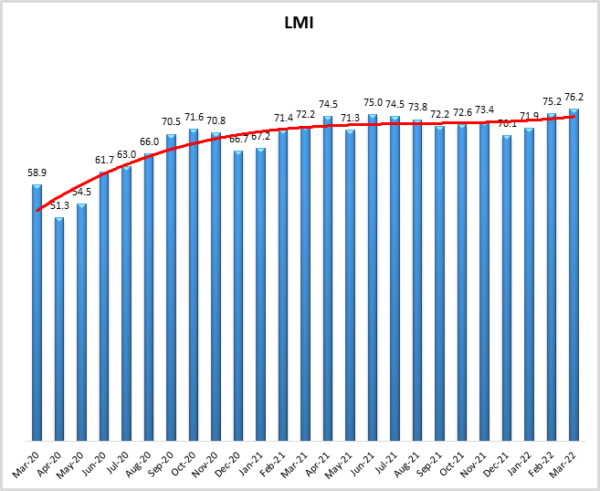
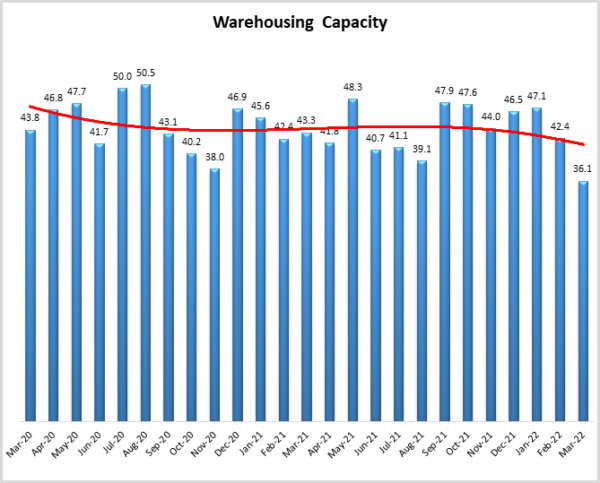
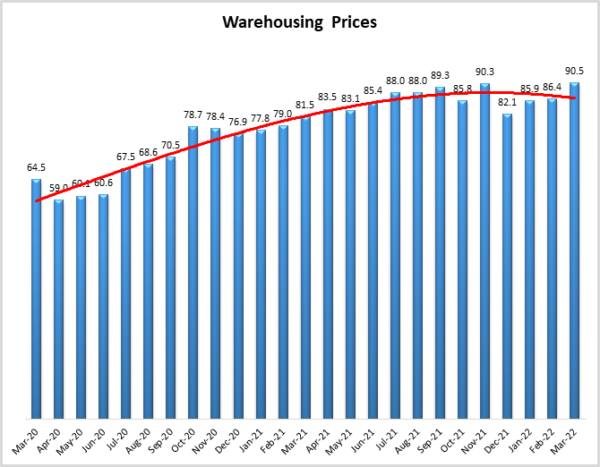
March’s overall LMI reading of 76.2 is the highest in the history of the index, up (+1.0) from February’s reading of 75.2. The average over the first quarter of 2022 was 74.5, well above the all-time average of 65.2. The first three months of 2022 have been marked by high levels of inventory, and insufficient capacity to deal with it. This trend started at the end of 2021 when inventories increased by 2.4% in December 2021 – an all-time month-to-month record. This was driven particularly by downstream retailers, who saw inventories up by 4.5% in December, handily outgaining manufacturers and wholesalers[1] (U.S. Census Bureau, 2022). This influx, combined with a cool-down in consumer demand due to the move away from goods and back towards services with easing COVID restrictions, as well as price pressure due to burgeoning inflation, has left firms with more inventory than they know what to do with. Because of this, both Inventory Costs (91.0) and Warehousing Prices (90.5) reached all-time high levels in March. Warehousing Capacity also hit a record in March, reaching an all-time nadir of 36.1 this month. Transportation Prices remain high and Transportation Capacity is still contracting this month. However, it is important to note that in the Upstream portion of our respondent base we saw some loosening in the transportation market, with readings taken after March 15th averaging out to a 55.0 – indicating expansion for the first time in 18 months. Again, this positive reading was only for one piece of the data during a snapshot in time; but it could portend a coming shift in transportation as the impact of record diesel prices is more keenly felt throughout the supply chain. A contraction in the transportation market does not necessarily mean a freight recession is imminent – although that is a possibility. This could also mean that we are finally seeing a move away from the unsustainable supply/demand mismatch we have seen over the past 18 months and moving back towards a more viable market equilibrium. While we do observe signs of supply chains turning a corner, only time will tell what is on the other side.
Researchers at Arizona State University, Colorado State University, Rochester Institute of Technology, Rutgers University, and the University of Nevada, Reno, and in conjunction with the Council of Supply Chain Management Professionals (CSCMP) issued this report today.
Results Overview
The LMI score is a combination of eight unique components that make up the logistics industry, including inventory levels and costs, warehousing capacity, utilization, and prices, and transportation capacity, utilization, and prices. The LMI is calculated using a diffusion index, in which any reading above 50 percent indicates that logistics is expanding; a reading below 50 percent is indicative of a shrinking logistics industry. The latest results of the LMI summarize the responses of supply chain professionals collected in March 2022. Overall, the LMI is up (+1.0) from February’s reading of 75.2, reaching an all-time high of 76.2. The growth in this month’s index is fueled by metrics from across the index. Continued inventory congestion has driven Inventory Costs, Warehousing Prices, and overall aggregate logistics costs to all-time high levels. This is putting even more pressure on already-constrained capacity. Warehousing Capacity hit an all-time low in March. Transportation Capacity was headed in that direction too from March 1st to March 15th but seems to have changed course slightly in the back half of the month due to the rapidly increasing cost of fuel.
In the last report, we remarked on the Russian invasion of Ukraine pushing diesel fuel prices up to $4.01 per gallon at the end of February, which was up $1.07 from 12 months prior. In the month since we’ve written that prices have increased even more than they did in those previous 12 months, with a gallon of diesel reaching an all-time high of $5.25 in mid-March before coming down to $5.185 per gallon at the end of the month[2]. The high price of fuel is being felt across the globe. Inflation in the U.S. was up 7.9% in February, the highest rate since the 8.4% experienced in January 1982. In mid-March, the national average for a gallon of regular gasoline surpassed $4 for the first time since 2008[3]. Similarly, we see prices in the Eurozone were up 7.5% from February to March (after a 5.9% jump in February). The high diesel prices will have an outsized effect on smaller fleets and independent operators. Smaller companies that have limited margins and cannot pay wholesale rates like larger firms will be particularly hard-hit by these costs. The high costs also make the imbalance of freight capacity we saw around Southern California ports relative to the rest of North America throughout 2021 more difficult to deal with. Deadhead loads are likely to increase by $2,000 – $3,000 per load given the high costs of fuel[4]. This will make it less attractive to drive empty trucks back to California, and could significantly impact the tender rejection rate. Some evidence of this already exists as tender volumes out of Ontario, California was down 6.5% in the last week of March[5]. Adding to the global supply chain upheaval are the ongoing COVID-related shutdowns happening across China, including in major economic hubs such as Shanghai, Shenzhen, and Suzhou. The Chinese PMI read in at 49.5 in March – registering economic contraction at a time when most of the economies around the world are growing[6].
The high costs of fuel may end up being the thing that finally slows down the runaway transportation market. The dramatic increase in fuel prices (diesel fuel is up approximately 44% in 2022) seem to have put a relative damper on the previously insatiable freight demand. Consumers had been willing to absorb some increase in costs through 2021. However, the rate of inflation through the first quarter of 2022 is at such a rapid pace, the stimulus money that buoyed spending last year is largely gone, and consumer spending has shifted increasingly away from goods and towards services. These very new, very recent tensions are evident in FreightWaves’ tender rejection index which is about half of what it was at this time last year, dropping to 13%. This means that where 1 out of every 4 loads was being rejected at this time last year, today it is closer to 1 out of 8. If the tender rejection rate holds here, it could mean that some breathing room is injected into what has been one of the tightest freight markets of all time. However, if rates continue to drop, it could foreshadow a run of closings similar to what we saw in 2019. FedEx (whose long-time CEO Fred Smith we would like to congratulate on an incredibly impactful career as he steps down soon) reported shipping 16.8 million parcels a day from December to February, down from the 17.6 million shipped per day in the preceding quarter[7]. Additionally, dry van spot rates are down from $3.83 per mile in early January to $3.34 in late March5. This is reflective of a counterintuitive phenomenon where high fuel prices can drive down demand to the point that shipping prices actually drop in some lanes.
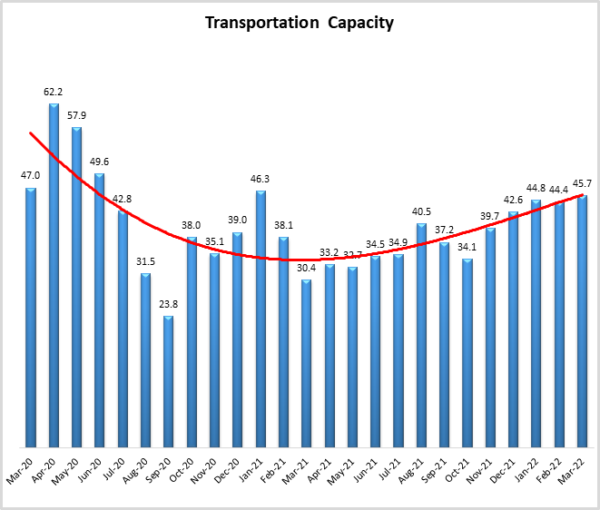
Whatever shift is coming to the freight market is not fully represented in this month’s readings. Transportation Capacity in March continued to contract, only up slightly (+1.2) to a level of 45.7. This marks 19 consecutive months, and 22 of the last 24, that available capacity has contracted. However, as we will discuss in detail below, Transportation Capacity did loosen up significantly in the second half of March – even expanding slightly for Upstream respondents. With fuel costs as high as they are it is no surprise that Transportation Utilization is up (+1.2) to 69.7 in March as firms attempt to fill every cubic inch available in each trailer. Finally, Transportation Prices were up very slightly (+0.7) to 89.7. Whereas both Inventory and Warehousing costs have never been higher, and 89.7 is still a staggering rate of growth, this would not be in the top half of scores over the last year. We observe a similar drop-off in Transportation Prices in the second half of March. The rate of growth for Upstream firms dropped by 10.0 points and was down 5.2 points for Downstream firms. There is certainly trepidation among freight analysts. Dow’s transportation index was down nearly 5% in the last week of March due to fears of a downturn. The vast majority of the drop came from road carriers like JB Hunt and Old Dominion, the six air carriers in the index faired relatively well[8]. On the international shipping side, Harper Index shipping container rates are still at “historic” levels but have plateaued in recent weeks[9], suggesting an international slowdown, or at least a stabilization, could be coming. That being said, the slowdown could potentially lead to the development of a backlog, which could restart portions of this cycle on the international side all over again. It will be fascinating to observe whether or not this points towards an actual softening of transportation in the months ahead.
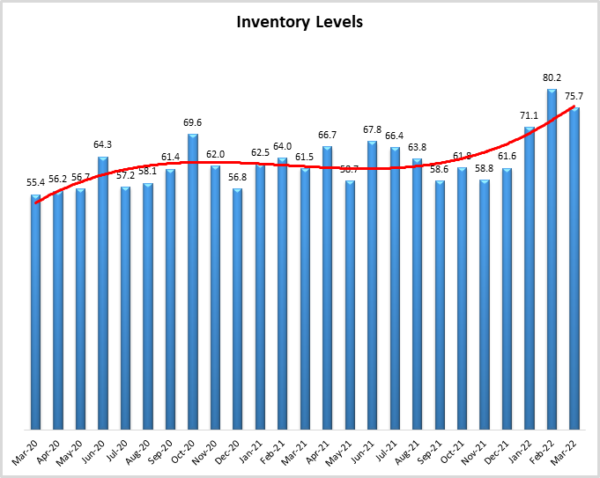
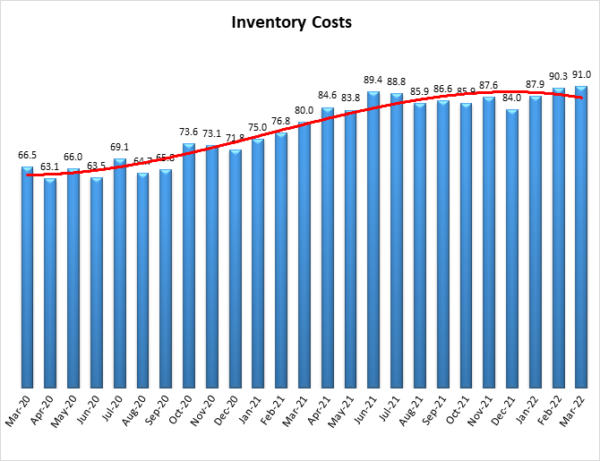
One piece of the economy that is not showing signs of a major shift in inventory. Inventory Levels continue to climb, although at a slightly lower rate (-4.5) at 75.7 relative to last month’s all-time high of 80.2. Many firms are having difficulties managing all of this inventory, and the excess downstream inventories are now flooding the shelves of off-price retailers like TJ Maxx, Ross, and Dollar General[10]. Adding to the already high levels of inventory on hand, some firms are attempting to pull holiday inventories ahead early in anticipation of the labor agreement between the ports and the West Coast dockworkers expiring on July 1st [11]. The most recent negotiation led to a significant slowdown at the ports in 2015. It is likely dock workers will attempt to extract significant concessions given the tumult ports have faced over the last year. Unsurprisingly, Inventory Costs are up (+0.7) to an all-time high of 91.0. There is little indication that this will change anytime soon, as future predictions for Inventory Costs are anticipated to remain very high throughout the next 12 months.
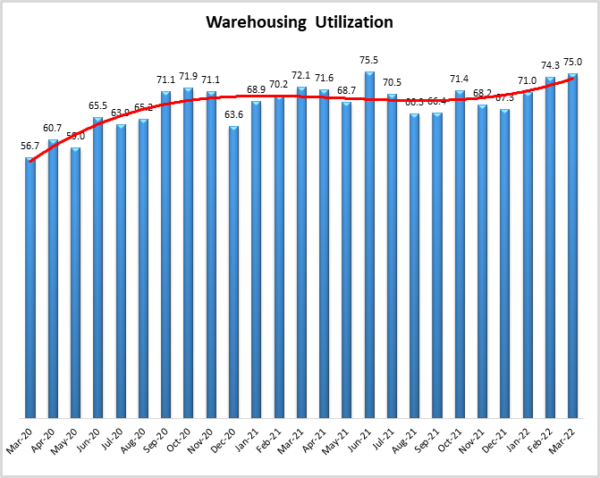
The high level of inventory in the system is having a significant impact on warehousing. Warehousing Capacity is down (-6.3) to 36.1, the lowest reading in the history of the index. Unlike what we’re seeing with transportation, there is no movement towards a softening of capacity or price in the warehousing market. Demand for space seems likely to stay high in the near future, and commodity shortages and international shipping congestion will continue to make it difficult to ramp up production. JLL Construction timelines for warehousing buildouts are currently around two years – up from the traditional lead time of nine months pre-pandemic. Demand for industrial space in the U.S. is up by 24% since 2010. Unfortunately, the supply of industrial space is only up 18% over the same period. Beyond the need for more eCommerce warehouses that are closer to consumers, 75% of existing industrial space is 20 years old or older, and a quarter is 50 years or older, leaving a significant volume of warehouses that need to be refreshed (if not replaced)[12]. Until this new capacity comes online, it is likely that we will continue to see Warehousing Utilization increase as it did this month, up (+0.7) to 75.0. This is indicative of the continuing robustness of the warehouse market, which has been expanding and adding jobs at a rapid pace. Warehousing Prices are the other
We are in a complex and unsure time economically. The U.S. added 431,000 jobs in March, bringing the number of new positions to 1.7 million through the first quarter of 2022. The current rate of unemployment is 3.8%. This growth came even with hundreds of thousands of additional workers joining the labor force[13] (Cambon, 2022). While more people working is always positive, the continued growth is likely adding to inflationary pressures being felt throughout the economy. These dueling pressures add complexities to the Fed’s stated goal of cooling off inflation while not having a negative impact on employment[14]. While the high number of jobs added in March was encouraging to the overall economy, the transportation sector actually lost 4,900 jobs – the first decline since April 2020. These numbers should be taken with a grain of salt as both January and February numbers were adjusted upwards, and overall there are 56,000 more truck transportation jobs than at this time a year ago. At the same time, seasonally adjusted warehousing jobs were up 4,300, and adjustments to the January and February numbers mean that over 30,000 warehouse positions have been added in 2022 – with average wages around $22.85 per hour[15]. A final thought on logistics employment, the unionization of Amazon warehouse workers in New York is a fascinating situation. On one hand, this could portend higher wages, increasing costs going forward. On the other hand, higher wages may help firms to navigate the labor shortages they have been dealing with over the last year. It will be interesting to note if the unionization of Amazon is a canary in the coal mine, signaling increased labor activism and unionization going forward, or if it will prove to be the exception rather than the rule[16].
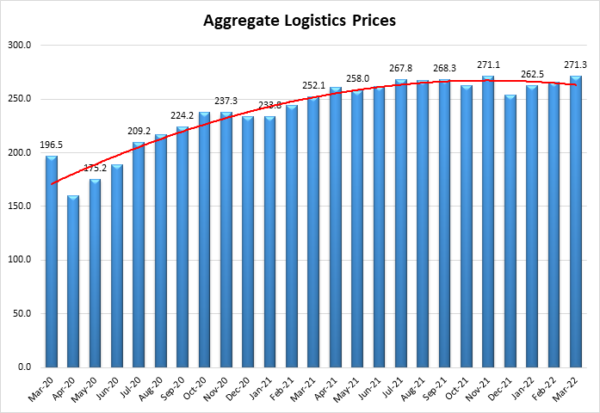
While the future direction of the logistics industry and the overall economy is still speculative, what is known is that right now costs are incredibly high. Aggregate Logistics Prices, which are a combined measure of Inventory, Warehousing, and Transportation Costs read in at 271.3 in March – beating the all-time high score of 271.1 set in November of 2021. The drivers of the high aggregated costs have changed in the four intervening months. The November surge was led by staggering Transportation Prices that read in at 93.2. In March of 2022, Transportation is actually growing at the slowest rate of our three costs, with both Inventory (91.0) and Warehousing (90.5) setting all-time index records with their staggering rates of change.
The impact of these high costs is being felt in metrics such as FreightWaves’ tender rejection index, and the decrease in dry van per-mile costs measured by TruckStop.com[17]. However, a few metrics cannot paint the whole picture. To fully understand the nuanced way in which logistics costs are impacting supply chains, we break the March metrics apart on two levels, by Upstream and Downstream respondents, and by responses recorded in “early” (3/1-3/15) and “late” (3/16-3/31) March. The green bars represent early Upstream responses, purple are late Upstream, gray are early Downstream, and blue are late Downstream. There is clearly some movement in the market firms were facing in early March, relative to what they found in late March as inflation – particularly around fuel prices – began to have a greater impact on the overall economy. To better understand what this impact was, we ran a series of t-tests to determine whether or not the differences were statistically significant.
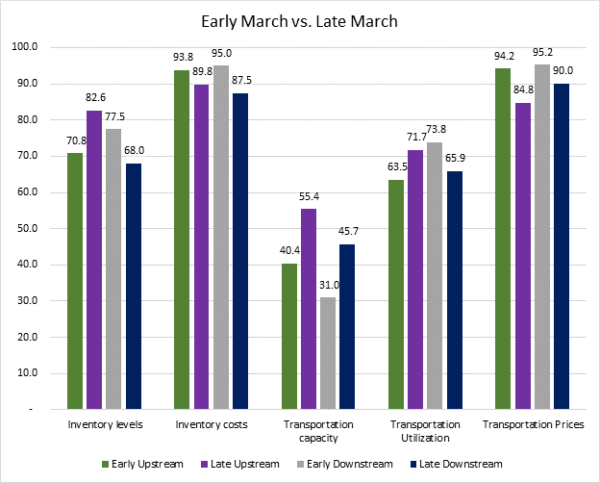
The difference between Upstream Inventory Level growth from early to late March is marginally significant. At the same time, Transportation Costs grew marginally slower in later March, due to the highly significant difference in available Transportation Capacity Upstream in late March. The movement from 40.4, a very solid rate of contraction, to 55.4, a marginal rate of expansion, likely left some carriers with a feeling of whiplash as what had been a year-long historically tight freight market began to melt away in a matter of weeks. We also see a significant difference in available Downstream Transportation Capacity (moving 14.7 points from 31.0 to 45.7), but interestingly capacity is still contracting – just not at the same rate. The fact that this metric could move 15 points and still be in a state of contraction speaks to just how hot downstream transportation has been. Contraction upstream and growth downstream would be similar to what we saw during the freight recession from 2018-19. The difference is that in 2022, we are starting from a much stronger position, which could buffer some of the effects. The lack of capacity, which was so damaging in 2021, could actually relieve some of the potential pain in 2022. Finally, it should be noted that a greater proportion of the goods that are purchased will be through eCommerce platforms which use up more logistics capacity than traditional sales. Even if consumer spending on goods does decrease or plateau (it was up a seasonally-adjusted 0.2% in February – likely an artifact of inflation and the shift back towards services/entertainment as lockdowns subside), there will still be a high demand for downstream warehousing and transportation. It is impossible to know for sure whether or not we will see the freight “blood bath” that some are predicting. What we do know is that the wild growth of the last 18 months could never have been sustainable long-run and that eventually, supply chains would hit an inflection point. The question now is whether this inflection will merely balance out supply and demand, helping companies to catch their breath, or plunge the economy into a recession. Based on the data that is available now, we would lean towards the former over the latter. However, only time will tell for sure.
The index scores for each of the eight components of the Logistics Managers’ Index, as well as the overall index score, are presented in the table below. Six of the eight metrics show signs of growth. The two capacity metrics continue to contract, although as discussed above, a loosening of Transportation Capacity in future reports has suddenly become more probable. Warehousing Capacity actually contracted by 6.3 points demonstrating the continued issues supply chains will likely have storing inventories. The logistics industry remains tight. Demand may be slowing but inventories are still very high. It will be interesting to see how these counteracting pressures influence the industry throughout the rest of 2022.
| LOGISTICS AT A GLANCE | |||||
| Index | March 2022 Index | February 2022 Index | Month-Over-Month Change | Projected Direction | Rate of Change |
| LMI® | 76.2 | 75.2 | +1.0 | Growing | Increasing |
| Inventory Levels | 75.7 | 80.2 | -4.5 | Growing | Decreasing |
| Inventory Costs | 91.0 | 90.3 | +0.7 | Growing | Increasing |
| Warehousing Capacity | 36.1 | 42.4 | -6.3 | Contracting | Decreasing |
| Warehousing Utilization | 75.0 | 74.3 | +0.7 | Growing | Increasing |
| Warehousing Prices | 90.5 | 86.4 | +4.2 | Growing | Increasing |
| Transportation Capacity | 45.7 | 44.4 | +1.2 | Contracting | Increasing |
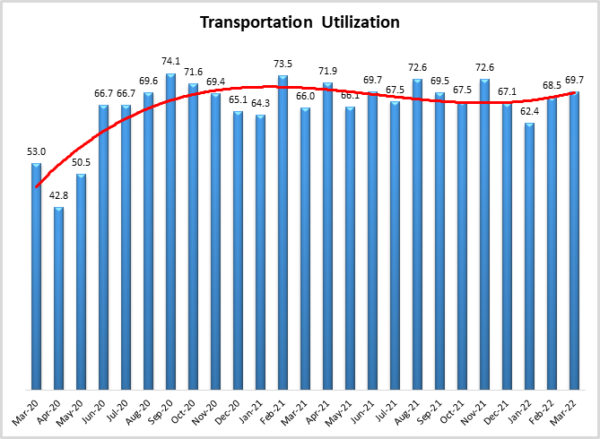
| Transportation Utilization | 69.7 | 68.5 | +1.2 | Growing | Decreasing |
| Transportation Prices | 89.7 | 89.0 | +0.8 | Growing | Increasing |
This month, both upstream (blue bars) and downstream (orange bars) firms reported considerable rates of continued growth in the utilization of logistics services. Upstream firms reported a neutral rate of change in Transportation Capacity, while Downstream firms continued to see contraction.
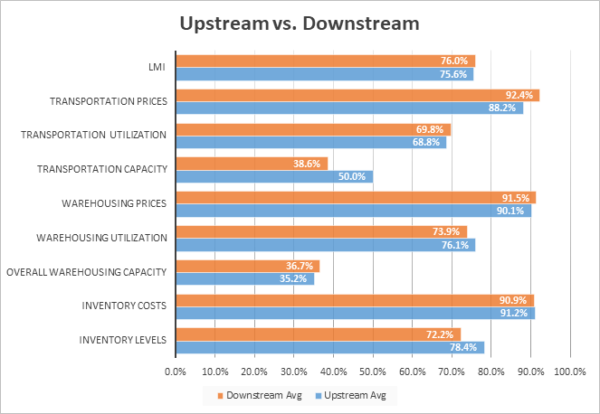
Inventories are high throughout the supply chain and the warehousing market remains as tight as ever. The primary difference we see is in Transportation. Available Transportation Capacity has contracted for 21 consecutive months, and the movement towards neutrality or potentially growth was inevitable. It will be interesting to observe if Downstream capacity follows what we’re seeing Upstream, or if the differences in the two markets will limit the change we see at the retail level.
| Inv. Lev. | Inv. Costs | WH Cap. | WH Util. | WH Price | Trans Cap | Trans Util. | Trans Price | LMI | |
| Upstream | 78.4 | 91.2 | 35.2 | 76.1 | 90.1 | 50.0 | 68.8 | 88.2 | 75.6 |
| Downstream | 72.2 | 90.9 | 36.7 | 73.9 | 91.5 | 38.6 | 69.8 | 92.4 | 76.0 |
| Delta | 6.1 | 0.3 | 1.5 | 2.2 | 1.3 | 11.4 | 1.0 | 4.2 | 0.4 |
| Significant? | No | No | No | No | No | Yes | No | No | No |
Respondents were asked to predict movement in the overall LMI and individual metrics 12 months from now. Their predictions for future ratings are presented below. For the next year, respondents predict a growth rate of 70.2, very consistent with February’s prediction of 69.9, and January’s future prediction of 70.7. While this would portend significant levels of growth throughout 2022 – comfortably above the all-time average of 65.0 – it would be lower than the 74.5 average we have observed through Q1. Firms expect Inventory Levels to continue increasing at a rate above 70, leading to what would be astronomical growth in Inventory Costs and Warehousing Prices as supply chains struggle to manage so much inventory. Interestingly, Transportation Price growth is the lowest of the three price metrics, reading in at 78.6. This might reflect a more cautionary tone being struck due to the high costs of fuel and worries that inflation may slow down parts of the economy. Although interestingly they are not predicting the significant increase in available Transportation Capacity that would come with this shift. It will be interesting to observe how these movements shake out over the next 12 months.
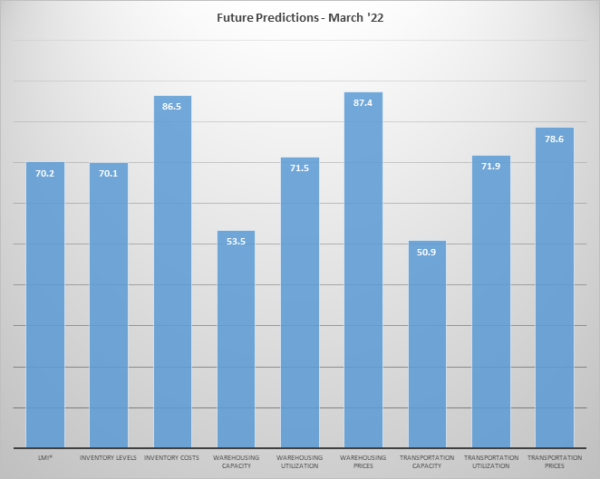
The exact nature of the future predictions varies by supply chain position. This month we see that most clearly in the predictions for future Transportation Capacity, Warehousing Prices, and the overall LMI.
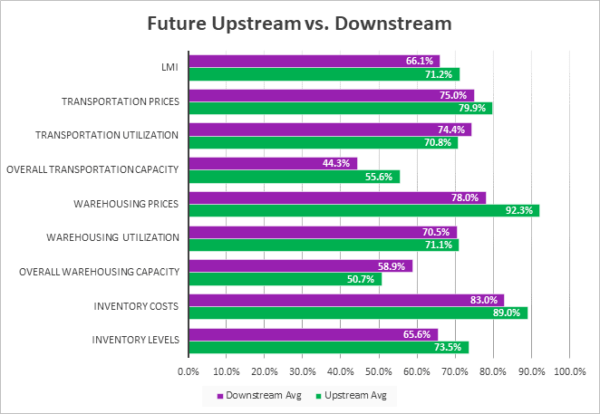
In March 2022 we detected significant differences between Upstream and Downstream predictions for two of the eight components of the LMI, as well as for the overall index. Similar to the current day comparisons, Downstream firms are more bearish on available Transportation Capacity, likely reflecting the demands placed upon them by the growth of ecommerce. Conversely, Upstream firms are predicting significantly higher (+14.2) Warehousing Prices Growth as they struggle to hold the growing levels of inventory that firms across all levels of the supply chain are predicting in 2022. While both Upstream and Downstream respondents predict growth this year, it is interesting to note that the rate of growth predicted is significantly higher for Upstream firms than for Downstream counterparts.
| Futures | Inv. Lev. | Inv. Costs | WH Cap. | WH Util. | WH Price | Trans Cap. | Trans Util. | Trans Price | LMI |
| Upstream | 73.5% | 89.0% | 50.7% | 71.1% | 92.3% | 55.6% | 70.8% | 79.9% | 71.2% |
| Downstream | 65.6% | 83.0% | 58.9% | 70.5% | 78.0% | 44.3% | 74.4% | 75.0% | 66.1% |
| Delta | 8.0% | 6.0% | 8.2% | 0.7% | 14.2% | 11.2% | 3.6% | 4.9% | 5.1% |
| Significant? | No | No | No | No | Yes | Yes | No | No | Yes |
Historic Logistics Managers’ Index Scores
This period along with prior readings from the last two years of the LMI is presented table below. The values have been updated to reflect the method for calculating the overall LMI:
| Month | LMI | Average for last 3 readings – 74.5
All-time Average – 65.2 High – 76.2 Low – 51.3 Std. Dev – 7.27
|
| Mar ‘22 | 76.2 | |
| Feb ‘22 | 75.2 | |
| Jan ‘22 | 71.9 | |
| Dec ‘21 | 70.1 | |
| Nov ‘21 | 73.4 | |
| Oct ‘21 | 72.6 | |
| Sep ‘21 | 72.2 | |
| Aug ‘21 | 73.8 | |
| July ‘21 | 74.5 | |
| June ‘21 | 75.0 | |
| May ‘21 | 71.3 | |
| Apr ‘21 | 74.5 | |
| Mar ‘21 | 72.2 | |
| Feb ‘21 | 71.4 | |
| Jan ‘21 | 67.2 | |
| Dec ‘20 | 66.7 | |
| Nov ‘20 | 70.8 | |
| Oct ‘20 | 71.6 | |
| Sep ‘20 | 70.5 | |
| Aug ‘20 | 66.0 | |
| July ‘20 | 63.0 | |
| June ‘20 | 61.7 | |
| May ‘20 | 54.5 | |
| Apr ‘20 | 51.3 | |
| Mar ‘20 | 58.9 |
LMI®
The overall LMI read in at 76.2 in March, up (+1.0) from February’s reading of 75.2. This is the all-time high score in the history of this index, continuing a run of 14 consecutive months of readings over 70.0, a level that we consider a significant rate of expansion. The average overall index reading through the first quarter of 2022 was 74.5, far outstripping the historical average level of 65. The primary factors behind this are the all-time high rates of growth for both Inventory and Warehousing Costs, which are in turn being driven up by unseasonably high Inventory Levels.
Respondents are not necessarily predicting any significant relief over the next 12 months, but they are hopeful for a slight decrease in the rate of growth. In March 2022 they predict a growth rate of 70.2, relatively consistent with February’s prediction of 69.9 and January’s future prediction of 70.7. It will be interesting to observe whether the remarkably consistent future predictions we have seen through Q1 will be challenged in April as the effects of any freight slowdown related to inflation become clearer.
Inventory Levels
The Inventory Level value is 75.7. This is down (-4.5) from February’s reading of 80.2 – but is still the second-highest in the history of the index. This value is 14.1 higher than the same time last year and 20.3 points higher than two years ago and well above the all-time average value of 61.9. Upstream respondents reported greater inventory growth by 6.1 pts (78.4 vs 72.2) as goods continue to trickle into the U.S. but are finding less consumer interest than anticipated. One explanation for this is that the continued fears about inflation may have led firms to build inventories as a hedge against higher future costs. It is possible that recent supply chain challenges may have taught manufacturers, suppliers, retailers, and customers that holding inventory provides an important element of safety in uncertain times.
When asked to predict what conditions will be like 12 months from now, the average value is 70.1, down (-4.2) from February’s future prediction of 74.3.
Inventory Costs
The current Inventory Costs index value of 91.0 is an all-time record for the index, up (+0.7) from the previous record of 90.3 which was just set last month. Given the near-record high Inventory Levels index value, it is not surprising that Inventory Costs have also set a record. The value is up 11.0 points from the value last year, up 24.5 points compared to two years ago at the start of the pandemic, and 16.8 points higher than the all-time average of 74.2. The last two years exhibit a fairly simple growth pattern. The Inventory Costs index was stable in the mid-60s, until the fall of 2020, when the values began increasing, fairly steadily, until April of 2021, when the values reached the mid-80s, where they have remained, until breaking 90 in February.
When asked to predict what conditions will be like 12 months from now, the average value is 86.5 up (+3.0) from February’s future prediction of 83.5. Once again, Upstream respondents are more bullish (+6.0) than their Downstream counterparts (89.0 to 83.0), as they expect to hold a lot of inventory in the next year and pay a significant amount to do so.
Warehousing Capacity
Accentuating a previously steep decline, March 2022 resulted in a rather precipitous drop in available Warehousing Capacity as March’s rate of contraction came in lower (-6.3) than February’s already sharp decline of 42.4. This reading is down just over 7 points from the value from one year ago. Available Warehousing Capacity has been down every month since August of 2020, meaning it has become increasingly harder to find space in each of the last 19 months. Capacity is decreasing at an increasing rate and will continue to do so as long as inventories continue to increase. Shutdowns in China might slow some of this volume, but it is also possible that firms might over-order now to stay ahead of potential labor disputes at the ports.
Looking forward to the next 12 months, respondents remain fairly neutral on the prospect of meaningful change to capacity. The predicted Warehousing Capacity index is for February is 53.5, up (+1.5) from February’s future prediction of 51.8. While the prediction of adding a modicum of capacity steady is not incredibly optimistic, it would be at least some relief after the year and a half of contraction we have seen in this metric.
Warehousing Utilization
The Warehousing Utilization Index registered in at 75.0 in March 2022. This is up (+0.7) from February’s readings of 74.3, and marks four consecutive months in which the rate of growth has increased. Unsurprisingly, this increased reading coincides with the decreased capacity reading, as demand for warehousing has continued to grow considerably. The combination of seemingly unrelenting demand with decreased availability will likely drive up prices. For this pattern to be attenuated, significant capacity will need to come online, or consumer and industrial demand would have to drop rapidly. As can be seen in the future predictions below, the former option seems highly unlikely in the near future.
Looking forward to the next 12 months, the predicted Warehousing Utilization index is 71.5, which still predicts growth but it is down (-5.0) from February’s future prediction of 76.50. Even with the slight decline in predicted growth rate, respondents continue to expect to utilize increasingly greater amounts of available warehouse space throughout the year as supply struggles to keep up with demand.
Warehousing Prices
Just as Warehousing Capacity hit an all-time low, Warehousing Prices reached an all-time high in March 2022, registering at 90.5, up (+4.1) from February’s reading of 86.4. This reading continues the trend in the (increasingly unrelenting) increased growth rate in Warehousing Prices and is 9.0 points higher than this time last year and 26.0 points up from two years ago as COVID lockdowns were just beginning in the U.S. Taken together with decreased capacity, and increased utilization rates, these market pressures are driving the rate of price increases considerably. Seemingly, demand for and utilization of warehousing space has not slowed nor do our forecasts indicate, that it will. The hit of softness that may be emerging in Transportation markets is nowhere to be found with Warehousing. It appears that now more likely than ever increased capacity is required to drive down pricing.
Future predictions suggest that respondents are expecting prices to continue to grow at a rate of 87.4, up (+3.9) from February’s already high future prediction of 83.5. Respondents are not optimistic about added Warehousing Capacity this year, and it is unsurprising that they also expect to be paying higher prices through the rest of 2022.
Transportation Capacity
The Transportation Utilization Index registered 69.7 percent in March 2022, up (+1.2) from February’s reading of 68.5. With this increase, the upward trend in the Transportation Utilization Index continues. Upstream Transportation Utilization Index is at 68.8, while the Downstream index is at 69.8. This indicates that the transportation activity continued to intensify across the supply chains in March.
The future Transportation Capacity Index is 50.9, down (-8.1) from February’s future prediction of 59.0. This suggests a rate of growth that is essentially neutral – not much capacity is predicted to come online, but we are not predicted to lose any either. The future Transportation Capacity metric will be the one we watch most closely in April, as it is likely to be among the first to demonstrate any concrete signs of softening in the freight market.
Transportation Utilization
The Transportation Utilization Index registered 69.7 percent in March 2022, up (+1.2) from February’s reading of 68.5. With this increase, the upward trend in the Transportation Utilization Index continues. Upstream Transportation Utilization Index is at 68.8, while the Downstream index is at 69.8. This indicates that the transportation activity continues to intensify across the supply chains, upstream and downstream.
The future Transportation Utilization Index indicates expectations of continued expansion, at a 71.9 level for the next 12 months. When taken as a whole, in March the expectations of increased Transportation Utilization are slightly stronger for Downstream firms, where the future index registers 74.4, while the Upstream transportation utilization index is 70.8. It should be noted that Downstream firms reported a significant drop in their future predictions for Transportation Utilization rates in the second half of March, dropping from a future prediction of 85.7 from 3/1-3/15 to a prediction of 63.6 from 3/16-3/31. Both of these would represent significant growth, but it is notable that Downstream predictions fell by 22.1 points in the back half of the month.
Transportation Prices
The Transportation Prices Index registered 89.7 percent in March 2022, up slightly (+0.7) from February’s reading of 89.0. Transportation Prices led the way for all LMI metrics for much of the last 18 months, so it is interesting that they read in lower than the two other cost/price metrics in the Index. As mentioned above, we saw a marginally significant decrease in Upstream Transportation Prices in the second half of the month, but it should still be noted that the price growth here is very robust. While some signs are pointing towards a receding of freight prices, as of March they have not yet fully materialized. With the rates of growth and overall price that we have seen over the last 18 months, decreasing Transportation Prices could offer some relief to businesses and consumers. The key is whether the potential drop in cost leads to relief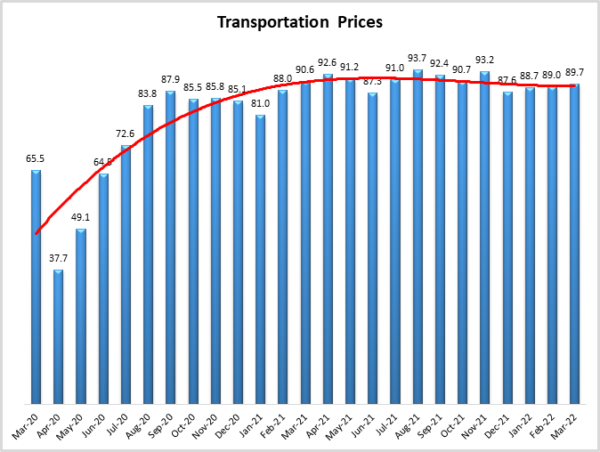 or an actual contraction. At this moment, price growth is still strong, so it is too early to know for sure.
The future index for Transportation Prices indicates a value of 78.6., which is down (-3.2) from February’s future prediction of 81.8. Expectations of continued Transportation Price increases for the next 12 months remain quite strong, with the future index well above the critical level of 50 that indicates expansion. The price increase expectations are slightly higher for Upstream firms (79.9) than for Downstream firms (75.0).
About This Report
The data presented herein are obtained from a survey of logistics supply executives based on information they have collected within their respective organizations. LMI® makes no representation, other than that stated within this release, regarding the individual company data collection procedures. The data should be compared to all other economic data sources when used in decision-making.
Data and Method of Presentation
Data for the Logistics Manager’s Index is collected in a monthly survey of leading logistics professionals. The respondents are CSCMP members working at the director level or above. Upper-level managers are preferable as they are more likely to have macro-level information on trends in Inventory, Warehousing and Transportation trends within their firm. Data is also collected from subscribers to both DC Velocity and Supply Chain Quarterly as well. Respondents hail from firms working on all six continents, with the majority of them working at firms with annual revenues over a billion dollars. The industries represented in this respondent pool include, but are not limited to Apparel, Automotive, Consumer Goods, Electronics, Food & Drug, Home Furnishings, Logistics, Shipping & Transportation, and Warehousing.
Respondents are asked to identify the monthly change across each of the eight metrics collected in this survey (Inventory Levels, Inventory Costs, Warehousing Capacity, Warehousing Utilization, Warehousing Prices, Transportation Capacity, Transportation Utilization, and Transportation Prices). In addition, they also forecast future trends for each metric ranging over the next 12 months. The raw data is then analyzed using a diffusion index. Diffusion Indexes measure how widely something is diffused, or spread across a group. The Bureau of Labor Statistics has been using a diffusion index for the Current Employment Statics program since 1974, and the Institute for Supply Management (ISM) has been using a diffusion index to compute the Purchasing Managers Index since 1948. The ISM Index of New Orders is considered a Leading Economic Indicator.
We compute the Diffusion Index as follows:
PD = Percentage of respondents saying the category is Declining,
PU = Percentage of respondents saying the category is Unchanged,
PI = Percentage of respondents saying the category is Increasing,
Diffusion Index = 0.0 * PD + 0.5 * PU + 1.0 * PI
For example, if 25 say the category is declining, 38 say it is unchanged, and 37 say it is increasing, we would calculate an index value of 0*0.25 + 0.5*0.38 + 1.0*0.37 = 0 + 0.19 + 0.37 = 0.56, and the index is increasing overall. An index value above 0.5 indicates the category is increasing, a value below 0.5 indicates it is decreasing, and a value of 0.5 means the category is unchanged. When a full year’s worth of data has been collected, adjustments will be made for seasonal factors as well.


