-
Growth is INCREASING AT AN INCREASING RATE for Inventory Levels, Inventory Costs, Warehousing Utilization, Warehousing Prices, Transportation Capacity, and Transportation Utilization
-
Warehousing Capacity and Transportation Prices are CONTRACTING.
The Logistics Managers’ Index reads in at 57.6 in January, up (3.0) from December’s reading of 54.6. This marks the second consecutive increase in the overall index. Back-to-back rates of growth are notable as they come after a run of seven of eight months of declining growth. The one exception to the decreases we have seen since last Spring was September of 2022. That reprieve was driven primarily by the transfer of overstocked inventories from Upstream wholesalers and distributors to Downstream retailers preparing for Q4 demand. January’s growth rate is different in that 1) There have been two increases in a row, suggesting a trend; 2) Unlike September, supply chains are not so flush with inventory that they are merely shifting goods around. Inventories are much lower now than they were in Q3 of last year, and it seems the supply chains are coming back to life with the goal of replenishment.
Once again warehousing metrics are the primary driver of logistic activity. Warehousing Capacity is declining for the 3oth consecutive month, driving up both utilization and price. This is partially due to an increase in Inventory Levels and Inventory Costs – which may be evidence that firms are finally beginning to restock after nine months of doing everything in their power to reduce inventories. The transportation metrics remain down from where they were from late 2020 to early 2022, but we do see some encouraging signs. Chief among those is Transportation Utilization, which is back up to expanding at a rate of 57.0 after its one-month foray into contraction territory. Transportation Prices have continued to decline, but at a slower rate than over the last few months. There is still excess Transportation Capacity in the market, but respondent future predictions and anecdotal evidence from carriers suggest that increased demand may begin soaking up some of this excess soon.
Researchers at Arizona State University, Colorado State University, Rochester Institute of Technology, Rutgers University, and the University of Nevada, Reno, and in conjunction with the Council of Supply Chain Management Professionals (CSCMP) issued this report today.
Results Overview
The LMI score is a combination of eight unique components that make up the logistics industry, including inventory levels and costs, warehousing capacity, utilization, and prices, and transportation capacity, utilization, and prices. The LMI is calculated using a diffusion index, in which any reading above 50.0 indicates that logistics is expanding; a reading below 50.0 is indicative of a shrinking logistics industry. The latest results of the LMI summarize the responses of supply chain professionals collected in January 2023.
The big U.S. economic news in January was the 517,000 jobs that were added. This came as a surprise to some given the high-profile rounds of layoffs occurring at places like Microsoft and FedEx. The losses in tech were more than made up for by gains in other areas – including the transportation and warehousing sectors which added 23,000 workers in January[1]. There is of course some concern as to how this could impact the actions of the Fed. The Federal Reserve increased the interest rate by a quarter point on the first day of February. This reduced rate hike is due to the slowdown observed in inflation rates over the last few months. The Fed anticipates making a similar increase next month. The Fed hinted that by slowing down the pace of rate increases they will give the economy time to catch up to the corrections they have already attempted to install, thereby avoiding the dreaded overcorrection. Much of the decrease in inflation is due to falling prices in products like food, energy, and housing all of which be particularly impactful to consumers[2]. This would be a welcome sign as consumer retail spending decreased in three of the last four months. This is exacerbated in industries dependent on financings such as housing and autos[3]. Seasonally adjusted spending was down 0.2% in December. This is due partially to a decrease in prices due to slowing rates of inflation as well as the trends towards spreading holiday spending out over the entire Fall as opposed to being all centralized in late December. Despite this slowdown, the overall U.S. economy grew at a rate of 2.9% in the fourth quarter of 2022 and unemployment continues to hover around 3.5% which is near the 50-year low[4]. While global inflation may continue to be a muted issue in 2023, experts are predicting that the abnormal inflation growth will have faded by 2024[5].
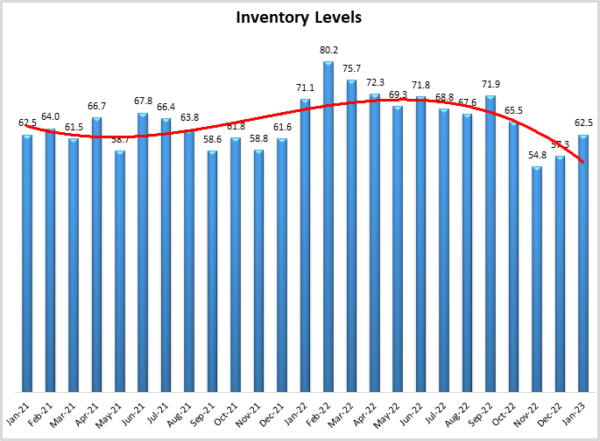
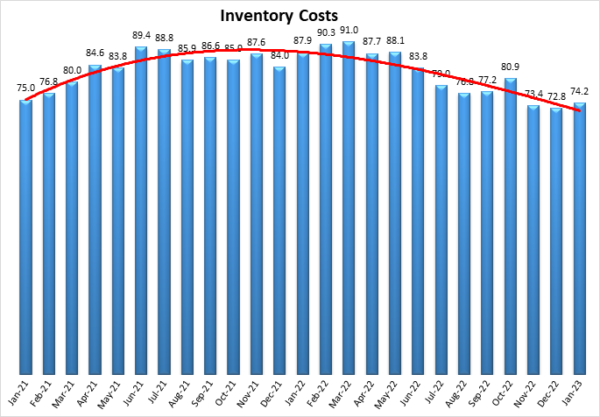
As noted in last month’s report, firms were finally able to run down inventories over the holiday season. We see evidence in January’s numbers that they are now working to replenish them, with Inventory Levels up (+5.2) to 62.5. Last year inventories were peaking in February and March due to port congestion, we would anticipate that this will not be the case this year, as the lack of backlog at the ports combined with shorter order times might lead back to something resembling “normal” seasonality. Traditional seasonality has been upended since COVID lockdowns began three years ago. If 2023 is the return to normal that many in the industry are anticipating, we would expect to see inventories continue to climb slowly, peaking sometime in Q3. It will be fascinating to observe their change over time. Whatever the case with inventory replenishment may be, we do observe the cost of holding goods continues to climb. In January Inventory Costs were up (+1.4) to 74.2, marking 28 consecutive months of costs growing at accelerated rates in the ’70s, 80s, or ’90s. One of the factors that have been limiting the ability to fully rebuild inventories was the stop-start nature of Chinese manufacturing due to their prior zero-COVID policy. However, China’s economy surged back to life in January as the pullback of COVID restrictions led to an increase in manufacturing and consumer spending. China’s reawakening is one of the primary factors behind the IMF’s revised projection of 2.9% growth in the global economy in 2023. In another sign that the upstream economy is revving back to life, the PMI’s manufacturing activity index moved back into expansion at 50.1 in January (up from 47.0 in December)[6].
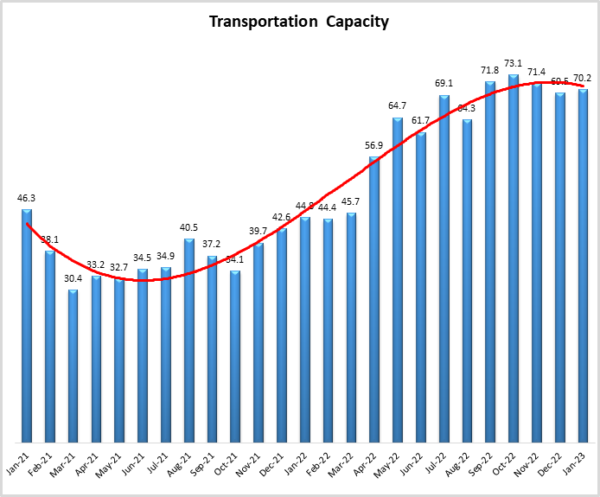
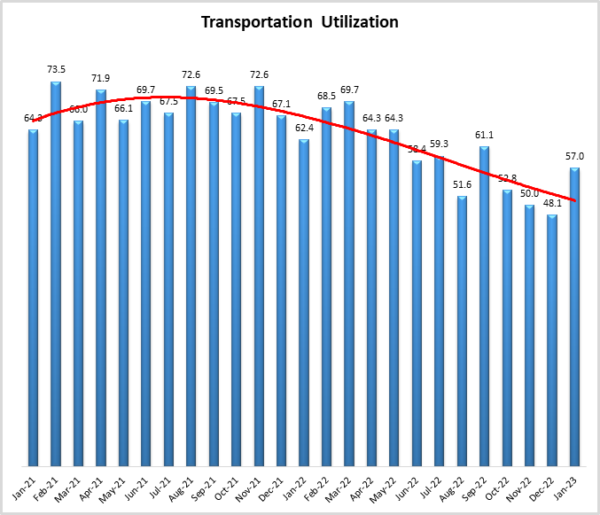
The rebuilding of inventories may be a boon for the still-slow transportation sector. Transportation Capacity continues to rise (+0.7) at a rate of 70.2. JB Hunt expects freight demand to pick back up sometime in Q2 as shippers begin to rebuild inventories after a year of winding them down[7]. This sentiment was echoed by Knight-Swift, who told investors in late January that their customer base had indicated a return to normal demand by Spring[8]. This optimism is reflected in the demand for class 8 trucks, which has been “unprecedented” according to David Carson who is a senior vice president of sales at Daimler Trucks North America. This demand is due to both optimism regarding consumer demand as well as a need to renew fleets that could not be upgraded during COVID[9]. Relatedly, we observe a significant jump in Transportation Utilization rates, which are up (+8.9) to 57.0 in January. This metric contracted in December for the first time since the start of the pandemic, and we wondered whether it would be a sign of things to come or a short-term blip. It is still too early to say for sure, but based on movements in the metric and the anecdotal evidence discussed above, it seems most likely that it is the latter, and the utilization will continue to grow.
Increased utilization would be welcome news for carriers, who have seen Transportation Prices contract for seven consecutive months. However, for the first time since March of last year, the reading for Transportation Prices came in higher (+5.1) than the month before with January’s metric reading in at 42.0. This slowing in the rate of contraction was driven by the latter half of January where the metric read in at 43.9 as opposed to early January’s 39.8. The transportation market has been tough for carriers since the Russian invasion of Ukraine cut fuel supplies and sparked a run of inflation that hurt consumer spending. If prices were to begin expanding again it would not only provide relief for carriers but also provide evidence that the overall economy could be headed toward a “soft landing”. As always, the cost of fuel will be a factor here. U.S. diesel prices have hovered between $4.52-$.62 per gallon in January, stabilizing at over a dollar below the rates observed in the Summer of 2022. Despite this supply continues to be an issue, particularly on the East Coast[10]. Overall there seems to be a belief that easing will continue to be an overarching trend as prices decreased in both whole and futures markets in late January[11].
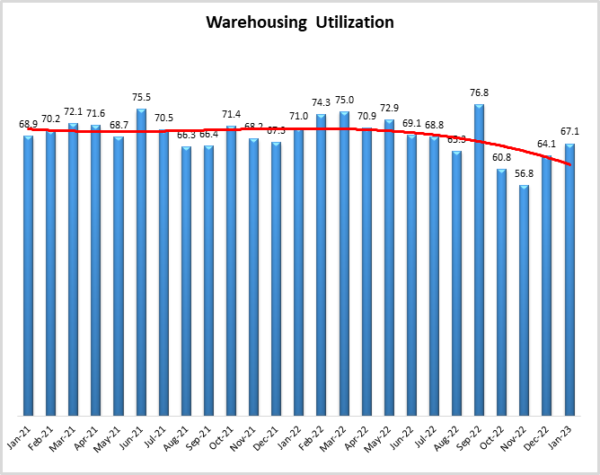
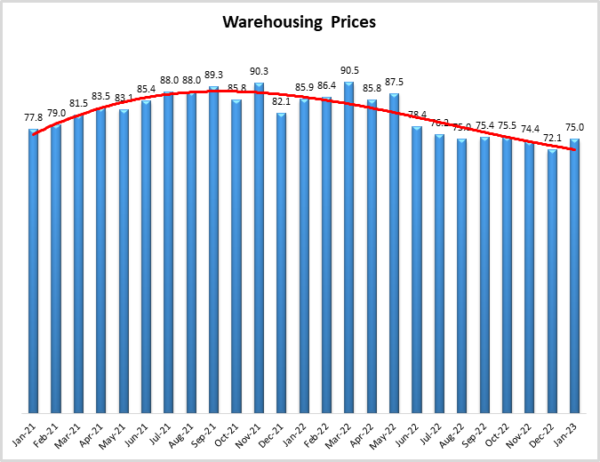
One limiting factor on any potential restocking of inventories is the continued tightness in the warehousing sector. Warehousing Capacity contracted at a slightly slower rate (+1.7) than in December, reading in at 46.4. This marks the 30th consecutive month of contraction, the longest run of contraction that we have observed for any of our metrics during the 6.5 years of the LMI. There are some signs that this run could be nearing its end, as Warehousing Capacity actually increased in the second half of January. Whether this is indicative of a shift in the market, or a temporary diversion before firms begin restocking is unclear. Interestingly, there is some anecdotal evidence supporting both hypotheses. Cushman & Wakefield reported that the amount of industrial space leased in the fourth quarter was only 132 million square feet, down 28.2% from Q3[12]. This reflects what we see in our metrics, growth that remains strong, but not as robust as the explosion observed over the past 18 months. On the other hand, Prologis expects continued strength in the warehousing sector. They told shareholders in January that average occupancy was 98% in the fourth quarter of 2022 and is expected to remain between 96.5-97.0% through 2023[13]. It will be interesting to see whether or not the warehousing industry is able to have a softer landing than its counterparts in transportation. What is clear however is that Warehousing Utilization continues to grow and is up (3.0) to 67.1 in January. As would be expected with capacity contracting and utilization continuing to increase, Warehousing Prices expanded (+2.9) in January at a rate of 75.0.
We saw something interesting shifts in the market as January went on. In the reverse of what we saw in December, available Warehousing Capacity increased, moving from a significant contraction (40.7) to a very minimal level of expansion (51.5). If the growth rate we saw in the second half of January were to continue on through February, it would mark the first time in a full two and half years that this metric showed signs of expansion. It will be interesting to observe whether this is a sign of capacity finally loosening up in the warehousing sector, or if this is merely a momentary few weeks of calm before firms begin to rebuild their inventories for 2023. A data point in favor of the latter hypothesis is that Transportation was up (+8.7) marginally in the second half of January. As we will see below, this increase was primarily driven by Downstream firms who may be increased activity in an attempt to replenish inventories post-holiday.
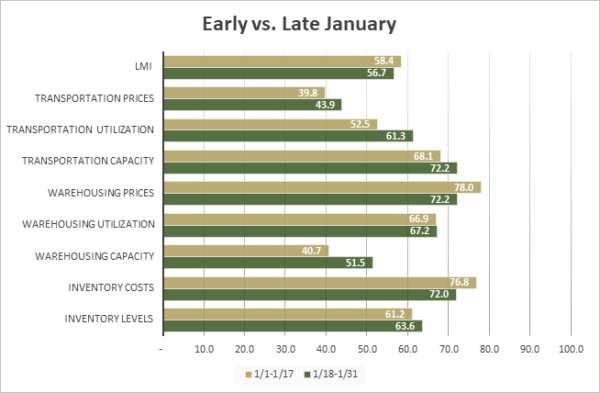
| Inv. Lev. | Inv. Costs | WH Cap. | WH Util. | WH Price | Trans Cap | Trans Util. | Trans Price | LMI | |
| January 1-17 | 61.2 | 76.8 | 40.7 | 66.9 | 78.0 | 68.1 | 52.5 | 39.8 | 58.4 |
| January 18-31 | 63.6 | 72.0 | 51.5 | 67.2 | 72.2 | 72.2 | 61.3 | 43.9 | 56.7 |
| Delta | 2.4 | 4.8 | 10.8 | 0.2 | 5.7 | 4.1 | 8.7 | 4.1 | 1.7 |
| Significant? | No | No | Yes | No | No | No | Marginal | No | No |
The index scores for each of the eight components of the Logistics Managers’ Index, as well as the overall index score, are presented in the table below. Transportation Utilization is back to expansion after a one-month foray into contraction, meaning that once again six of the eight metrics show signs of growth. Warehousing Capacity has now tightened for 30 consecutive months. Transportation Prices are down for the seventh consecutive month, but the rate of contraction has slowed by 5.1 points since hitting their nadir in December.
| LOGISTICS AT A GLANCE | |||||
| Index | January 2023 Index | December 2022 Index | Month-Over-Month Change | Projected Direction | Rate of Change |
| LMI® | 57.6 | 54.6 | +3.0 | Growing | Faster |
| Inventory Levels | 62.5 | 57.3 | +5.2 | Growing | Faster |
| Inventory Costs | 74.2 | 72.8 | +1.4 | Growing | Slower |
| Warehousing Capacity | 46.4 | 44.7 | +1.7 | Contracting | Slower |
| Warehousing Utilization | 67.1 | 64.1 | +3.0 | Growing | Faster |
| Warehousing Prices | 75.0 | 72.1 | +2.9 | Growing | Slower |
| Transportation Capacity | 70.2 | 69.5 | +0.7 | Growing | Faster |
| Transportation Utilization | 57.0 | 48.1 | +8.9 | Growing | From Contracting |
| Transportation Prices | 42.0 | 36.9 | +5.1 | Contracting | Slower |
Just as we saw in December, Downstream firms (orange bars) reported significantly greater rates of positive change for Transportation Utilization in January than their Upstream counterparts. Downstream respondents reported a significant Transportation Utilization rate of 64.3, while Upstream firms actually saw a very slight level of contraction at 49.1. This may be representative of the continued slowness in imports as firms struggle with shutdowns in China and are only gradually rebuilding inventories after winding them down over the holidays.
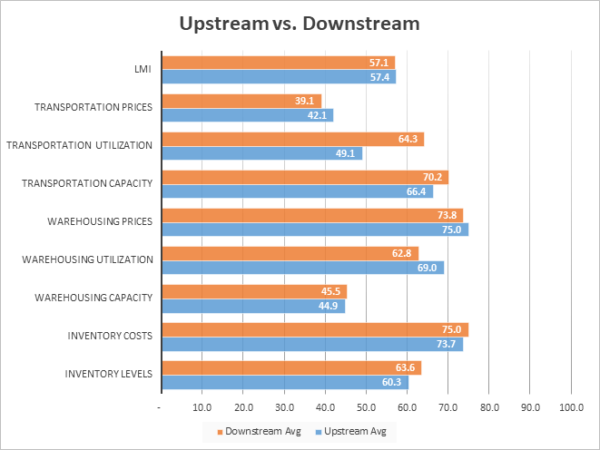
| Inv. Lev. | Inv. Costs | WH Cap. | WH Util. | WH Price | Trans Cap | Trans Util. | Trans Price | LMI | |
| Upstream | 60.3 | 73.7 | 44.9 | 69.0 | 75.0 | 66.4 | 49.1 | 42.1 | 57.4 |
| Downstream | 63.6 | 75.0 | 45.5 | 62.8 | 73.8 | 70.2 | 64.3 | 39.1 | 57.1 |
| Delta | 3.3 | 1.3 | 0.5 | 6.2 | 1.2 | 3.9 | 15.1 | 3.0 | 0.3 |
| Significant? | No | No | No | No | No | No | Yes | No | No |
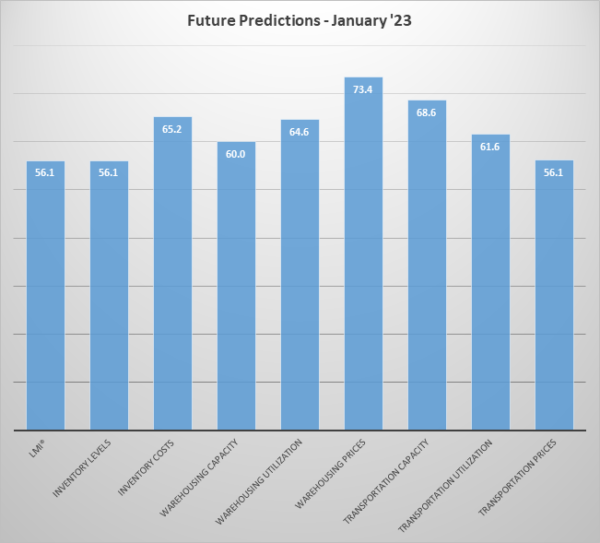
Respondents were asked to predict movement in the overall LMI and individual metrics 12 months from now. The future predictions for January are largely more popular than those from December. This is particularly true for the transportation metrics, with Transportation Utilization up 10 points and Transportation Prices up 9.6 points from December’s predictions. With all of the predictions ranging from 56.1-73.4, this is a continuation of the trend that was first observed in November that things will be “returning to normal” for the logistics industry. We classify readings in the 40s, 50s, or 60s as “normal” rates of change. The readings of the individual metrics and the reading of 56.1 for the overall index suggest that after the wild swings seen from 2020-2022, the logistics industry may be moving back towards slower, more sustainable growth.
Interestingly, we observed a significant difference in future predictions when split by supply chain position[14]. Significant differences were apparent for both Warehousing Utilization and Warehousing Price. In each instance, Upstream respondents reported expectations of greater rates of growth in the coming year. Related to this, Upstream firms are also anticipating higher Inventory Costs – likely stemming from a tight warehousing market. This is likely indicative of the manufacturing and B2B operations revving back up. Firms are expecting supply chains to get moving again to replenish inventories. Upstream inventories and storage would be a leading indicator for this as they sit further up the supply chain. While the differences are not all significant, Upstream firms are anticipating greater rates of expansion across seven of the eight metrics, leading to a significantly greater expectation of expansion in the overall index. This is a reversal of what we have seen over the last few months in which Downstream retailers expected mild growth and Upstream firms expected contraction. In January Downstream retailers still expect mild growth, but Upstream respondents are anticipating big increases, lending credence to the idea discussed above that the economy is generating some forward momentum.
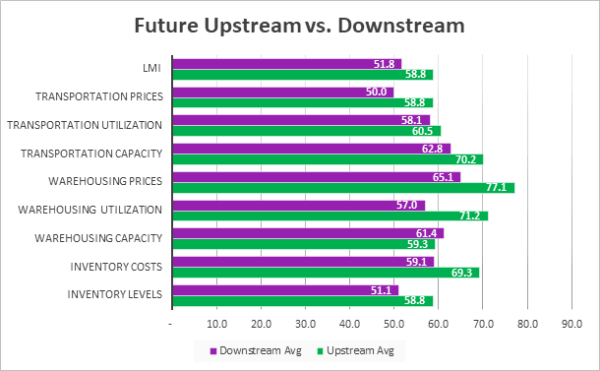
| Futures | Inv. Lev. | Inv. Costs | WH Cap. | WH Util. | WH Price | Trans Cap. | Trans Util. | Trans Price | LMI |
| Upstream | 58.8 | 69.3 | 59.3 | 71.2 | 77.1 | 70.2 | 60.5 | 58.8 | 58.8 |
| Downstream | 51.1 | 59.1 | 61.4 | 57.0 | 65.1 | 62.8 | 58.1 | 50.0 | 51.8 |
| Delta | 7.6 | 10.2 | 2.0 | 14.2 | 12.0 | 7.4 | 2.4 | 8.8 | 7.1 |
| Significant? | No | Marginal | No | Yes | Yes | No | No | No | Yes |
Historic Logistics Managers’ Index Scores
This period along with prior readings from the last two years of the LMI is presented table below:
| Month | LMI | Average for last 3 readings – 55.3
All-time Average – 64.5 High – 76.2 Low – 51.3 Std. Dev – 7.1
|
| Jan ‘23 | 57.6 | |
| Dec ‘22 | 54.6 | |
| Nov ‘22 | 53.6 | |
| Oct ‘22 | 57.5 | |
| Sep ‘22 | 61.4 | |
| Aug ‘22 | 59.7 | |
| July ‘22 | 60.7 | |
| June ‘22 | 65.0 | |
| May ‘22 | 67.1 | |
| Apr ‘22 | 69.7 | |
| Mar ‘22 | 76.2 | |
| Feb ‘22 | 75.2 | |
| Jan ‘22 | 71.9 | |
| Dec ‘21 | 70.1 | |
| Nov ‘21 | 73.4 | |
| Oct ‘21 | 72.6 | |
| Sep ‘21 | 72.2 | |
| Aug ‘21 | 73.8 | |
| July ‘21 | 74.5 | |
| June ‘21 | 75.0 | |
| May ‘21 | 71.3 | |
| Apr ‘21 | 74.5 | |
| Mar ‘21 | 72.2 | |
| Feb ‘21 | 71.4 | |
| Jan ‘21 | 67.2 |
LMI®
January’s overall Logistics Manager’s Index reads in at 57.6, up (+3.0) from December’s reading of 54.6. This is the second consecutive increase and marks the highest level in the overall index since September. The uptick in September was a temporary deviation from 2022’s long slide as firms shifted inventories around in anticipation of Q4. While that could be the case now, it seems less likely for two reasons: 1) There have been two increases in a row, suggesting a trend; 2) Unlike September, supply chains are not so flush with inventory that they are merely shifting goods around. Inventories are much lower now than they were in Q3 of last year, and it seems the supply chains are coming back to life with the goal of replenishment. The LMI currently sits at a modest rate of expansion but is below the all-time average of 64.5. If the transportation metrics do begin to show the 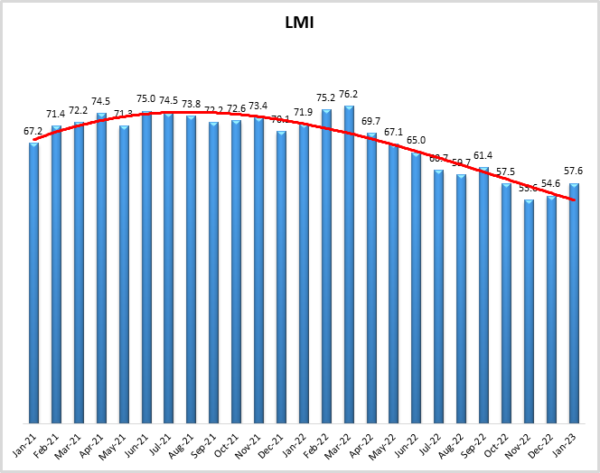 growth some are predicting, we may see the overall index move closer to this “normal” level of expansion.
That being said, respondents currently expect the expansion rate of the overall index to stay fairly consistent with where it is now, predicting a growth rate of 56.1, up (+2.9) from December’s future prediction of 53.2.
Inventory Levels
The Inventory Level value is 62.5, up (+5.2) from December’s reading of 57.3. The current value is 8.6 points lower than the same time last year, and exactly the same as two years ago. This means that seasonally speaking, inventories may be getting “back to normal” following the runaway growth we saw in 2022. This month, Downstream respondents reported greater inventory growth by 3.3 pts, (63.6 vs 60.3). This is a smaller delta than we saw in December when Downstream respondents reported greater inventory growth by 9.5 pts, (62.8 vs 53.3).
When asked to predict what conditions will be like 12 months from now, the average value is 56.1, up slightly from last month’s value (54.4) and a small decrease from the current actual value of 62.5. Upstream respondents returned a higher average (58.8 vs 51.1). The average predicted value for next year of 56.1. That being said, Upstream respondents are more likely to expect higher inventory levels in the next year, which might indicate that suppliers are more optimistic about the next year than retailers.
Inventory Costs
The current Inventory Costs index value reads in at 74.2, up (+1.4) from December’s reading of 72.8. represents slightly growing Inventory Cost levels. However, the rate of growth of inventory costs continues to decrease. The value is down 13.7 points from the value last year, and down 0.8 compared to two years ago; once again indicating that we are closer to “normal” seasonality, and further away from the inventory boom of 2022. For almost all of the last two years, the Inventory Cost numbers have been above the long-term average of 75.0. These levels above 50 indicate strong continued growth in inventory costs. However, as the graph shows, since reaching a peak in February of 2022, Inventory Cost values have had a strong, slow, downward trend. This month, downstream respondents reported slightly higher Inventory Costs by 1.3 points, (75.0 vs 73.7). It is not surprising that downstream inventory expenses grew more quickly, given that downstream inventories increased more quickly, as seen in the previous section.
Above, we saw that respondents expect inventory levels to increase slightly over the next 12 months. Consistent with this, there are expectations that Inventory Costs are expected to grow significantly (65.2) over the next 12 months. However, Upstream respondents (69.3) expect greater Inventory Cost increases than Downstream respondents (59.1). The expected future value of 65.2 is not far below the current index value of 74.2.
Warehousing Capacity
The Warehousing Capacity index registered at 46.4 for January 2023, up (+1.7) from December’s reading of 44.7. This metric has been incredibly consistent. This is less than one point decrease from the reading one year ago, and just over a one-point increase from the reading from January 2021. The readings over the last two years have ranged in a very tight (and very negative) range from 36.1-48.3. This reflects both the long-term tightness in the market, as well as the difficulties with getting warehousing capacity built quickly. Examining the difference between upstream and downstream capacity, the difference between the two was 7 points, but not statistically significant. When combined with the increase in capacity in the second half of the month, we may be seeing a move away from the contractionary territory.
Looking forward to the next 12 months, respondents continue to expect available Warehousing Capacity to grow at a rate of 60.0. This is essentially unchanged (+0.4) from December’s future prediction of 59.6. Given that this metric has contracted for the last 30 consecutive months, any growth in this section would come as a significant relief.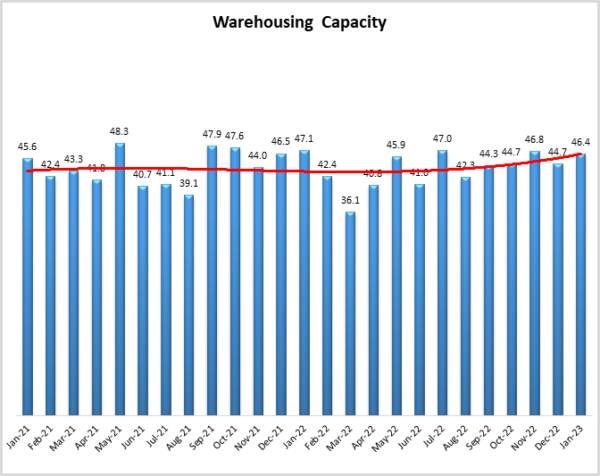
Warehousing Utilization
The Warehousing Utilization index registered at 67.1 for January 2023, up (+3.0) from December’s reading of 64.1. This is a 3.9-point decrease from the reading 1 year ago, and a 1.8-point decrease from the reading two years ago. There was a rather large 14.2-point spread between Upstream (71.2) and Downstream (57.0) respondents with upstream which was statistically significant. The utilization shift towards the Upstream could indicate that manufacturers are optimistic about the potential for future orders/sales, particularly as Transportation Prices come down. This is also noteworthy, as recent reports have indicated warehouse investment/construction has slowed. Examining data from future months will be a critical prognosticator as we move forward.
Looking forward to the next 12 months, the predicted Warehousing Utilization index is 64.6 which is exactly in line with December’s future prediction. 64.6. This suggests firms will be waiting to snap up whatever additional capacity does come online fairly quickly in 2023.
Warehousing Prices
The Warehousing Price index reads in at 75.0, up (+2.9) from December’s reading of 72.1. This represents over a 10-point decrease from the reading one year prior and is 2.8 points down from the reading two years ago. Taken together, while the values are increasing, it seems the pace at which these increases are manifesting is slightly slowing, which would be consistent with the notion that more capacity is coming online. In addition, there was a 12-point spread between Upstream (77.1) and Downstream (65.1) which was statistically significant. This is also consistent with the spread between utilization, indicating that the demand has shifted and so too has the cost.
Future predictions suggest that respondents are expecting prices to continue to grow at a rate of 73.4, up (+3.3) from December’s future prediction of 70.1. Although respondents are optimistic that the ongoing capacity crunch will ease in 2023, they still expect the cost of storage to grow at a significant rate.
Transportation Capacity
The Transportation Capacity Index registered 70.2 in January 2023, up marginally (+.07) from December’s reading of 69.5. As such, the Transportation Capacity Index continues to remain elevated and near all-time highs. The Upstream Transportation Capacity index is slightly lower, coming in at 66.4 while the Downstream index indicates 70.2. This suggests that activity may be picking up more quickly upstream, as Chinese factories spring back to life and manufacturers prepare for orders to eventually come in from Downstream.
The future Transportation Capacity Index continues to indicate expansion, registering 68.6. Upstream firms indicate a future transportation capacity index of 70.2 while downstream firms indicate a future expectation of 62.8. As such, it can be concluded that the expectations of continued Transportation Capacity expansion are diffused across the supply chains with upstream firms expecting slightly greater increases than downstream firms.
Transportation Utilization
The Transportation Utilization Index registered 57.0 in January 2023. This denotes a sharp increase (+8.9) from the 48.1 level registered in December. With this increase we are back above the critical level of 50 that separates expansion and contraction. Later submissions were even more positive, suggesting that the expansion trend may be accelerating. The Downstream Transportation Utilization Index is at 64.3, indicating expansion, while the Upstream index is significantly lower at 49.1, indicating slight contraction. As such, our data indicates that the downstream supply chain transportation continues to expand while upstream firms have significantly lower transportation utilization rates.
The future Transportation Utilization Index increases significantly and a 61.6 level for the next 12 months. The expectations of future growth are diffused rather evenly across the supply chain, with no significant differences between upstream and downstream firms.
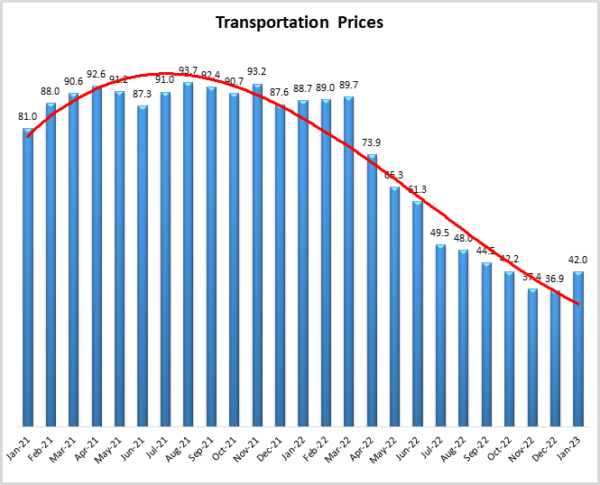
Transportation Prices
The Transportation Prices Index continued to contract but at a slower rate (+5.1) in January, up from 36.9 in December 2022. Despite this increase, the Transportation Prices Index remains in contraction territory, below 50, and near two-year lows. There are no significant differences in Transportation Prices across the supply chain, with the Upstream price index at 42.1 and the Downstream transportation price index at 39.1. Similar to the previous month, the reported price drops were a little more pronounced at the beginning of the month than towards the end of the month, suggesting that perhaps price decrease pressures are continuing to ease.
The future index for Transportation Prices is now above the critical 50.0 level, registering 56.1, and indicating expectations of increasing transportation prices in the next 12 months. These expectations are diffused across the supply chain, with no significant differences between Upstream and Downstream firms.
About This Report
The data presented herein are obtained from a survey of logistics supply executives based on information they have collected within their respective organizations. LMI® makes no representation, other than that stated within this release, regarding the individual company data collection procedures. The data should be compared to all other economic data sources when used in decision-making.
Data and Method of Presentation
Data for the Logistics Manager’s Index is collected in a monthly survey of leading logistics professionals. The respondents are CSCMP members working at the director level or above. Upper-level managers are preferable as they are more likely to have macro-level information on trends in Inventory, Warehousing, and Transportation trends within their firm. Data is also collected from subscribers to both DC Velocity and Supply Chain Quarterly as well. Respondents hail from firms working on all six continents, with the majority of them working at firms with annual revenues over a billion dollars. The industries represented in this respondent pool include, but are not limited to Apparel, Automotive, Consumer Goods, Electronics, Food & Drug, Home Furnishings, Logistics, Shipping & Transportation, and Warehousing.
Respondents are asked to identify the monthly change across each of the eight metrics collected in this survey (Inventory Levels, Inventory Costs, Warehousing Capacity, Warehousing Utilization, Warehousing Prices, Transportation Capacity, Transportation Utilization, and Transportation Prices). In addition, they also forecast future trends for each metric ranging over the next 12 months. The raw data is then analyzed using a diffusion index. Diffusion Indexes measure how widely something is diffused or spread across a group. The Bureau of Labor Statistics has been using a diffusion index for the Current Employment Statics program since 1974, and the Institute for Supply Management (ISM) has been using a diffusion index to compute the Purchasing Managers Index since 1948. The ISM Index of New Orders is considered a Leading Economic Indicator.
We compute the Diffusion Index as follows:
PD = Percentage of respondents saying the category is Declining,
PU = Percentage of respondents saying the category is Unchanged,
PI = Percentage of respondents saying the category is Increasing,
Diffusion Index = 0.0 * PD + 0.5 * PU + 1.0 * PI
For example, if 25 says the category is declining, 38 says it is unchanged, and 37 says it is increasing, we would calculate an index value of 0*0.25 + 0.5*0.38 + 1.0*0.37 = 0 + 0.19 + 0.37 = 0.56, and the index is increasing overall. For an index value above 0.5 indicates the category is increasing, a value below 0.5 indicates it is decreasing, and a value of 0.5 means the category is unchanged. When a full year’s worth of data has been collected, adjustments will be made for seasonal factors as well.


