- Growth is INCREASING AT AN INCREASING RATE for: Warehousing Utilization, Warehousing Prices, Transportation Capacity, and Transportation Utilization. Inventory Costs, Warehousing Utilization, and Warehousing Prices
- Growth is INCREASING AT AN DECREASING RATE for: Warehousing Capacity and Inventory Costs
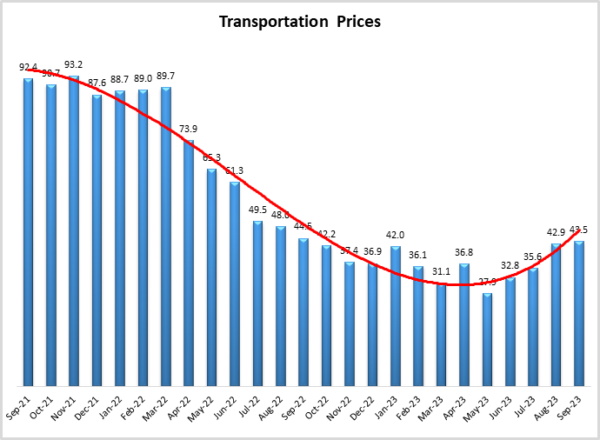
- Inventory Levels and Transportation Prices ARE DECREASING
In September the Logistics Manager’s Index read in at 52.4, up (+1.2) from August’s reading of 51.2. This is the second consecutive month of expansion following three straight readings of contraction from May-July. While this is the fastest rate of expansion since February, a reading of 52.4 is still well below the all-time average of 62.9 and represents a very moderate level of expansion.
The largest contributor to September’s expansion is our three warehousing metrics. The rate of expansion has slowed for Warehousing Capacity (-3.4) while rates of expansion for Warehousing Utilization and Warehousing Prices (+3.1 and +7.9 respectively). We also observe Transportation Utilization moving from no change to expansion (+3.5) and a slight slowdown in the decline of Transportation Prices (+0.6). Conversely, we do observe a slight increase in the contraction of Inventory Levels (-4.5) and Inventory Costs (-4.5).
This second consecutive expansion provides further evidence suggesting that the move towards growth in August was not a one-off occurrence and may have marked a turning point back towards growth in the logistics industry. It is possible we could see the index slide back into contraction in the face of a potential government shutdown and the UAW strikes. However, we have generally observed strong rates of growth in the fourth quarter, so seasonally speaking, it would be unusual to see a move back towards contraction through the rest of 2023.
Researchers at Arizona State University, Colorado State University, Florida Atlantic University, Rutgers University, and the University of Nevada, Reno, and in conjunction with the Council of Supply Chain Management Professionals (CSCMP) issued this report today.
Results Overview
The LMI score is a combination of eight unique components that make up the logistics industry, including: inventory levels and costs, warehousing capacity, utilization, and prices, and transportation capacity, utilization, and prices. The LMI is calculated using a diffusion index, in which any reading above 50.0 indicates that logistics is expanding; a reading below 50.0 is indicative of a shrinking logistics industry. The latest results of the LMI summarize the responses of supply chain professionals collected in September 2023.
The overall LMI is up slightly (+1.2) to 52.4, which represents a very moderate level of expansion. Moderate expansion might be an apt description of the U.S. economy overall. Labor force participation is increasing as the U.S. added 187,000 new jobs in August. While this is slightly above the pre-pandemic average from 2019, it is down from the explosive growth observed throughout 2022 and early 2023. This move towards more sustainable levels of growth may take some pressure off the Federal reserve to raise interest rates again in 2023[1].
Feelings of optimism continue around the U.S. economy as indicated by the University of Michigan’s consumer confidence measure reading it at 68.1 in September – up 16.2% from this time a year ago. When combined with the “Current Economic Conditions” reading of 71.4[2], it is clear that consumers are optimistic about the state of the economy. This optimism is partially due to the continued slowing of inflation. Personal consumption expenditures were up 0.4% in August due to energy and fuel prices. Core inflation rose by only 0.1% over the same period[3]. Wall Street is not quite as confident, as the S&P fell more than 4% in September, making it the worse month for stock prices in 2023. This may be partially due to money moving over to Treasury bonds, where returns have increased with the anticipation that higher interest rates could stick around for longer than had been expected[4].
That being said, the U.S. is still in better shape than many other places around the world. China continues to struggle with consumer sentiment and a crash in their exports and construction industries. A survey by the U.S.-China Business Group does not paint a rosy picture regarding a potential Chinese turnaround, with 43% of respondents stating the Chinese business environment has deteriorated in the past 12 months due to stop-start lockdowns, and restrictions on trade and technology transfer between the U.S. and China[5]. Germany, which has long been the economic driver of the EU, is struggling as well. Europe’s economy may have contracted in Q3 as interest rates continue to take a toll. Conversely, it appears as though there may be growth in places like Australia and Japan. Many central banks are now pulling back on interest rate increases, but it remains unclear if or when any countries could slide into recession[6].
Consumer spending remained strong through the summer as well. While this provides a hope that holiday spending will increase the movement of goods, there are a few potential obstacles on the horizon in the form of the resumption of student loan payments, the UAW strike, and a potential U.S. government shutdown. While a government shutdown was avoided in the last few hours of September, the matter will likely come up again in another 45 days, which could potentially coincide with the runup to black Friday and Cyber Monday. Beyond any potential damage a shutdown could do to sectors of the economy, it would also delay the publication of the economic statistics that the Fed partially bases their interest rate decisions on[7]. While a shutdown remains theoretical, the UAW strike is very real and is increasing in scale in its third week at the end of September, with more walkouts focusing on Ford and GM facilities[8]. Goldman Sachs estimates that annualized economic growth will decrease 0.05 to 0.1 percentage points every week that the strike goes on[9].
Inventory metrics were a somewhat mixed bag in September. Inventory Levels declined (-0.5) at a rate of 47.4, marking the fourth consecutive month that inventories have declined. There is some nuance to this however, as large firms with over 1,000 employees actually saw inventories increase in September, while smaller firms saw them contract. Many firms struggled with have too much inventory over the last year and a half, and some smaller firms may be reticent to build them back up gain for the fear that they would not be able to financially absorb another large overage. Whether or not inventories will increase is dependent on the anticipation of consumer spending in Q4. While estimates vary, analysts believe that consumer savings are down from 2022, but that many Americans still have some “dry powder” that could potentially be spent during the holiday season (although it is also possible many will continue to save for a rainy day)[10]. If more inventory does come into U.S. supply chains it might not be from Chinese factories. Chinese export activity is at its lowest level since March[11], casting doubts over any hopes of a traditional peak season at West Coast ports. A Chinese slowdown, particularly in construction and manufacturing, will take a toll on commodity prices. Ironically, this may actually improve the inflation situation for western consumers as it will lower the costs of raw materials[12]. Any cost decrease would come as a relief, as Inventory Costs continued to grow (-4.5) at a rate of 64.6. Interestingly, Inventory Costs have never contracted in the history of the LMI.
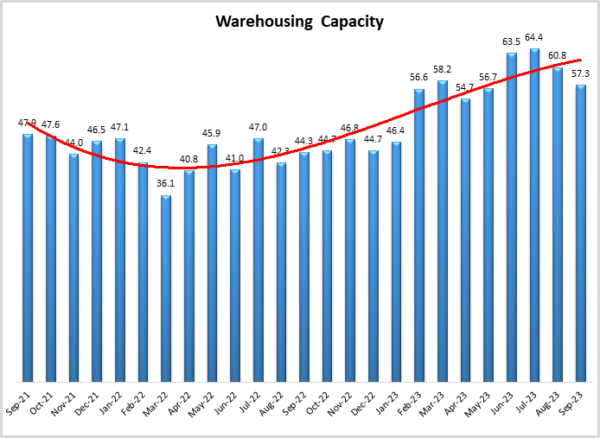
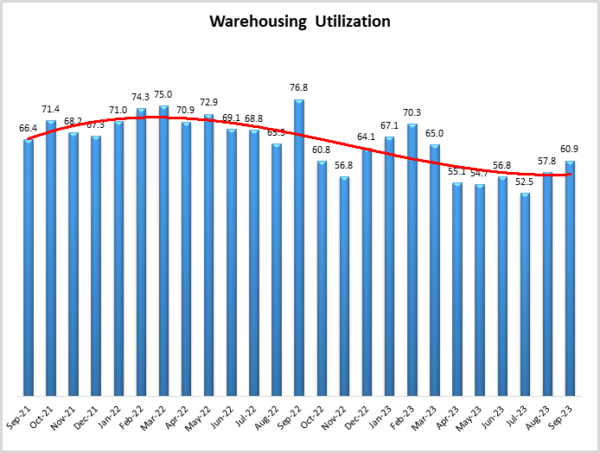
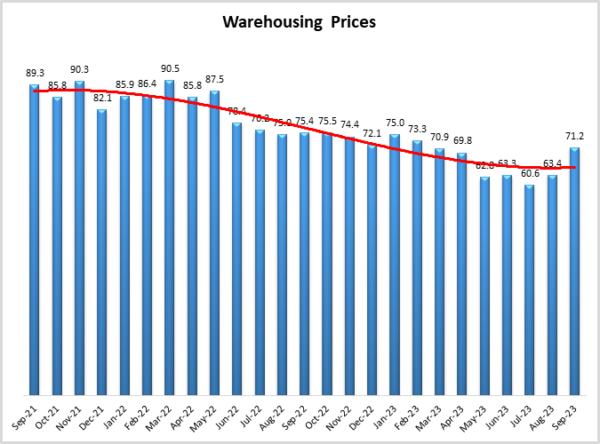
This high cost of managing inventory is partly due to resiliency in warehousing. Warehousing Prices were the big mover in this month’s report, moving up (+7.9) to a significant expansion rate of 71.2. This is a return to the 70’s after five consecutive months in the 60’s. The U.S. national average for warehousing rent is at $9.59 per square foot. The continued growth in prices is likely being driven by the fact that many of the new spaces being built are either located in large metros, designed for ecommerce, or in many cases both[13]. Interestingly, prices are going up despite Warehousing Capacity (-3.4) continuing to come online at a rate of 57.3. The U.S. national vacancy rate reached 4.1% in Q2 of 2023, which is the highest measurement in two years – and up significantly from the vacancy rate of 2.9% a year earlier. Despite this, demand remains high as 205 million square feet of space were leased in the second quarter. Warehousing may be looking towards a more sustainable pace of growth. Construction starts are down, with a relatively modest 110 million square feet starting builds in Q2 (much of it located in distribution hotbeds such as Dallas, Phoenix, and Atlanta)12. This may be partially because of the space available in distressed assets. Estes Express Lines has increased their bid for Yellow’s real estate portfolio to $1.525 billion, exceeding the $1.5 billion offer from Old Dominion[14]. One challenge for firms moving into new and existing warehouses is the having the bandwidth necessary to run large fleets of robots and autonomous forklifts and pickers 24 hours a day[15]. This is something that could continue to be a barrier to entry as more and more of the things operating inside fulfillment and distribution centers become connected via the internet of things. Whether or not the storage space is new or just-built, firms across the board do seem to be responding to the rapid growth in price by using up more of the available space. Warehousing Utilization is up (+3.1) to 60.9, which is the fastest rate of expansion for this metric in six months.
Examining the warehousing data for this month, particularly in light of the capacity and utilization indexes, the data are consistent that the Downstream warehousing sector is experiencing increased demand, as capacity is attempting to chase demand and prices are increasing. Furthermore, the future predictions for each of these three values are 64.2, 68.1, and 71.5 for Warehousing Capacity, Utilization, and Prices, respectively. While the increased volume (actual and predicted) could be the result of other macro factors, the continued pressure on warehousing will be a focal point as we enter into Q4.
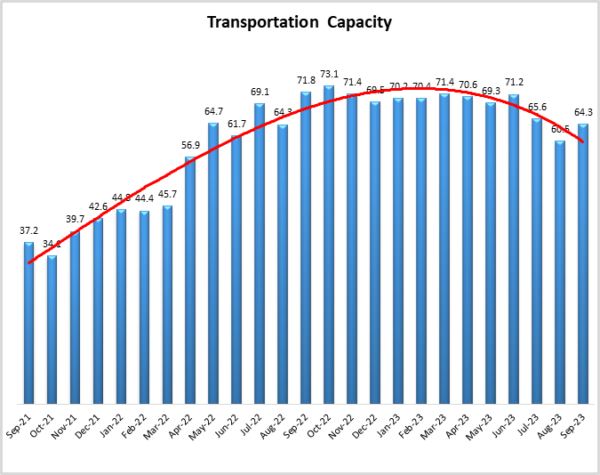
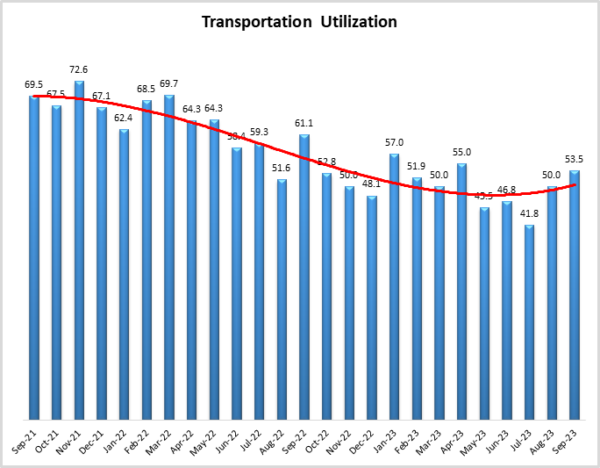
The freight recession is still ongoing, but in a continuation of what we have observed since late July it seems that cracks in the recession are beginning to form. After four months in either contraction or no growth, Transportation Utilization (+3.5) is expanding again at a rate of 53.5. Utilization is up despite the continued increase in Transportation Capacity, which is up (+3.9) to 64.3. There are several factors beyond the soft freight market that have led to this continued expansion. There is of course Yellow’s fleet of trucks that they are hoping to sell for something in the neighborhood of $900 million13. Additionally, California’s new regulations requiring trucks purchased after January 1st to be electric is spurring orders for both electric and traditional diesel vehicles. The former to comply with new regulations, and the latter to purchase as many cheaper, diesel trucks as possible that can be grandfathered in before the enforcement of the new law[16].
Carriers are hopeful that this new capacity will be put to work soon. For instance, Radiant Logistics believes the current market is “at or near the bottom of the cycle”. CEO Bohn Crain is optimistic for a meaningful turnaround sometime in 2024[17]. This optimism is not just anecdotal. Firms plan to hire seasonal workers at a level somewhat consistent with last year, including 100,000 at UPS, and 10,000 at both Target and USPS. Amazon is the outlier here, planning to bring on 250,000 – up from 150,000 in 2022 – to bolster its ability to meet next- and same-day shipping demands starting with its second Prime Day in mid-October[18]. September also saw J.B. Hunt purchasing the brokerage operations of NBSF logistics in an attempt to more add more services to its offerings[19]. These investments in people and capital foreshadow some level of optimism regarding a recovery in the freight market. That recovery is not here yet as Transportation Prices continue to contract (+0.6). However, their reading of 43.5 is the slowest rate of contraction since 12 months ago in September of last year. The rate of contraction has slowed steadily since May. If this trend continues, respondent future predictions of Transportation Price growth over the next 12 months (predicted to grow at a rate of 69.4 and discussed below) could mean an end to the freight recession that started back in July of 2022.
Continuing the trend we have observed throughout most of 2023 we see more activity from our Downstream (orange bars) than from our Upstream (blue bars) respondents. Similar to August, both sides of the supply chain reported slight contraction in Inventory Levels. However, Downstream firms are closing in on equilibrium and may move back into expansion for Q4. Downstream firms do however report statistically higher rates of expansion for Warehousing Utilization. This suggests that consumer-facing firms are filling up warehouses with goods – potentially foreshadowing an expectation of consumer demand for goods during the holiday season. We also find significance in Transportation Prices, where Upstream firms continue to contract (39.7) but Downstream firms have moved from contraction back to no change at 50.0. This is a significant change as this index has been contracting across the supply chain throughout 2023. If Downstream firms do move into a state of expansion in the coming months, the chance that we break out of the ongoing freight recession will continue to increase.
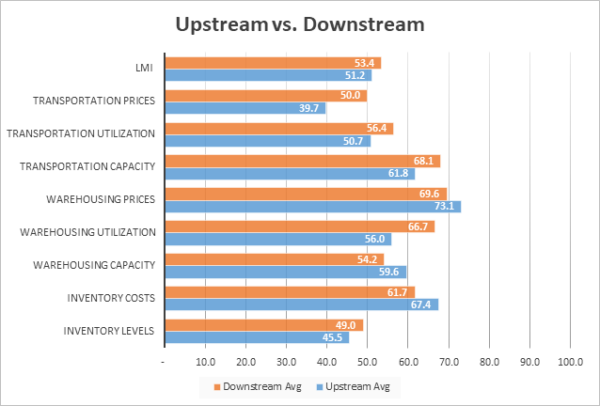
| Inv. Lev. | Inv. Costs | WH Cap. | WH Util. | WH Price | Trans Cap | Trans Util. | Trans Price | LMI | |
| Upstream | 47.9 | 66.0 | 66.4 | 58.2 | 64.6 | 64.4 | 43.7 | 40.0 | 48.7 |
| Downstream | 47.7 | 74.4 | 51.2 | 57.0 | 60.5 | 54.7 | 61.4 | 48.9 | 55.8 |
| Delta | 0.2 | 8.4 | 15.3 | 1.2 | 4.1 | 9.7 | 17.7 | 8.9 | 7.1 |
| Significant? | No | Marginal | Yes | No | No | Marginal | Yes | No | Yes |
Responses varied slightly from early (gold bars) to late (green bars) September. The only significant differences are somewhat paradoxical, as Warehousing Capacity was down dramatically in the second half of the month (moving from 67.6 to 52.5), but at the same time Inventory Costs also decreased (moving from 71.6 to 61.7). Generally, we would expect less storage space to lead to higher holding costs for inventories. We will continue monitoring this somewhat unique dynamic to see if it persists going forward. While it was not a statistically significant difference, it is also worth pointing out that the contraction in Transportation Prices slowed from 38.5 in early September to 46.8 in the second half of the month. Whether this portends continued growth in Transportation Prices through Q4 remains to be seen.
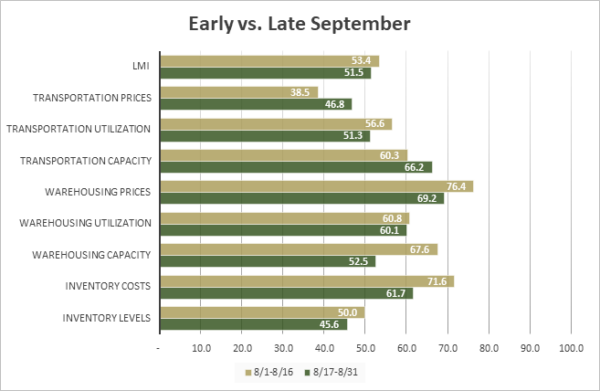
| Early/Late | Inv. Lev. | Inv. Costs | WH Cap. | WH Util. | WH Price | Trans Cap | Trans Util. | Trans Price | LMI | ||||||||||
| 9/1-9/15 | 50.0 | 71.6 | 67.6 | 60.8 | 76.4 | 60.3 | 56.6 | 38.5 | 53.4 | ||||||||||
| 9/16-9/30 | 45.6 | 61.7 | 52.5 | 60.1 | 69.2 | 66.2 | 51.3 | 46.8 | 51.5 | ||||||||||
| Delta | 4.4 | 9.9 | 15.1 | 0.7 | 7.2 | 6.0 | 5.3 | 8.3 | 1.9 | ||||||||||
| Significant? | No | Marginal | Yes | No | No | No | No | No | No |
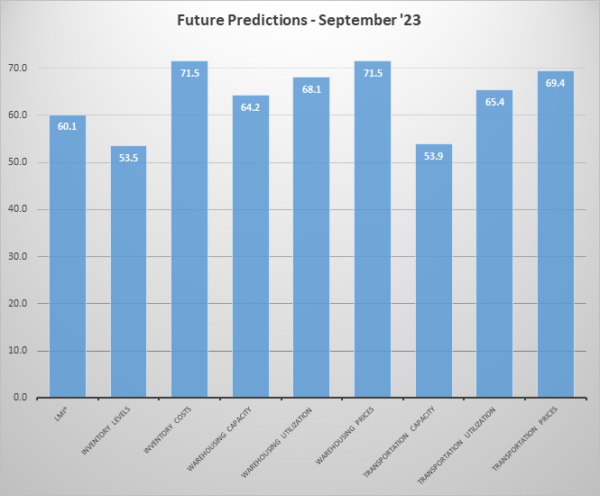
Respondents were asked to predict movement in the overall LMI and individual metrics 12 months from now. Future expectations were more optimistic about the future in September than they were in August. The predicted reading for the overall LMI is over 60.0 for the first time since July of 2022. Respondents expect Inventory Levels to continue moderating, growing at a mild rate of 53.5 over the next 12 months. Inventories growing at a level in the low- to mid-50’s likely represents a sustainable rate of growth and suggests that firms are moving back towards equilibrium facilitated by JIT policies where inventory turns over quickly and efficiently. Despite the moderate estimates for the volume of goods, respondents expect them to be expensive, with Inventory Costs registering at 71.5. The anticipation of growth is likely propelled by high expectations for Warehousing Prices (+5.1 to 71.5) and Transportation Prices (+4.1 to 69.4). Interestingly, respondents are also predicting Transportation Capacity growth will slow to a more sustainable 53.9. If these predictions do come true, it would represent an inversion of Transportation Capacity and Prices which usually signals a move from “bust” to a “boom” period in freight markets.
As has been the case through most of 2023, optimism regarding future changes comes from our Downstream (purple bars) more than from their Upstream (green bars) counterparts. Downstream firms are expecting Inventory Levels to growth faster (57.3 to 50.7) and anticipate significantly greater rates of expansion for Transportation Utilization (71.3 to 60.4) and Transportation Prices (77.1 to 64.7). Respondents across the supply chain seem to be predicting an end to the ongoing freight recession, but consumer-facing firms are expecting the swing back towards growth to be much stronger than Upstream firms. That being said, Upstream firms are significantly more bullish on warehousing; expecting a significantly slower rate of growth in available Warehousing Capacity (58.1 to 71.9) and a much faster rate of growth for Warehousing Prices (76.1 to 66.0). Taking these together: It appears that Downstream firms are expecting to have inventories moving through supply chains quickly, utilizing a high level of transportation assets to meet consumer demand. At the same time, Upstream firms anticipate utilizing lots of expensive storage space, perhaps in a bid to keep goods ready to be shipped to their Downstream customers the moment they are needed.
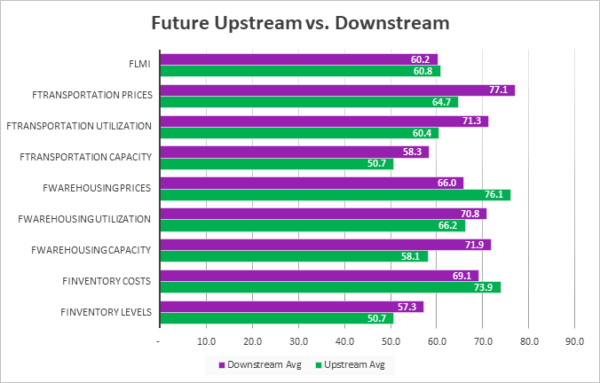
| Futures | Inv. Lev. | Inv. Costs | WH Cap. | WH Util. | WH Price | Trans Cap. | Trans Util. | Trans Price | LMI |
| Upstream | 50.7 | 73.9 | 58.1 | 66.2 | 76.1 | 50.7 | 60.4 | 64.7 | 60.8 |
| Downstream | 57.3 | 69.1 | 71.9 | 70.8 | 66.0 | 58.3 | 71.3 | 77.1 | 60.2 |
| Delta | 6.5 | 4.7 | 13.8 | 4.7 | 10.2 | 7.6 | 10.8 | 12.4 | 0.6 |
| Significant? | No | No | Yes | No | Yes | No | Yes | Yes | No |
The disparity between larger firms (those with 1,000 employees or more, represented by gold lines) than from smaller firms (those with 0-999 employees, represented by maroon lines) was less pronounced in September than it had been in the previous months. The only statistically significant difference between the two groups was in regard to Inventory Levels, with large firms expecting growth (51.6) and smaller firms expecting continuing contraction (40.2). Essentially, it seems that larger firms- are building inventories up for Q4 which is leading to slightly higher (though not significant) readings across the board. It is interesting that large firms are seeing this level of growth when both Upstream and Downstream firms reported a slight contraction in inventories. This suggests that it is the larger Downstream retailers, and their larger Upstream suppliers and logistics service providers that are currently driving the move back towards growth in the logistics industry.
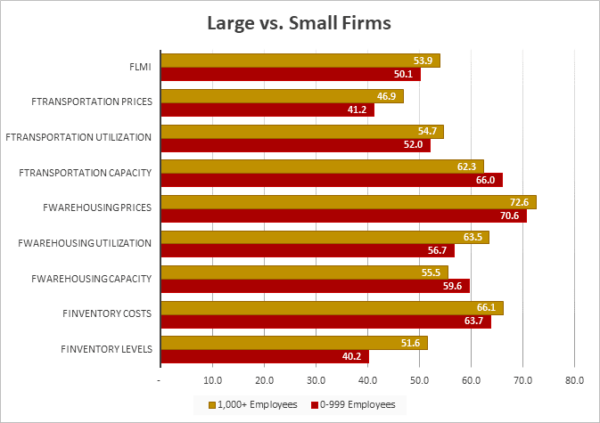
| Employees | Inv. Lev. | Inv. Costs | WH Cap. | WH Util. | WH Price | Trans Cap. | Trans Util. | Trans Price | LMI |
| 0-999 | 40.2 | 63.7 | 59.6 | 56.7 | 70.6 | 66.0 | 52.0 | 41.2 | 50.1 |
| 1,000+ | 51.6 | 66.1 | 55.5 | 63.5 | 72.6 | 62.3 | 54.7 | 46.9 | 53.9 |
| Delta | 11.4 | 2.4 | 4.1 | 6.8 | 2.0 | 3.7 | 2.7 | 5.7 | 3.8 |
| Significant? | Yes | No | No | No | No | No | No | No | No |
The index scores for each of the eight components of the Logistics Managers’ Index, as well as the overall index score, are presented in the table below. The overall index is expanding at a slightly faster rate (+1.2) of 52.4. Six of the eight sub-components are expanding, including Transportation Utilization which moved from “no change” back to expansion at a rate of 53. The two metrics that continue to contract are Inventory Levels at 47.4 and Transportation Prices at 43.5.
| LOGISTICS AT A GLANCE | |||||
| Index | September 2023 Index | August 2023 Index | Month-Over-Month Change | Projected Direction | Rate of Change |
| LMI® | 52.4 | 51.2 | +1.2 | Expanding |
Faster |
| Inventory Levels | 47.4 | 47.9 | -0.5 | Contracting | Faster |
| Inventory Costs | 64.6 | 69.1 | -4.5 | Expanding | Slower |
| Warehousing Capacity | 57.3 | 60.8 | -3.4 | Expanding | Slower |
| Warehousing Utilization | 60.9 | 57.8 | +3.1 | Expanding | Faster |
| Warehousing Prices | 71.2 | 63.4 | +7.9 | Expanding | Faster |
| Transportation Capacity | 64.3 | 60.5 | +3.9 | Expanding | Faster |
| Transportation Utilization | 53.5 | 50.0 | +3.5 | Expanding | From No Change |
| Transportation Prices | 43.5 | 42.9 | +0.6 | Contracting | Slower |
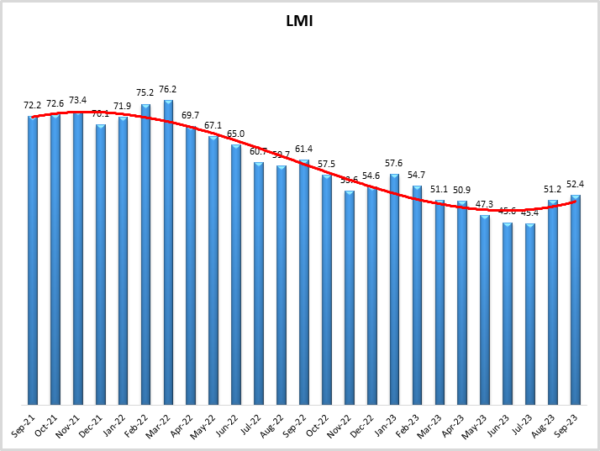
Historic Logistics Managers’ Index Scores
This period’s along with prior readings from the last two years of the LMI are presented table below:
| Month | LMI | Average for last 3 readings – 49.7
All-time Average – 62.9 High – 76.2 Low – 45.4 Std. Dev – 8.22
|
| Sep ‘23 | 52.4 | |
| Aug ‘23 | 51.2 | |
| July ‘23 | 45.4 | |
| June ‘23 | 45.6 | |
| May ‘23 | 47.3 | |
| Apr ‘23 | 50.9 | |
| Mar ‘23 | 51.1 | |
| Feb ‘23 | 54.7 | |
| Jan ‘23 | 57.6 | |
| Dec ‘22 | 54.6 | |
| Nov ‘22 | 53.6 | |
| Oct ‘22 | 57.5 | |
| Sep ‘22 | 61.4 | |
| Aug ‘22 | 59.7 | |
| July ‘22 | 60.7 | |
| June ‘22 | 65.0 | |
| May ‘22 | 67.1 | |
| Apr ‘22 | 69.7 | |
| Mar ‘22 | 76.2 | |
| Feb ‘22 | 75.2 | |
| Jan ‘22 | 71.9 | |
| Dec ‘21 | 70.1 | |
| Nov ‘21 | 73.4 | |
| Oct ‘21 | 72.6 | |
| Sep ‘21 | 72.2 |
LMI®
September marks the second straight month of expansion after five consecutive months of reaching new lows. The overall index is up (+1.2) to 52.4 which is the highest reading for the overall index since February. This move is fueled by continued growth in the warehousing market, increased inventory costs, and some signs of green shoots emerging in the transportation industry. a slight tightening in the transportation market and continued growth in warehousing and inventory costs. Unlike last month, both Upstream and Downstream firms are seeing growth in the overall index, with respective readings of 51.2 and 53.4.
Respondents continue to get more and more optimistic regarding growth. The predicted expansion rate of 60.1 is up (+1.5) from August’s future prediction of 58.6. A growth rate of 60.1 would represent steady, sustainable growth that would be welcome to many in the logistics industry.
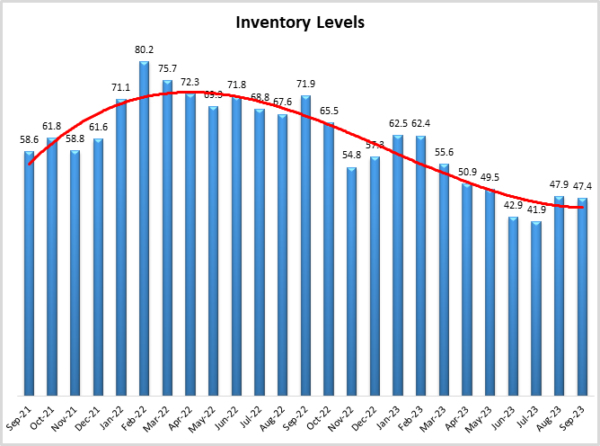
Inventory Levels
The Inventory Level value is 47.4, which is down very slightly (-0.5) from August’s reading of 47.9. This is only the sixth consecutive time – but also seventh time overall that this metric has been in a state of contraction. This value is down 11.2 from 2021 and down 24.5 from last year when firms were struggling to reduce inventories. This recent run of contraction is rather unusual as September marks only the this is only the seventh value indicating a contraction in Inventory Levels This month, both upstream and downstream respondents reported slight decreases. This month, both upstream and downstream respondents reported slight decreases. Upstream respondents averaged 45.5, while downstream averaged 49.0. Last month, both upstream and downstream respondents reported slight decreases. Upstream respondents averaged 47.9, while downstream averaged 47.7. This month, small firms had an average value of 40.2, while larger firms averaged 51.6. Small firms are still reducing inventories, while larger firms are increasing.
When asked to predict what conditions will be like 12 months from now, the average value is 53.5, a slight decrease (-0.8) from August’s future prediction of 54.3. up (+6.4) from July’s future prediction of 47.9. Interestingly, Upstream respondents predicted a slight increase of 50.7, while Downstream respondents predicted a larger increase of 57.3.
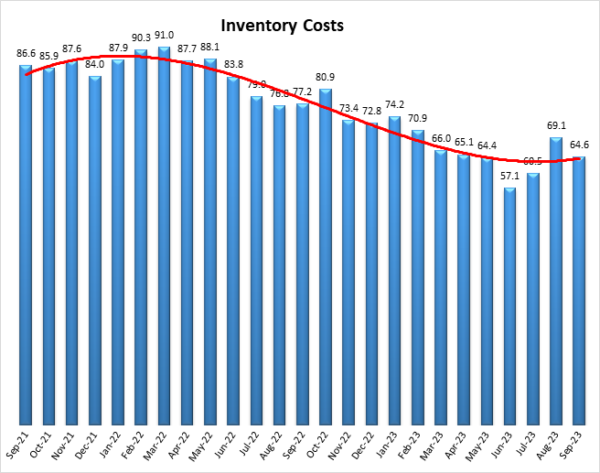
Inventory Costs
As mentioned above, Inventory Costs have never contracted and in fact continue to expand at a value of 64.6, with is down (-4.5) from August’s reading of 69.1. This is also down 12.6 from last year, and down 22.0 from two years ago. Both Upstream and Downstream reported increased Inventory Costs (67.4 and 61.7 respectively) although in a switch from last month, Upstream costs are expanding at a notably faster rate. We also observe a significant difference between small firms at 63.7 and their larger counterparts at 66.1, continuing the trend of the last three months in which higher costs are being borne by firms with larger footprints.
Similar to the dynamic we observed in August, predictions for future Inventory Cost growth is much higher than the predicted expansion for Inventory Levels (71.5 to 53.5). It seems likely that this difference reflects an expectation that storage space will remain tight, transportation prices will increase, and firms will attempt to keep stock low through the use of JIT policies. Slightly more of this cost growth will be felt Upstream (73.9) than Downstream (69.1).
Warehousing Capacity
The Warehousing Capacity index registered in at 57.3 points for September 2023, down (-3.4) from August’s reading of 60.4. This value is up 13 percentage points from the reading one year ago, and is also up 10.6 points from the reading two years ago. The data from this month also show that the difference between upstream (59.6) vs. downstream (54.2) readings on this level is not statistically significant. Finally, this month’s report indicates that there is no statistically significant difference in the Warehousing Capacity index at small firms with under 1000 employees (59.6) vs large firms over 1000 employees (55.5).
Future predictions suggest capacity will continue to come online over the next year as respondents are expecting an expansion rate of 64.2, up (+3.1) from August’s future prediction of 61.1. Future predictions vary by supply chain position, Downstream firms are predicting significant levels of growth rate a rate of 71.9 – 13.8-points higher than the more moderate growth rate of 58.1 predicted by Upstream firms. This split may represent an anticipation that a significant level of ecommerce fulfillment centers will come online over the next 12 months.
Warehousing Utilization
The Warehousing Utilization index read in at 60.9 points for September 2023, up (+3.1) points from August’s reading of 57.8. In addition, we see that this value is down considerably (-25.9) from the reading one year ago, and also down (-5.7) from the reading two years ago. While the rate at which utilization is increasing seems to be slowing, that it is above 50 still indicates that demand continues to rise. There is also a moderate (10.7 percentage points) and marginally statistically significant difference between Upstream (56.0) and Downstream (67.7) Warehousing Utilization. Finally, we see that the difference between the utilization for small firms (56.7) vs large firms (63.5) is not statistically significant. Hence, in conjunction with the capacity numbers noted above, it seems that supply is attempting to chase demand and the shift Downstream in Warehousing Capacity may be reflecting the increased utilization in this part of the distribution channel.
Looking forward to the next 12 months, the predicted Warehousing Utilization index is 64.4, which is up (+3.1) from August’s future prediction of 61.1. Downstream firms are more bullish on future utilization, predicting an expansionary rate of 70.8 – 4.7 points higher than the Upstream prediction of 66.2-point growth.
Warehousing Prices
The Warehousing Price index read in at 71.2 in September 2023, up (+7.9) from August’s reading of 63. This value is down 4.2-points from the reading one year ago, and down 17.2-points from the reading two years ago. Though, much like the two other warehousing metrics, the rate at which the Warehousing Prices are increasing continues to increase. There is a 4.5-point, non-statistically significant, difference between Upstream (69.6) and Downstream (73.1) Warehousing Prices. We also note that there is a small (2-point) difference between small (70.6) and large (72.6) firms on this metric – which may be further evidence of the shift toward Downstream preparation.
Future predictions suggest prices growth will remain healthy as respondents are expecting prices to continue to grow at a rate of 71.5, up (+5.1) from August’s future prediction of 66.4.. This suggests that firms are planning to stock up on inventory over the next year and are anticipating that the costs of doing so will be high. Upstream firms expect a significantly faster rate of price expansion at 76.1 relative to Downstream predictions of 66.0.
Transportation Capacity
The Transportation Capacity Index registered 64.3 in September 2023. This constitutes an increase of 3.8-points from the August reading of 60.5. With this increase the Transportation Capacity Index has rebounded and broken the downward trend. The increase is even more significant for the Downstream Transportation Capacity Index which is at 68.1, while the Upstream index is at 61.8.
The future Transportation Capacity Index indicates 53.9 corresponding to a slight drop of .2 points from the previous reading and continuing to indicate expectations of slight growth. The Downstream future Transportation Capacity Index is at 58.3 while the Upstream future transportation capacity index indicates 50.7.
Transportation Utilization
The Transportation Utilization Index registered 53.5 in September 2023. This corresponds to an increase of 3.5 points from last month’s reading. With this increase, t Transportation Utilization continues to rebound and enters expansion territory for the first time since April 2023. The Downstream Transportation Utilization Index is now at 56.4, while the Upstream index is now at 50.7, also indicating expansion.
The future Transportation Utilization Index also increased slightly from the previous reading and indicates expansion at a 65.4 level for the next 12 months. As such expectations of increased Transportation Utilization remain strong, especially Downstream where the is now 71.3. The Upstream Transportation Utilization index also moved slightly higher than last month and is now at 60.4.
Transportation Prices
The Transportation Prices Index indicates 43.5, which corresponds to a small increase of 0.6 points from last month. Hence, the downward pressure on Transportation Prices eased a little more but the index remains slightly in contraction territory. The Downstream Transportation Prices index is now at 50.0, indicating steady prices, while the upstream index is at 39.7, continuing to indicate contraction.
The future index for transportation prices ticks higher and is now at 69.4, indicating stronger expectations of higher Transportation Prices in the next 12 months. The Downstream Transportation Prices Index is at 77.1 while the Upstream Transportation Prices Index is at 64.7, so the expectations of higher prices coming to transportation over the next year continue to strengthen across the supply chain.
About This Report
The data presented herein are obtained from a survey of logistics supply executives based on information they have collected within their respective organizations. LMI® makes no representation, other than that stated within this release, regarding the individual company data collection procedures. The data should be compared to all other economic data sources when used in decision-making.
Data and Method of Presentation
Data for the Logistics Manager’s Index is collected in a monthly survey of leading logistics professionals. The respondents are CSCMP members working at the director-level or above. Upper-level managers are preferable as they are more likely to have macro-level information on trends in Inventory, Warehousing and Transportation trends within their firm. Data is also collected from subscribers to both DC Velocity and Supply Chain Quarterly as well. Respondents hail from firms working on all six continents, with the majority of them working at firms with annual revenues over a billion dollars. The industries represented in this respondent pool include, but are not limited to: Apparel, Automotive, Consumer Goods, Electronics, Food & Drug, Home Furnishings, Logistics, Shipping & Transportation, and Warehousing.
Respondents are asked to identify the monthly change across each of the eight metrics collected in this survey (Inventory Levels, Inventory Costs, Warehousing Capacity, Warehousing Utilization, Warehousing Prices, Transportation Capacity, Transportation Utilization, and Transportation Prices). In addition, they also forecast future trends for each metric ranging over the next 12 months. The raw data is then analyzed using a diffusion index. Diffusion Indexes measure how widely something is diffused or spread across a group. The Bureau of Labor Statistics has been using a diffusion index for the Current Employment Statics program since 1974, and the Institute for Supply Management (ISM) has been using a diffusion index to compute the Purchasing Managers Index since 1948. The ISM Index of New Orders is considered a Leading Economic Indicator.
We compute the Diffusion Index as follows:
PD = Percentage of respondents saying the category is Declining,
PU = Percentage of respondents saying the category is Unchanged,
PI = Percentage of respondents saying the category is Increasing,
Diffusion Index = 0.0 * PD + 0.5 * PU + 1.0 * PI
For example, if 25 say the category is declining, 38 say it is unchanged, and 37 say it is increasing, we would calculate an index value of 0*0.25 + 0.5*0.38 + 1.0*0.37 = 0 + 0.19 + 0.37 = 0.56, and the index is increasing overall. For an index value above 0.5 indicates the category is increasing, a value below 0.5 indicates it is decreasing, and a value of 0.5 means the category is unchanged. When a full year’s worth of data has been collected, adjustments will be made for seasonal factors as well.
[1] Chaney Cambon, S., & Ettenheim, R. (2023, September 9). The Job-Market Boom Is Over. Here’s Why and What It Means. WSJ. https://www.wsj.com/economy/
[2] University of Michigan. (2023, September 8). Surveys of Consumers. Survey of Consumer – Final Results for September 2023. http://www.sca.isr.umich.edu/
[3] Chaney Cambon, S., & Timiraos, N. (2023, September 29). Underlying Prices Cooled in August, Giving the Fed More Evidence of Softer Inflation. WSJ. https://www.wsj.com/economy/
[4] Rennison, J. (2023, September 29). Wall Street on Edge After Worst Month of the Year. The New York Times. https://www.nytimes.com/2023/
[5] Hayashi, Y. (2023, September 26). China’s Business Environment Is Deteriorating, U.S. Companies Say. WSJ. https://www.wsj.com/business/
[6] Hannon, P. (2023, September 22). How Much Will It Cost to Defeat Inflation? WSJ. https://www.wsj.com/economy/
[7] Timiraos, N. (2023, September 26). Shutdown Would Blindfold Fed in Piloting Course on Rates. WSJ. https://www.wsj.com/economy/
[8] Eckert, N., & Felton. (2023, September 29). UAW Expands Strike to GM Plant in Michigan, Ford Factory in Chicago. WSJ. https://www.wsj.com/business/
[9] Harrison, D. (2023, September 24). U.S. Economy Could Withstand One Shock, but Four at Once? WSJ. https://www.wsj.com/economy/u-
[10] Lahart, J. (2023, September 29). How Much Savings Do Americans Have Left, Anyway? WSJ. https://www.wsj.com/economy/
[11] Tan, C. (2023, September 29). China’s economic activity again weakened in September, China Beige Book survey shows. CNBC. https://www.cnbc.com/2023/09/
[12] Marsh, N. (2023, September 28). What China’s economic problems mean for the world. BBC News. https://www.bbc.com/news/
[13] Young, L. (2023b, September 20). How Warehouses Are Escaping Real Estate’s Doom Loop, in Charts. Wall Street Journal. https://www.wsj.com/articles/
[14] Page, P. (2023, September 13). Trucker Estes Raises Stakes in Bidding War for Yellow Properties. Wall Street Journal. https://www.wsj.com/articles/
[15] Young, L. (2023a, September 17). Where’s the Signal? Warehouse Robots Are Searching for Stronger Internet Connections. Wall Street Journal. https://www.wsj.com/articles/
[16] Berger, P. (2023, September 20). California’s Zero-Emissions Rule Triggers a Run on Diesel Rigs. Wall Street Journal. https://www.wsj.com/articles/
[17] Maiden, T. (2023, September 14). Radiant Logistics says freight market at or near bottom. FreightWaves. https://www.freightwaves.com/
[18] Young, L. (2023c, September 28). Logistics Companies Grow Cautious on Holiday Hiring. Wall Street Journal. https://www.wsj.com/articles/
[19] Ojea, S. (2023, September 14). J.B. Hunt Transport Will Acquire BNSF Brokerage Business. Wall Street Journal. https://www.wsj.com/articles/


