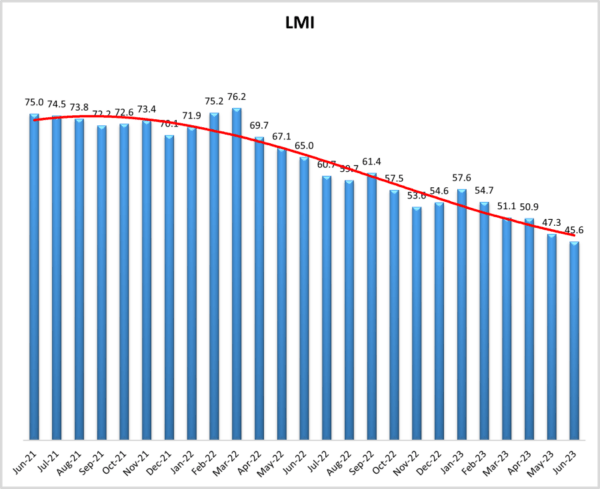
For the second time in a row the Logistics Managers’ Index registers as contracting – coming in at 45.6. This is the fourth consecutive month that the index has reached a new all-time low. Our inventory metrics are at the forefront of this decline. Inventory Levels is contracting (-6.5) at 42.9 which is the second fastest rate in the history of the index and the growth rate for Inventory Costs is down (-7.3) to 57.1. The dip in inventories has led to an increase in Warehousing Capacity (+6.8) and Transportation Capacity (+1.9), both of which contribute to a decrease in the overall metric. Transportation Utilization and Transportation Prices are contracting, but at reduced rates from what we saw in May.
Researchers at Arizona State University, Colorado State University, Rochester Institute of Technology, Rutgers University, and the University of Nevada, Reno, and in conjunction with the Council of Supply Chain Management Professionals (CSCMP) issued this report.
The LMI score is a combination of eight unique components that make up the logistics industry, including: inventory levels and costs, warehousing capacity, utilization, and prices, and transportation capacity, utilization, and prices. The LMI is calculated using a diffusion index, in which any reading above 50.0 indicates that logistics is expanding; a reading below 50.0 is indicative of a shrinking logistics industry. The latest results of the LMI summarize the responses of supply chain professionals collected in June 2023.

When taken as a whole, Q2 economic data was strong in the U.S. – if not in the freight sector. For instance, new home sales are up, unemployment rate is down, and Q1 GDP growth has been revised up to 2% growth with Q2 growth predicted to be around 1.7%. much of this has been spurred by consumer spending, which was up at 4.2% in Q1 – the highest positive rate of change since the end of lockdowns in mid-2021[1]. This is at least partially reflected on the continually higher rates of expansion (or at least slower rates of contraction) that we are often seeing from our Downstream relative to Upstream respondents.
Consumers are “downshifting” but spending is still robust – particularly when compared to the rest of the world[2]. This is somewhat buoyed by consumer sentiment which improved significantly in June, reading in at 64.4 according to the University of Michigan’s Consumer Sentiment Index. This reading is up 8.8% from May and 28.8% year-over-year[3], suggesting that consumers are not nearly as worried about a recession as they were a year ago when inflation was driving up prices. Despite this, inflation continues to run higher than most central banks would prefer. The personal-consumption expenditures index read in at 3.8% in May. This is the lowest reading on this metric in two years but still higher than what the Federal Reserve would like to see2. Because consumer savings were robust going into 2022 the high levels of interest have done less to curb spending than would be normally be expected. Due to these unique factors, Atlanta Fed President Raphael Bostic believes that only the most recent few months of interest rates actually did anything to truly slow overall economic growth[4]. This, along with the long-tail effect in which interest rate increases may have somewhat delayed reactions, is behind Chairman Powell’s recent statements that the Fed will put forth two more rate increases this year as they do not expect inflation to reach their goal of 2% until 2025[5]. Bank of America is more bullish on inflation coming down, pointing to the steep inversion of the Treasury yield curve, which suggests that investors believe the Fed will eventually begin pulling interest rates back and avoid an overall recession[6].
Taken together, Wall Street is somewhat optimistic about the state of the economy as well as the stock market had its best six months of the year since 1983. However it should be noted that much of that growth is coming from the service sector – which is less reliant on trucks and warehouses than goods[7]. This dynamic is reflected in the complicated nature of the current economy. While the freight recession has been on for over a year at this point, the overall recession that many prognosticators predicted has yet to occur. This is reflected in the fact that despite these strong economic indicators, the overall LMI reads in at 45.6, which is down (-1.7) from the previous all-time low of 47.3 recorded in May. However, it should also be pointed out that LMI respondents are somewhat optimistic that this will take a turn, predicting an expansion rate of 55.4 over the next 12 months – a reading that is 5.8-points more optimistic than the future prediction of 49.6 and contraction from May.
Inventory metrics were the big movers in June. Inventory levels continued their downward movement, dropping (-6.5) to 42.9, which is the second-lowest reading in the history of this metric. Seasonality would suggest that this value should come up soon, but there are some signals that that might not happen. Traditionally we see consumers move from bulkier goods that may require financing (i.e. lawn furniture) in the summer towards smaller goods (i.e. back-to-school items, clothing, and toys) during the back half of the year. Smaller goods have been moving faster throughout the year – as evidenced by the stronger inventory and transportation numbers we have seen for most of 2021. While this could theoretically lead to more volume in Q3 and Q4, there does not appear to be a large glut of holiday inventory on the way. The Chinese manufacturing PMI read in at 49.0 in June. This marks three consecutive months of contraction in what is often the ramp up for back-to-school and holiday production. The overall Chinese PMI is positive at 53.2, but is the weakest reading of 2023 – casting doubt on any significant increases in Chinese economic production[8]. Container imports are down from the highs of 2021 and 2022, but according to analysis by Michigan State professor (and friend of the index) Jason Miller, the volumes we are seeing now are up 7.4% from 2019 – exactly in line with the predicted level of growth that would have occurred have the COVID disruptions never happened[9]. Due to the contraction (which some would call “right-sizing”) of inventories, Inventory Cost growth dipped in June, slowing (-7.3) to 57.1 which is a noticeably slower rate of contraction.
Some retailers may be nervous about restocking due to uncertainty regarding the impact of the Supreme Court’s decision to strike down the Biden administration’s student loan forgiveness plan – and the $430 billion that will need to be paid back by the 16 million people that had been approved for the program[10]. Some retailers are bracing for consumers to pull back on discretionary spending on items such as clothing. This shift comes at an inconvenient time for retailers as payments are scheduled to resume right at the start of the back-to-school season which is historically a robust period for clothing sales[11].
The reduction in inventories is having a clear impact on the warehousing sector. Warehousing Capacity expanded (+6.8) to a growth rate of 63.5. This is the fastest rate of expansion for this metric in the history of the index, and only the second time it has read in the 60’s (the other occurrence was February 2020 as Chinese imports began to dry up due to lockdowns). Despite this abundance of capacity Warehousing Utilization increased it’s rate of growth, increasing (+2.1) to 56.8 in June. Despite the reduction of inventories, some firms are clearly betting that a move back towards season spending on goods and an increase in ecommerce will lead to more demand down the road. This seems to have been the thinking behind Prologis’ late June acquisition of $3.1 billion portfolio of warehouse and distribution assets from Blackstone. Prologis president Dan Letter mentioned the continued importance of ecommerce and last-mile delivery to the firm’s recent growth. That this portfolio includes several facilities in major markets seems to suggest that Prologis sees more room for growth in industrial real estate oriented around ecommerce[12]. They might also be encouraged by the continued expansion in Warehousing Prices. This metric has been the most consistent growth area throughout is up (+0.6) to 63.3 and has now read in above 60.0 for 39 consecutive months. Capacity may be increasing, but rates continue to rise. There are several factors behind this. One is the long-term nature of warehousing contracts, meaning that some firms are still paying higher than market rates. Based on an analysis of large and small firms that will be discussed below, this seems to be particularly true for larger firms. Another potential factor for the continued growth in real estate prices is that unlike in previous economic downturns there have not been “doom spirals” of banks or other financial entities that owned large portfolios, preventing a flood of defaulted assets from entering the market[13].
The freight market remains challenging. After a one month reprieve in the 60’s Transportation Capacity is back up (+1.9) to 71.2 and above 70.0 – where it has been for almost all of 2023. Despite the excess capacity and low prices, the exits from the freight market that we would have expected to see have not yet materialized. However, Yellow Corp.’s ongoing issues do have some analysts considering what the impact of a potential bankruptcy would be on the overall market. Yellow has seen tonnage drop by 16% year-over-year and more than double that from the same period in 2021. They recently requested a delay in welfare and pension contributions from the union workers (which was unsurprisingly turned down) due to the fear they will run out of cash by mid-summer[14]. If a bankruptcy were to happen at the third-largest LTL carrier in the U.S., capacity might begin to tighten and spot-market prices may begin to stabilize. Capacity could also be impacted by a potential strike at UPS. In the last week of June, the 330,000 UPS workers represented by The Teamster’s rejected UPS’s latest offer. However, negotiations have continued and the two sides are hopeful that a deal will be agreed on shortly after the Fourth of July. If the sides do not reach an agreement, it is likely that The Teamsters will strike when their contract expires at the end of July[15]. While the decrease in available trucking capacity could be a boon to some carriers, UPS need only to look at the problems currently being faced by Yellow Corp and their ongoing labor and restructuring issues (oh which labor is admittedly only one element of their financial issues) to see what the consequences of not reaching a deal could be14.
It is unsurprising that the glut of capacity has led to continued contraction in Transportation Utilization (+1.3) which reads in at 46.8 which is it’s second consecutive month of contraction – although this month is slower rate of contraction relative to what we observed in May. Contraction may be slowing due to the national tender rejection rate hovering between 2.5-3.2% through the start of summer, with some expected upward movement as we approach the Fourth of July holiday. Interestingly, we do see some spot rates increasing, particularly for outbound freight from large markets such as Phoenix or Memphis[16]. Spot markets still linger well behind contract rates – potentially explaining some of the discrepancies we will see below between large and small carriers. Transportation Prices continue to decrease rapidly at 32.8, but at least that reading is 4.8-points higher than May’s record contraction rate of 27.9. Beyond excess capacity, it is likely that the falling price of diesel, which is down to $3.80 per gallon in the last week of June – $1.98 cheaper than this time a year ago[17] has contributed to continually falling prices as well.
Evidence of a return to normal can be seen in data from the U.S. Census Bureau tracking the seasonally adjusted inventory to sales ratio for total business inventories for 2015-2023[18]. When inventory to sales ratios are elevated, as in the Spring of 2020, firms have more inventory on-hand than they can sell. When inventory to sales ratios dip, as in the summer of 2021, firms are selling inventory very quickly and may be having a difficult time keeping items on the shelf. The dashed red line represents the average inventory to sales ratio from 2015-2019, the five-year period before supply chains were thrown out of whack by COVID-19. After the whirlwind of the last few years, it appears that firms are getting back to the inventory to sales ratios that they saw pre-pandemic – something they had been striving to do through 2021 and 2022. The overriding issue in the logistics industry is that during that whirlwind a large volume of warehousing and freight capacity was brought online, some of which is not currently being utilized as things get back to normal. There is still a mismatch between capacity and demand, but if – as this chart suggests – demand is beginning to stabilize, then supply chains should have an easier time right-sizing their logistics capacity going forward.

Respondents were asked to predict movement in the overall LMI and individual metrics 12 months from now. Expectations have been trending towards things “going back to normal” for most of 2023, that trend become even more pointed in June as all future metrics read in between 53.7 and 62.8 – all of which we would consider to be healthy levels of expansion. The reading of 59.1 for Transportation Price is the highest we have seen in 2023. When combined with the expectation of moderate Transportation Capacity expansion at 57.0, it is clear that our respondents are anticipating a rebalancing of the freight market over the next 12 months. In another shift from May, respondents also now anticipate that Inventory Levels will grow rather than contract, with associated increases in Inventory Costs and warehousing metrics coming along with them. Essentially, respondents believe that the future outlook is sunny, if somewhat muted compared to the wild swings we have seen from 2020-2023. This regression back towards the mean is consistent with what we observe in imports and overall business inventories. Whether this will also require significant freight capacity leaving the market remains to be seen. What is clear though is that LMI respondents, much like U.S. consumers, are feeling better about the economic situation of the next 12 months than they have in quite some time.

[18] U.S. Census Bureau. (2023, June 30). Total Business: Inventories to Sales Ratio 2015-2023. FRED, Federal Reserve Bank of St. Louis; FRED, Federal Reserve Bank of St. Louis. https://fred.stlouisfed.org/


