Growth is INCREASING AT AN INCREASING RATE for: Inventory Levels, Inventory Costs, Transportation Utilization and (making its first appearance in 20 months) Transportation Prices
Growth is INCREASING AT A DECREASING RATE for: Warehousing Capacity, Warehousing Utilization, Warehousing Prices, and Transportation Capacity
For the first time since September of 2019, every metric in the Logistics Managers’ Index is reading in expansion territory. The most significant move is the long-awaited return of Transportation Prices (+12.7) to expansion, its first appearance on the positive side of the ledger since June of 2022 at the start of the freight recession. This price increase is largely driven by movements by retailers to increase their Inventory Levels (+8.4) after a busy holiday season. This inventory rebuild also led to a considerable increase in the expansion of Inventory Costs (+11.0). This is a marked shift for Inventory Costs, which registered their lowest reading ever in January at 55.8. Our warehousing metrics continued their steady, sustainable rates of expansion, with all three growing at slightly slower rates (changes range from -1.0 to -1.5). We need to see a longer period of growth to call an official end to the freight recession. However, when taken together, January’s report does offer evidence that the logistics industry could be moving back into a period of growth after the long downturn that started in 2022.
Researchers at Arizona State University, Colorado State University, Florida Atlantic University, Rutgers University, and the University of Nevada, Reno, in conjunction with the Council of Supply Chain Management Professionals (CSCMP) issued this report today.
Results Overview
The LMI score is a combination of eight unique components that make up the logistics industry, including: inventory levels and costs, warehousing capacity, utilization, and prices, and transportation capacity, utilization, and prices. The LMI is calculated using a diffusion index, in which any reading above 50.0 indicates that logistics is expanding; a reading below 50.0 is indicative of a shrinking logistics industry. The latest results of the LMI summarize the responses of supply chain professionals collected in January 2024.
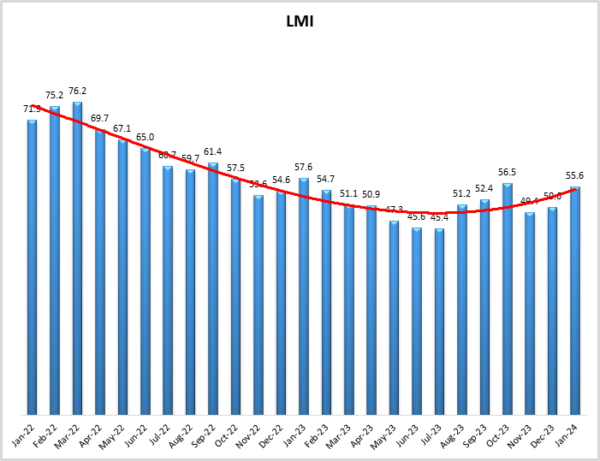
The LMI read in at 55.6 this month, up (+5.0) from December’s reading of 50.6. This is the fifth time in the last six months that the LMI has shown contraction. This growth is driven by an increase in the restocking of inventories – especially for retailers – after a busy holiday season as Americans are feeling better about the overall economy. Consumer sentiment spiked by 13.1% in January 2024 to a level of 79.0%. The combined 29% increase in sentiment from December to January is the biggest two-month jump since the end of the recession in 1991[1]. There are many reasons behind this improving sentiment. The U.S. continued to grow through the end of 2023 as GDP was up 3.3% in Q4. When taken together with the 4.9% growth in Q3, it is clear that the combination of federal spending, continued low unemployment and receding inflation have empowered U.S. consumers – whose spending increased 2.8% in Q4. On the inflation front, consumer prices only increased by 1.7% annually in Q4[2]. This has been greatly helped by moderating supply costs, which were only mildly inflationary (accounting for 0.38% inflation month-over-month for core PCE inflation) in December[3]. Additionally, this slowdown in inflation has not come at the employment cost that some economists had hypothesized would be necessary. Job growth remained robust in the U.S. as employers added 353,000 new positions in January – the most in a year. This included large increases in sectors like retail, manufacturing, and information technology[4]. Due to these improvements, in their January meeting the U.S. Federal Reserve formally changed their stance on interest rates to a more flexible position that would allow for the long-anticipated reductions in the interest rate. While rates currently remain between 5.25 and 5.5%, analysts are expecting as many as three rate cuts throughout 2024 and that the first such cut could come as early as the Spring[5]. This is good news for the freight markets as high interest rates have been the main factor holding back spending in the upstream portions of supply chains from which larger, bulkier shipments often originate.
While the U.S. economy has looked strong to start the year, The recovery has not been consistent across the globe. While economies in the U.S. and India have been robust, the Euro-zone has been much more stagnant. The Eurozone registered 0% growth in Q4 – although this was up from contraction in Q3. This downturn may let up in late 2024 if the central bank begins cutting interest rates but will continue to face headwinds in the Ukraine-Russia war and a manufacturing slump in Germany[6]. There are also continued issues in China, where real estate firm Evergrande was ordered to liquidate by a judge in Hong Kong so that they can pay back their $300 billion debt. This closure will add a complication to China’s economic recovery as the government was deeply tied into Evergrande and their real estate holdings, and will need to make some creditors whole at a time when they need to appear to be a safe bet from foreign investors[7]. There are also issues in the links between the economic engines of the world. Ocean container shipping costs have more than doubled in the last month. This increase is largely due to the Houthi rebel attacks in the Red Sea that have caused Suez Canal traffic to dip 37% in January year-over-year[8]. Compounding this is the drought-related reduction in ships passing through the Panama Canal where low water levels have cut sailings in half[9]. While these issues are troubling, they have not yet caused supply shocks similar to what we saw during COVID. For some perspective, Drewry is currently estimating the cost of shipping a 40-foot container to be around $3,7008. During COVID, this number was closer to $20,000. That being said, the sooner these issues are resolved the better. Despite these global headwinds, the I.M.F. has joined the chorus of those recognizing the ongoing economic soft landing and is now projecting global growth of 3.1% in 2024 – up from their previous projections of 2.9%. A factor behind this increased projection is a decrease in global inflation from 6.8% in 2023 to 5.8% in 2024[10].
The biggest shifts this month were in our transportation metrics. The freight market was never going to break out of a recession until supply and demand moved back towards equilibrium. While we are not willing to say that has happened yet, there were some interesting signals in January. While Knight-Swift reported 11% growth in revenue in Q4, they still had a loss of $10.7 million for the quarter – down significantly from their profit of $148 million a year earlier. Interestingly, their LTL shipments grew in Q4[11] – possibly indicative of Knight-Swift absorbing some of the business left by Yellow’s departure from the market. J.B. Hunt also reported lower earnings than had been anticipated with Q4 profits of $153.5 million – down from $201 million the year before. Similar to many other carriers, Hunt blamed this decrease on the mass inventory reductions that occurred throughout 2023[12]. UPS is facing similar issues with lower-than-expected earnings leading them to both lay off 12,000 workers and is also considering spinning off their Coyote truckload brokerage in January[13]. Freight forwarder Flexport also announced significant cuts to staffing, making their second 20% cut to jobs in the last four months[14]. Conversely, Old Dominion’s headcount is up 2% from Q3 and CFO Adam Satterfield recently told investors that they are well-positioned for an increase in demand[15].
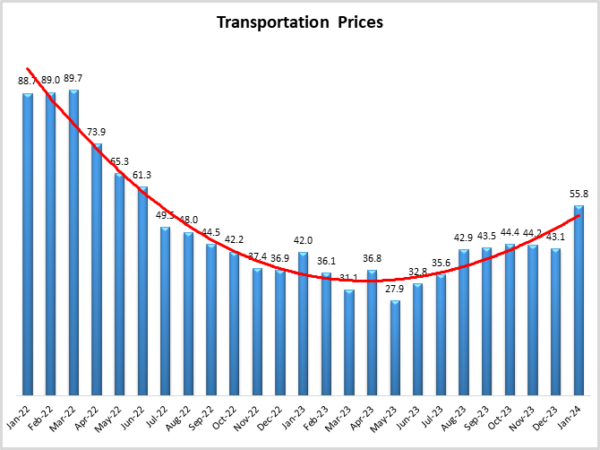
The shift in available capacity that began in earnest with Yellow’s closure last summer has continued through the start of the year. However, a rightsizing of capacity is only one side of the equation. To move back towards a period of growth there needs to be an increase in demand as well. For the past several months we have been discussing the move back towards JIT, this is movement is particularly pronounced for retailers and is in many ways a reversion back to pre-pandemic norms[16]. for JIT to work inventories have to be in constant motion, which should directly impact freight markets. A JIT-style inventory rebuild will lead to increased freight volumes and margins going forward. The first hints of this shift may be behind the considerable tightening in available Transportation Capacity (-8.8 to 54.5) and the growth in Transportation Prices (+12.7). The reading of 55.8 for Transportation Prices is the first time this metric has been in contraction territory since June 2022. This comes despite diesel fuel costing $3.87 per gallon in the last week of January which is a 75-cent reduction from the same time last year[17] – meaning that the increase is most likely due to increased demand.
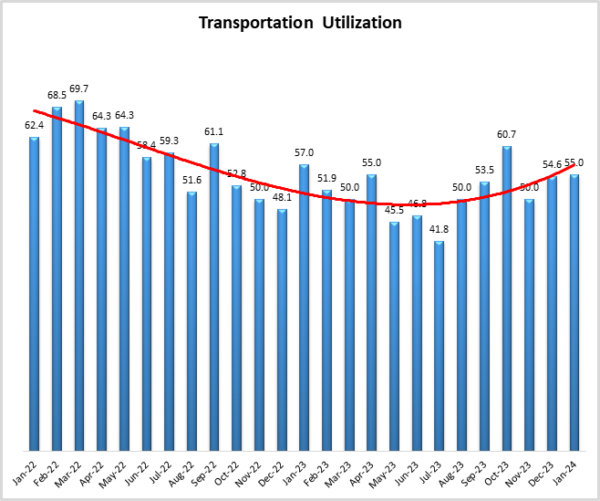
It is worth noting that Transportation Prices and Transportation Capacity inverted this month, with the former now growing slightly faster than the latter. Every time there has been an inversion between these two metrics over the 7.5 years of this index it has signaled a shift in the market. A move towards expansion would be consistent without our respondent’s future predictions and also with C.H. Robinson President Dave Bozeman’s recent statement that he is expecting a meaningful uptick in activity before the second half of 2024[18]. One point of mild hesitation before declaring the freight recession over is the movements in Transportation Utilization over the month. While Transportation Utilization was up slightly (+0.4) to 55.0, it tapered off in the second half of January – moving from a robust expansion of 61.0 from January 1-16 down to no movement at 50.0 from January 17-30. A movement towards negative utilization could signal that supply and demand are not yet in equilibrium and would put a damper on a potential freight recovery. It will be important to continue monitoring this as we move forward.
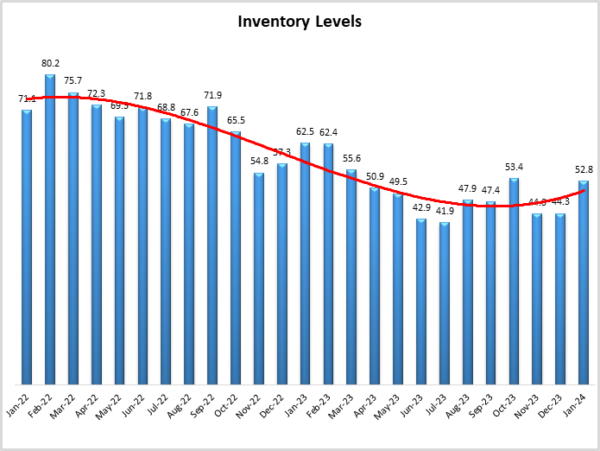
After contracting in December (as they should) Inventory Levels were up (+8.4) to a slight expansion of 52.8 in January. This mild rate of expansion suggests that while firms are re-stocking after the holiday season, they are doing so on an as-needed basis – adhering to the principles of JIT inventory management. This restocking was centered on Downstream retailers, who replenished their inventory at a rate of 62.8. Conversely, Upstream respondents saw Inventory Levels contract slightly at 47.1. This is consistent with reports that U.S. durable goods orders were flat in December after a 5.5% uptick in November. This is lower than economists had expected as orders were partially impacted by slowness in the transportation and defense sectors[19]. Additionally, the impact of lower orders is reflected in the glut of chips at tech manufacturers – something that would have been unthinkable in the semiconductor drought of 2020-2021[20]. It makes sense that the backstock is worse for tech component companies (who exist Upstream in supply chains) because they were facing the biggest backlog of unfilled orders during the height of COVID and have now been overcorrected. These “lagged” inventory issues are classic symptoms of the bullwhip effect that has buffeted supply chains over the last four years. However, respondents are predicting this dynamic will change over the coming year as Upstream firms are predicting an increase of 68.1 for their inventories, while their Downstream counterparts are holding steady to the goal of JIT with a future prediction of 50.0.
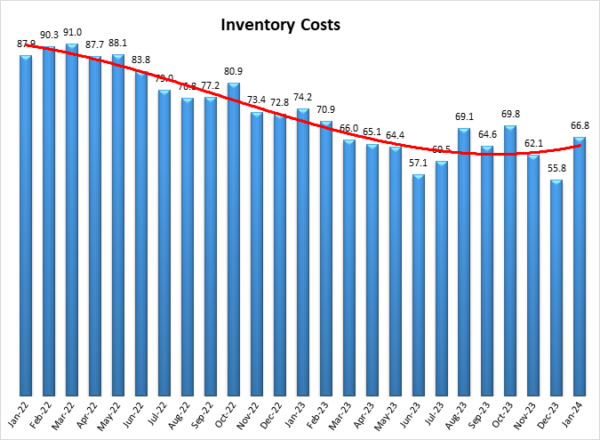
January’s moves in Inventory Costs reflect the shifts in Inventory Levels. Costs are up (+11.0) significantly to 66.8. Inventory Costs are often higher than Inventory Levels in JIT systems because of the high costs of quickly turning goods over. As would be expected, costs were higher Downstream (73.1) than Upstream (62.7). We also observe a similar dynamic shift with future predictions for Inventory Costs, with Upstream firms expecting faster rates of expansion (74.3) than their Downstream counterparts (67.9).
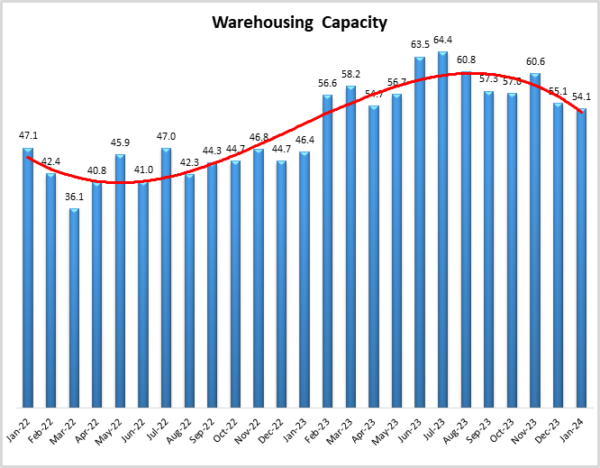
As mentioned above, there was little movement in our warehousing metrics this month. This is unsurprising as warehousing tends to move more slowly than our other metrics. It is also encouraging, as warehousing has been in a good place for the last two years and what we see in January is more of the same. Warehousing Prices continue to grow but at a slightly reduced (-1.2) rate of 65.5. Both Upstream and Downstream respondents predict these will continue to go up over the next year (at rates of 70.3 and 71.8 respectively). Prologis reported profits of $630.9 million in Q4 – up 7.5% year-over-year. Their facilities stayed busy, with 97.1% occupancy (the same as Q3). Prologis anticipates that 2024 will bring more of the same, forecasting aver occupancy between 96.5% and 97.%[21]. Prologis, with its presence in busy metros, may have been a bit of an outlier in Q4. Cushman and Wakefield estimated that the warehouse vacancy rate in the U.S. was 5.2% at the end of 2023 – up from 3.1% vacancy year-over-year. While these rates are up from pandemic-era highs, they are still lower than the 15-year average of 6.4%, indicating that warehousing space is still tight throughout the U.S. [22]. This continued tightness is reflected in the 588 million square feet of warehousing that were leased in 2023. We see a similar story in our Warehousing Capacity readings of 54.1, which are down (-1.0) from last month, as space is being added relatively slowly.
CBRE reported slowdowns in leases for facilities from big-box stores and retailers. However, they did see a significant uptick in leases for 3PLs for e-commerce[23]. Cushman Wakefield also reported an increase in warehouse rents (up 10% in Q4) which is reflective of the continued push towards e-commerce facilities in in-demand urban areas[24]. This shift is consistent with the notion that retailers have wound inventories down and need less space, but at the same time, e-commerce continues to grow as a percentage of retail. This growth is reflected in Amazon’s expectations of 11% growth following a margin of 6% in 2023[25],[26]. One factor making e-commerce more attractive is the increasing costs of traditional retail space. Landlords who cut rents of held them steady during the pandemic have largely increased rents to keep pace with higher real estate costs. Fortunately, retailers paying these higher rents have been buoyed by increased consumer spending, with vacancies at U.S. shopping centers down to 5.3% in the fourth quarter, which is the lowest level since Cushman & Wakefield began tracking the statistics in 2007[27]. This is reflected in our Warehousing Capacity metric dipping slightly (-1.5) but continuing to increase at a steady rate of 58.7. It will be interesting to see if the way that inventories are distributed will be impacted by the issues at the world’s two most important canals, a byproduct of which has been a shift in tonnage back towards the ports of Los Angeles and Long Beach[28]. This could be good news for intermodal firms as a move back toward the west coast will necessitate the re-activation of west-to-east rail and freight. However, it could also have an interesting impact on warehousing networks that had reoriented towards shippers taking advantage of East and Gulf Coast ports.
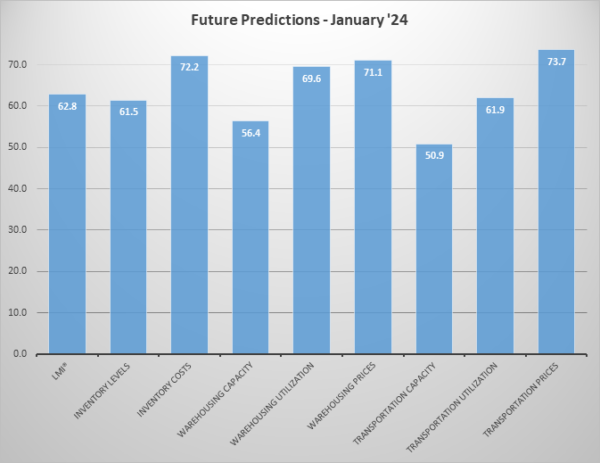
Respondents were asked to predict movement in the overall LMI and individual metrics 12 months from now. The optimism respondents have been reporting on future conditions throughout the second half of 2023 has partially come to fruition in January, but respondents expect even future growth throughout the rest of 2024. Future predictions for the overall index are 62.8 which is up (+3.9) from December’s future prediction of 59.9. This would exceed the all-time index average of 62.4 and would represent a healthy rate of expansion. This expansion is driven by increases in Inventory Levels. However, Downstream respondents are predicting high levels of turnover, which in turn are driving future predictions of Inventory Costs, Warehousing Prices, and Transportation Prices over the 70.0-point mark and into “significant expansion” territory. Warehousing and Transportation Capacity are expected to continue growing, but at slower rates (56.4 and 50.9 respectively), potentially explaining the expected increases in price. If these predictions prove to be true, the freight recession will likely end, and transportation will move back into a period of growth.
As mentioned above, there are some notable differences in expectations from our Upstream respondents (green bars) and their Downstream (purple bars) counterparts. This is most pronounced for Inventory Levels (68.1 to 50.0). This is the second consecutive month that Downstream respondents have predicted “no movement” for inventories which is yet another indication of the intention of retailers to move back to just-in-time inventory management. Upstream firms on the other hand have been keeping inventories low throughout much of 2023 and now seem to be looking to restock. This restock will be both the continually reload the stocks of their Downstream customers, and might also reflect a continuation of the ongoing manufacturing expansion in the U.S. As a result of their higher levels of inventory, Upstream firms are also predicting significantly higher rates of expansion for Warehousing Utilization (74.3 to 61.5) as well as non-significant yet notable differences in Transportation Utilization (64.9 to 56.6). While growth is expected across the supply chain, Upstream firms are predicting a marginally faster expansion in the overall index (65.2 to 59.3).
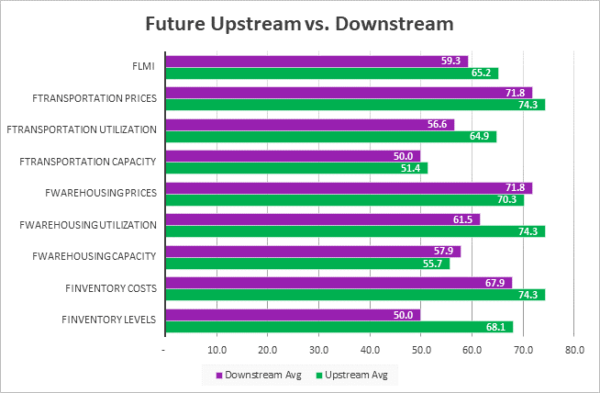
| Futures | Inv. Lev. | Inv. Costs | WH Cap. | WH Util. | WH Price | Trans Cap. | Trans Util. | Trans Price | LMI |
| Upstream | 68.1 | 74.3 | 55.7 | 74.3 | 70.3 | 51.4 | 64.9 | 74.3 | 65.2 |
| Downstream | 50.0 | 67.9 | 57.9 | 61.5 | 71.8 | 50.0 | 56.6 | 71.8 | 59.3 |
| Delta | 18.1 | 6.3 | 2.2 | 12.7 | 1.5 | 1.4 | 8.3 | 2.5 | 5.9 |
| Significant? | Yes | No | No | Yes | No | No | No | No | Marginal |
We also currently see some differences across the supply chain. Continuing the trends we saw through most of 2023, Downstream respondents (orange bars) reported faster growth in the overall index while their Upstream counterparts (blue bars). This was most pronounced in the Downstream buildup of Inventory Levels (62.8) contrasting with slight contraction (47.1) at the Upstream level. This is likely due to retailers replenishing inventories post-holiday. Due to this, Downstream firms have marginally significantly higher Inventory Costs (73.1 to 62.7). Upstream firms do report increasing Transportation Utilization (57.5 to 50.0), but overall Downstream firms reported a marginally higher score for the overall index (58.9 to 54.0). While there is more Downstream activity at the moment, Upstream firms are expecting greater growth going forward. It will be interesting to see if this results in more balanced supply chain activity as we get deeper into 2024.
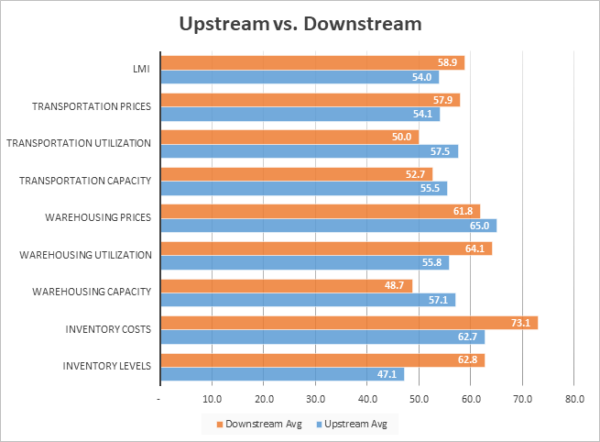
| Inv. Lev. | Inv. Costs | WH Cap. | WH Util. | WH Price | Trans Cap | Trans Util. | Trans Price | LMI | |||||||||||
| Upstream | 47.1 | 62.7 | 57.1 | 55.8 | 65.0 | 55.5 | 57.5 | 54.1 | 54.0 | ||||||||||
| Downstream | 62.8 | 73.1 | 48.7 | 64.1 | 61.8 | 52.7 | 50.0 | 57.9 | 58.9 | ||||||||||
| Delta | 15.7 | 10.4 | 8.5 | 8.3 | 3.2 | 2.8 | 7.5 | 3.8 | 5.0 | ||||||||||
| Significant? | Yes | Marginal | Marginal | No | No | No | Marginal | No | Marginal |
Responses varied from early (gold bars) to late (green bars) January. The most pronounced moves were in Inventory Costs (74.0 to 59.8) and Transportation Utilization (61.0 to 50.0), which both slowed down from early to late January. Warehousing Capacity was also looser in the second half of the month, going from a slight contraction (49.0) to an expansion (58.8). Taken altogether, the rates of expansion were faster in the first half of the month relative to the second half. This could potentially be due to a reshuffling of inventories immediately following Q4 as firms were simultaneously re-stocking and also dealing with the wave of post-holiday returns that generally come in the first half of January. Unsurprisingly given these factors, the overall LMI was also higher (58.4) in the first half of the month, although it still expanded in the back half of January (53.4).It will be interesting to see if the slower rates of expansion in the second half of January carry over to February, or if instead, the logistics industry continues to speed up.
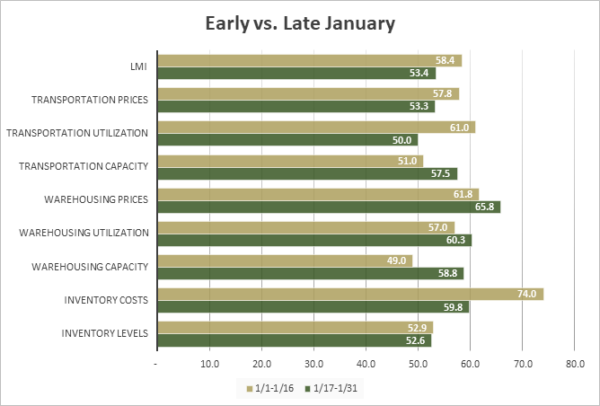
| Inv. Lev. | Inv. Costs | WH Cap. | WH Util. | WH Price | Trans Cap | Trans Util. | Trans Price | LMI | |||||||||||
| 1/1-1/16 | 52.9 | 74.0 | 49.0 | 57.0 | 61.8 | 51.0 | 61.0 | 57.8 | 58.4 | ||||||||||
| 1/17-1/31 | 52.6 | 59.8 | 58.8 | 60.3 | 65.8 | 57.5 | 50.0 | 53.3 | 53.4 | ||||||||||
| Delta | 0.3 | 14.2 | 9.8 | 3.3 | 4.0 | 6.5 | 11.0 | 4.5 | 5.0 | ||||||||||
| Significant? | No | Yes | Marginal | No | No | No | Yes | No | Marginal |
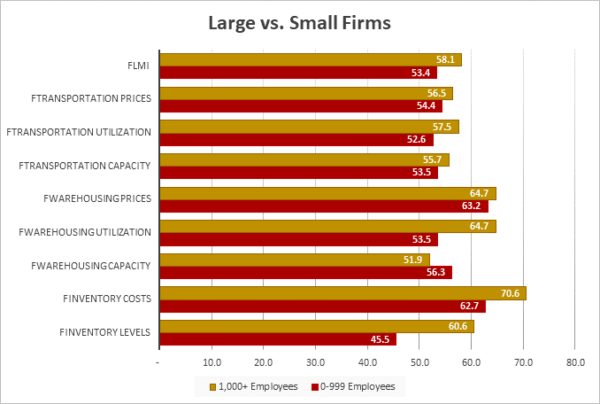
As is often the case, respondents representing larger firms (those with 1,000 employees or more, represented by gold lines) reported more activity than those representing smaller firms (those with 0-999 employees, represented by maroon lines). Smaller firms reported contractions in Inventory Levels (45.5) while their larger counterparts reported robust expansion (60.6). Larger firms also reported greater levels of expansion for both Warehousing Utilization (64.7 to 53.5) and in the overall index (58.1 to 53.4). This is a move back towards the patterns we had been seeing after December when smaller firms were busier. We had posited that this aberration from the norm may have been reflective of a quick burst by smaller firms to position inventories ahead of the holidays. Given the regression back towards more traditional differences between large and small respondents, it seems that this may have been the case. While we are in an economic recovery, the recovery has not been equal for everyone. For the logistics industry to officially move back into a boom period, smaller firms will need to join their larger counterparts in a cycle of more significant rates of growth.
| Employees | Inv. Lev. | Inv. Costs | WH Cap. | WH Util. | WH Price | Trans Cap. | Trans Util. | Trans Price | LMI |
| 0-999 | 45.5 | 62.7 | 56.3 | 53.5 | 63.2 | 53.5 | 52.6 | 54.4 | 53.4 |
| 1,000+ | 60.6 | 70.6 | 51.9 | 64.7 | 64.7 | 55.7 | 57.5 | 56.5 | 58.1 |
| Delta | 15.0 | 7.9 | 4.3 | 11.2 | 1.5 | 2.2 | 4.9 | 2.1 | 4.7 |
| Significant? | Yes | No | No | Marginal | No | No | No | No | Marginal |
The index scores for each of the eight components of the Logistics Managers’ Index, as well as the overall index score, are presented in the table below. The rate of expansion for the overall index is up (+5.0) to 55.6. This expansion is primarily driven by growth in inventory and transportation metrics (both Transportation Prices and Inventory Levels moved into expansion in January – the first time in 20 months for the former). The rate of expansion for the warehousing metrics has slowed, but we still see growth across all eight metrics. This is the first time that every metric has been in expansion territory since September 2019. This “all-growth” scenario is often associated with a transitionary period and may end soon if Transportation Capacity continues on its current trajectory and moves back into contraction.
| LOGISTICS AT A GLANCE | |||||
| Index | January 2024 Index | December 2023 Index | Month-Over-Month Change | Projected Direction | Rate of Change |
| LMI® | 55.6 | 50.6 | +5.0 | Expanding |
Faster |
| Inventory Levels | 52.8 | 44.3 | +8.4 | Expanding | From Contraction |
| Inventory Costs | 66.8 | 55.8 | +11.0 | Expanding | Faster |
| Warehousing Capacity | 54.1 | 55.1 | -1.0 | Expanding | Slower |
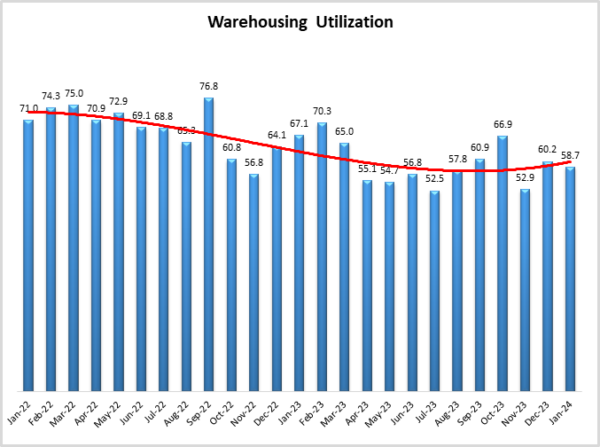
| Warehousing Utilization | 58.7 | 60.2 | -1.5 | Expanding | Slower |
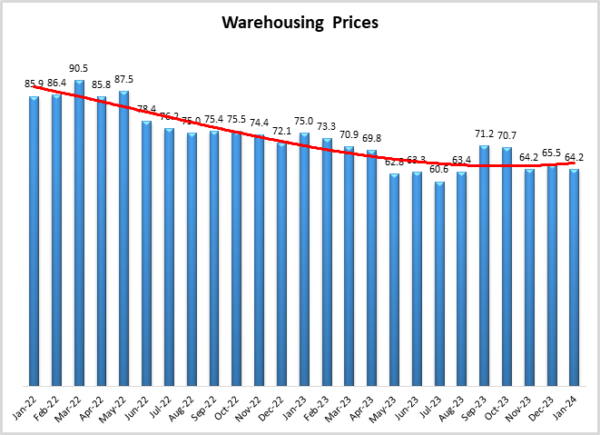
| Warehousing Prices | 64.2 | 65.5 | -1.2 | Expanding | Slower |
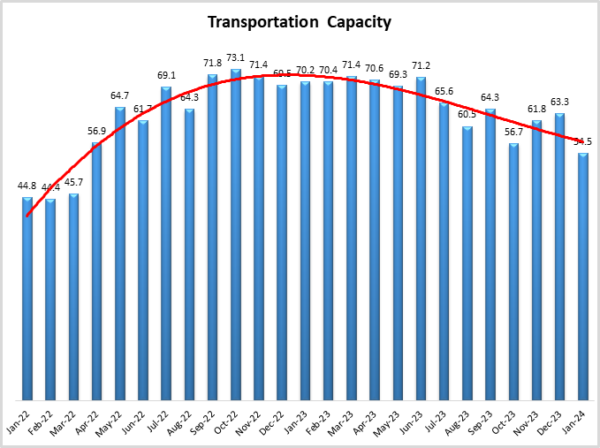
| Transportation Capacity | 54.5 | 63.3 | -8.8 | Expanding | Slower |
| Transportation Utilization | 55.0 | 54.6 | +0.4 | Expanding | From No Change |
| Transportation Prices | 55.8 | 43.1 | +12.7 | Expanding | From Contraction |
Historic Logistics Managers’ Index Scores
This period along with prior readings from the last two years of the LMI are presented table below:
| Month | LMI | Average for last 3 readings – 51.9
All-time Average – 62.4 High – 76.2 Low – 45.4 Std. Dev – 8.33
|
| Jan ‘24 | 55.6 | |
| Dec ‘23 | 50.6 | |
| Nov ‘23 | 49.4 | |
| Oct ‘23 | 56.5 | |
| Sep ‘23 | 52.4 | |
| Aug ‘23 | 51.2 | |
| July ‘23 | 45.4 | |
| June ‘23 | 45.6 | |
| May ‘23 | 47.3 | |
| Apr ‘23 | 50.9 | |
| Mar ‘23 | 51.1 | |
| Feb ‘23 | 54.7 | |
| Jan ‘23 | 57.6 | |
| Dec ‘22 | 54.6 | |
| Nov ‘22 | 53.6 | |
| Oct ‘22 | 57.5 | |
| Sep ‘22 | 61.4 | |
| Aug ‘22 | 59.7 | |
| July ‘22 | 60.7 | |
| June ‘22 | 65.0 | |
| May ‘22 | 67.1 | |
| Apr ‘22 | 69.7 | |
| Mar ‘22 | 76.2 | |
| Feb ‘22 | 75.2 | |
| Jan ‘22 | 71.9 |
LMI®
The overall index reads in at 55.6 in January, up (+5.0) from December’s reading of 50.6. When looking at the long-term trend line for the overall index it is clear that activity is picking back up after the doldrums of the summer of 2023. The overall index is still 16.3 points lower than it was two years ago when it was near all-time highs, but the reading of 55.6 likelier represents a healthier, more sustainable rate of growth. We are moving back towards the all-time average expansion rate of 62.4. The rate of expansion was marginally significantly higher Downstream (58.9) than Upstream (54.0). This difference is due to higher inventories Downstream which have led to more activity across warehousing and transportation metrics. Interestingly, future predictions suggest this dynamic may change.
When asked to predict what conditions will be over the next 12 months respondents foresee a rate of expansion of 62.8, up (+3.9) from December’s future prediction of 59.9. This is comfortably into expansion territory and close to the all-time average of 62.5. A sustained period of expansion will likely have multiple readings in the 50’s and 60’s as this would be healthy growth without veering into the overheating we saw in 2021 and early 2022. Encouragingly, both Upstream (65.2) and Downstream (59.3) are comfortably in this range.
Inventory Levels
The Inventory Level value is back into expansion territory at 52.8, up (+8.5) from 44.3 January. This is only the second time inventories have increased in the last nine months. This contraction has been in service of a push towards JIT management, which is evident in that the average change in Inventory Levels over the last 12 months has been 49.4 – very close to the level of 50.0 which would represent no change. There are differences in re-stocking speeds across the supply chain as Upstream respondents returned a value of 47.1, a slight decrease, while downstream respondents returned a post-holiday increase of 62.8. Inventory was replenished evenly through the month, reading in at 52.9 in early January and 52.6 in the second half of the month.
When asked to predict what conditions will be like 12 months from now, the average value is 61.5, up (+6.5) from December’s future prediction of 54.6 and significantly higher than the current inventory level value of 52.8. However, this is primarily driven by Upstream respondents who predict an increase of 68.1. This stands in contrast to the more JIT-minded Downstream respondents who predicted no change, at 50.0.
Inventory Costs
Inventory costs were 66.8 in January, this is a significant jump up (+11.0) from December’s reading of 55.8 which was the lowest reading for this metric in the history of the index. Cross-supply chain differences exist here as well as Upstream firms reported 62.7 a significant increase, while Downstream respondents reported 73.1, a significantly higher increase. Costs were also higher earlier in the month than late (74.0 to 59.8) which may reflect the higher costs of the returns that generally come in the first few weeks of January. Costs were also more pronounced for larger firms (70.6) than for their smaller counterparts (62.7).
Prediction for future Inventory Cost growth is 72.2, up significantly (+10.7) from December’s future prediction 61.5. down (-4.5) Upstream respondents’ future predictions averaged 74.3, while downstream respondents averaged 67.9, a similar increase. Above, we saw Upstream respondents expect larger increases in Inventory Levels, and we also saw Upstream respondents expect higher levels of Inventory Costs.
Warehousing Capacity
The Warehousing Capacity index registered in at 54.1 points for January 2024, reflecting a 1.0-point decrease from the reading last month. This reading is up 8.3 points from the reading one year ago, and up 7.0 points from the reading two years ago. In addition, there was an 8.4-point split between Upstream (57.1) and Downstream (48.7) which was marginally statistically significant (p<.1). Comparing the differences between small (<999 employees) and large (>999) employers we see that these values are 56.3 and 51.9, respectively. This 4.4-point split was not statistically significant (p>.1).
Finally, exploring the future predictions for this value we see that Warehouse Capacity is expected to continue to stay in mild expansionary territory at 56.4, down (-3.3) from December’s future prediction of 59.7. Future Upstream expectations (55.7) are lower than Downstream expectations (57.9) which may be indicative of the former building up inventories while the latter maintains a high rate of turnover.
Warehousing Utilization
The Warehousing Utilization index registered in at 58.7 points for January 2024, reflecting a 1.5-point decrease from the month prior. This reading is down 8.4 points from the reading one year ago, and down 12.3 points from the reading two years ago. In addition, there was an 8.3-point split between Upstream (55.8) and Downstream (64.1) which was not statistically significant (p>.1). Comparing the differences between small (<999 employees) and large (>999) employers we see that these values are 53.5 and 64.7, respectively. This 10.9-point split was marginally statistically significant (p<.1).
Finally, exploring the future predictions for this value we see that Warehouse Utilization is expected to continue to stay in expansionary territory at 69.6, up (+3.3) from December’s future prediction of 66.3. Future Upstream expectations (74.3) are significantly higher than Downstream expectations (61.5), correlating with the predicted buildup of Upstream inventories.
Warehousing Prices
The Warehousing Price index registered at 64.2 points for January 2024, reflecting a 1.2-point decrease. This reading is down 10.8 points from the reading one year ago, and down a sizable 21.7 points from the reading two years ago. In addition, there was a 3.2-point split between Upstream (65.0) and Downstream (61.8) which was not statistically significant (p>.1). Comparing the differences between small (<999 employees) and large (>999) employers we see that these values are 63.2 and 64.7, respectively. This 1.5-point split was not statistically significant (p>.1).
Finally, exploring the future predictions for this value we see that Warehouse Prices are expected to continue to stay in expansionary territory at 71.1 which is the same reading we saw in December and would represent a significant rate of price expansion. Future Upstream expectations (70.3) are lower than Downstream expectations (71.8). This comes despite Downstream firms expecting more capacity and slower utilization growth. Taken together, this strongly suggests that retailers are expecting to move a high volume of inventory through their supply chains quickly.
Transportation Capacity
The Transportation Capacity Index registered 54.5 percent in January 2024. This constitutes a sharp drop of 8.8 percentage points from the December reading of 63.3. The Upstream Transportation Capacity index is at 55.5, while the Downstream index is at 52.7. As such, the Transportation Capacity index had the largest drop in the last two years and this decrease in Transportation Capacity is prevalent across the supply chain.
The future Transportation Capacity index indicates 50.9 indicating expectations of a slight expansion in Transportation Capacity over the next 12 months. The Downstream future Transportation Capacity index is at 50.0 while the Upstream future Transportation Capacity index indicates 51.4. As such, expectations of relatively stable transportation are uniformly distributed over the supply chain.
Transportation Utilization
The Transportation Utilization Index registered 55.0 in January 2024. This corresponds to a small increase of .4 percentage points from last month’s reading. With this uptick, the Transportation Utilization continues to remain slightly above 50, indicating slight expansion. The Downstream Transportation Utilization Index is now at 50.0, while the Upstream index is now at 57.5, but the difference is not statistically significant.
The future Transportation Utilization Index indicates expansion at a 61.9 level for the next 12 months. The Upstream Transportation Utilization index is at 64.9 while the Downstream index is at 56.6. So, the expectations of continued growth in transportation are slightly stronger Upstream, but the difference is not statistically significant.
Transportation Prices
The Transportation Prices Index indicates 55.8 in January 2024, which corresponds to a large jump of 12.7 points from the previous month. This constitutes the largest increase in Transportation Prices index in more than 2 years and brings the index into expansion territory. The Downstream Transportation Prices index is now at 57.9, while the Upstream index is at 54.1, indicating that prince increases are spread across the supply chain.
The future index for Transportation Prices is now at 73.7, indicating strong expectations of higher Transportation Prices in the next 12 months. The Downstream Transportation Prices index is at 71.8 while the Upstream Transportation Prices index is at 73.3, so expectations of higher Transportation Prices in the next 12 months are relatively uniformly distributed across the supply chain.
About This Report
The data presented herein are obtained from a survey of logistics supply executives based on information they have collected within their respective organizations. LMI® makes no representation, other than that stated within this release, regarding the individual company data collection procedures. The data should be compared to all other economic data sources when used in decision-making.
Data and Method of Presentation
Data for the Logistics Manager’s Index is collected in a monthly survey of leading logistics professionals. The respondents are CSCMP members working at the director-level or above. Upper-level managers are preferable as they are more likely to have macro-level information on trends in Inventory, Warehousing and Transportation trends within their firm. Data is also collected from subscribers to both DC Velocity and Supply Chain Quarterly as well. Respondents hail from firms working on all six continents, with the majority of them working at firms with annual revenues over a billion dollars. The industries represented in this respondent pool include, but are not limited to: Apparel, Automotive, Consumer Goods, Electronics, Food & Drug, Home Furnishings, Logistics, Shipping & Transportation, and Warehousing.
Respondents are asked to identify the monthly change across each of the eight metrics collected in this survey (Inventory Levels, Inventory Costs, Warehousing Capacity, Warehousing Utilization, Warehousing Prices, Transportation Capacity, Transportation Utilization, and Transportation Prices). In addition, they also forecast future trends for each metric ranging over the next 12 months. The raw data is then analyzed using a diffusion index. Diffusion Indexes measure how widely something is diffused or spread across a group. The Bureau of Labor Statistics has been using a diffusion index for the Current Employment Statics program since 1974, and the Institute for Supply Management (ISM) has been using a diffusion index to compute the Purchasing Managers Index since 1948. The ISM Index of New Orders is considered a Leading Economic Indicator.
We compute the Diffusion Index as follows:
PD = Percentage of respondents saying the category is Declining,
PU = Percentage of respondents saying the category is Unchanged,
PI = Percentage of respondents saying the category is Increasing,
Diffusion Index = 0.0 * PD + 0.5 * PU + 1.0 * PI
For example, if 25 say the category is declining, 38 say it is unchanged, and 37 say it is increasing, we would calculate an index value of 0*0.25 + 0.5*0.38 + 1.0*0.37 = 0 + 0.19 + 0.37 = 0.56, and the index is increasing overall. For an index value above 0.5 indicates the category is increasing, a value below 0.5 indicates it is decreasing, and a value of 0.5 means the category is unchanged. When a full year’s worth of data has been collected, adjustments will be made for seasonal factors as well.
Logistics Managers Index
Requests for permission to reproduce or distribute Logistics Managers Index Content can be made by contacting in writing at: Dale S. Rogers, WP Carey School of Business, Tempe, Arizona 85287, or by emailing [email protected] Subject: Content Request.
The authors of the Logistics Managers Index shall not have any liability, duty, or obligation for or relating to the Logistics Managers Index Content or other information contained herein, any errors, inaccuracies, omissions, or delays in providing any Logistics Managers Index Content, or for any actions taken in reliance thereon. In no event shall the authors of the Logistics Managers Index be liable for any special, incidental, or consequential damages, arising out of the use of the Logistics Managers Index. Logistics Managers Index, and LMI® are registered trademarks.
About The Logistics Manager’s Index®
The Logistics Manager’s Index (LMI) is a joint project between researchers from Arizona State University, Colorado State University, University of Nevada, Reno, Florida Atlantic University, and Rutgers University, supported by CSCMP. It is authored by Zac Rogers Ph.D., Steven Carnovale Ph.D., Shen Yeniyurt Ph.D., Ron Lembke Ph.D., and Dale Rogers Ph.D.
[1] Hsu, J. (2024, January 26). Surveys of Consumers. Survey of Consumers University of Michigan – January 2024. http://www.sca.isr.umich.edu/
[2] Casselman, B. (2024, January 25). U.S. Economy Grew at 3.3% Rate in Latest Quarter. The New York Times. https://www.nytimes.com/2024/01/25/business/economy/economy-q4-gdp.html
[3] Shapiro, A. (2024, January 31). Supply- and Demand-Driven PCE Inflation—Decmeber 2023. San Francisco Fed. https://www.frbsf.org/economic-research/indicators-data/supply-and-demand-driven-pce-inflation/
[4] Bureau of Labor Statistics. (2024). THE EMPLOYMENT SITUATION — JANUARY 2024. BLS. www.bls.gov/news.release/pdf/empsit.pdf
[5] Timiraos, N. (2024, January 31). Fed Signals Cuts Are Possible but Not Imminent as It Holds Rates Steady. WSJ. https://www.wsj.com/economy/central-banking/fed-leaves-rates-steady-and-opens-door-wider-to-cuts-d10a107d
[6] Alderman, L. (2024, January 30). Eurozone Economy Flatlines, Raising Concerns About Falling Behind. The New York Times. https://www.nytimes.com/2024/01/30/business/eurozone-economy-gdp.html
[7] Stevenson, A. (2024, January 29). Evergrande Will Be Dismantled, a ‘Big Bang’ End to Years of Stumbles. The New York Times. https://www.nytimes.com/2024/01/28/business/china-evergrande.html
[8] Berger, P. (2024b, January 21). Ocean Shipping Rates Surge as Red Sea Attacks Continue. Wall Street Journal. https://www.wsj.com/articles/ocean-shipping-rates-surge-as-red-sea-attacks-continue-2c21beeb
[9] Rojanasakul, M. (2024, January 26). Panama Canal Drought Slows Cargo Traffic. The New York Times. https://www.nytimes.com/interactive/2024/01/26/climate/panama-canal-drought-shipping.html
[10] Rappeport, A. (2024, January 30). Global Economy Is Heading Toward ‘Soft Landing,’ I.M.F. Says. The New York Times. https://www.nytimes.com/2024/01/30/business/imf-global-economic-outlook.html
[11] Glickman, B., & Young, L. (2024, January 25). Knight-Swift CEO Sees Continued Soft Trucking Demand. Wall Street Journal. https://www.wsj.com/articles/knight-swift-ceo-sees-continued-soft-trucking-demand-c70cd7e9
[12] Berger, P., & Feuer, W. (2024, January 18). J.B. Hunt Profit Falls Amid Weak Freight Demand. Wall Street Journal. https://www.wsj.com/articles/j-b-hunt-profit-falls-amid-weak-freight-demand-f27b53c1
[13] Fung, E. (2024, January 30). UPS to Cut 12,000 Jobs and Mandate Return to Offices Five Days a Week. WSJ. https://www.wsj.com/business/earnings/ups-to-cut-12-000-jobs-as-delivery-business-slows-d832f1d2
[14] Young, L. (2024c, January 26). Flexport Plans to Cut Another 20% of Staff. Wall Street Journal. https://www.wsj.com/articles/flexport-plans-to-cut-another20-of-staff-c4c3be60
[15] Maiden, T. (2024, January 31). Old Dominion readies for eventual turnaround. FreightWaves. https://www.freightwaves.com/news/old-dominion-readies-for-eventual-turnaround
[16] Young, L. (2024b, January 24). Retailers Return to Bringing in Inventory ‘Just in Time.’ Wall Street Journal. https://www.wsj.com/articles/retailers-return-to-bringing-in-inventory-just-in-time-4613e3ee
[17] U.S. Energy Information Administration. (2024, January 29). Gasoline and Diesel Fuel Update—January 29, 2024. Petroleum & Other Liquids. https://www.eia.gov/petroleum/gasdiesel/index.php
[18] Kickham, V. (2024, January 25). Sluggish outlook prevails, freight leaders say | DC Velocity. https://www.dcvelocity.com/articles/59709-sluggish-outlook-prevails-freight-leaders-say
[19] Kirby, J. (2024, January 25). U.S. Durable-Goods Orders Stable in December. WSJ. https://www.wsj.com/economy/u-s-durable-goods-orders-stable-in-december-a54539df
[20] Bowman, R. J. (2024, January 22). That Was Fast: High-Tech Component Inventories Shift From Shortage to Glut | SupplyChainBrain. Supply Chain Brain. https://www.supplychainbrain.com/articles/38887-that-was-fast-high-tech-component-inventories-shift-from-shortage-to-glut
[21] Glickman, B. (2024, January 17). Prologis Profit Rises as Occupancy Holds Steady. Wall Street Journal. https://www.wsj.com/articles/prologis-profit-rises-as-occupancy-holds-steady-484d42ac
[22] Young, L. (2024a, January 4). Warehouse Availability Surges to Highest Level Since the Pandemic. Wall Street Journal. https://www.wsj.com/articles/warehouse-availability-surges-to-highest-level-since-the-pandemic-bf1e0724
[23] Solomon, M. (2024, January 26). Mega-warehouse facility leasing slowed in 2023, CBRE says. FreightWaves. https://www.freightwaves.com/news/mega-warehouse-facility-leasing-slowed-in-2023-cbre-says
[24] Young, L. (2024a, January 4). Warehouse Availability Surges to Highest Level Since the Pandemic. Wall Street Journal. https://www.wsj.com/articles/warehouse-availability-surges-to-highest-level-since-the-pandemic-bf1e0724
[25] Gallagher, D. (2024, January 29). Amazon Can’t Afford a Race to the Bottom. WSJ. https://www.wsj.com/finance/stocks/amazon-cant-afford-a-race-to-the-bottom-f7831b49
[26] A margin which almost makes you think they didn’t need to add commercials into Amazon Prime in the last week of January. We’re all for a healthy margin, but here at LMI Headquarters we like it when “Reacher” is ad-free.
[27] King, K. (2024, January 29). For Retailers, Business Is Back and Landlords Say No More Rent Discounts. WSJ. https://www.wsj.com/real-estate/commercial/retail-landlords-rent-discounts-ending-b07723ec
[28] Berger, P. (2024a, January 16). California’s Long-Embattled Ports Are Winning Back Imports. Wall Street Journal. https://www.wsj.com/articles/californias-long-embattled-ports-are-winning-back-imports-b21c9997


