According to a sample of North American logistics executives, growth continued across the logistics sector in January 2019. Warehousing and Inventory metrics are trending up. This is the fourth consecutive drop in Transportation Prices, a break from the rampant growth that existed from much of 2018.
Researchers at Arizona State University, Colorado State University, Rochester Institute of Technology, Rutgers University, and the University of Nevada, Reno, and in conjunction with the Council of Supply Chain Management Professionals (CSCMP) issued this report today.
Results Overview
The LMI score is a combination eight unique other components that make up the logistics industry, including: inventory levels and costs, warehousing capacity, utilization, and prices, and transportation capacity, utilization, and prices. The LMI is calculated using a diffusion index, in which any reading above 50 percent indicates that logistics is expanding; a reading below 50 percent is indicative of a shrinking logistics industry. The latest results of the LMI summarize the responses of over 130 supply chain professionals collected in January 2019.
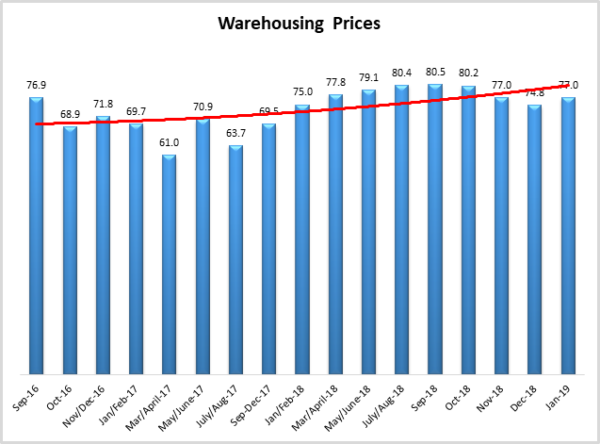
Warehouse Prices (76.96) are growing faster than Transportation Prices (69.38) for the second straight month. Before December 2018, this had not happened since November/December 2016. This shift is partially explained by available levels of Warehouse and Transportation Capacity. While Warehouse Capacity is up (+1.0), it’s index score of 49.16 indicates that it is still slightly decreasing – although at a rate that is close to 50.0, indicating essentially no change. When combined with the increase in Inventory Levels (66.5), this month’s reading suggests that demand for warehouse space is increasing while supply is essentially unchanged. This mismatch in supply in demand is a key driver behind the increase (+2.2) in Warehouse Price to 76.96.
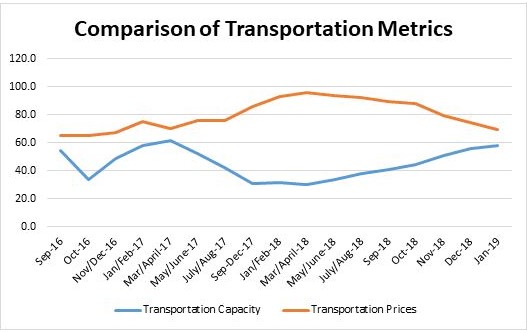
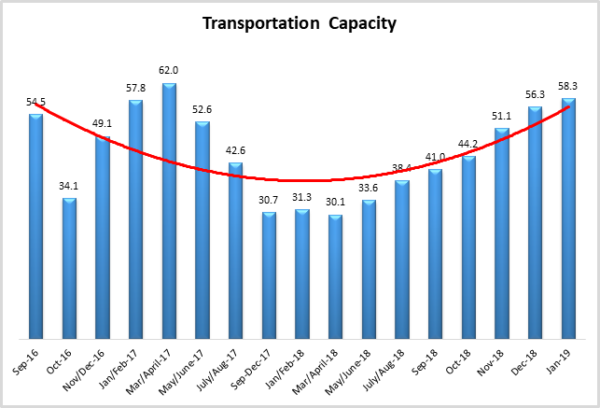
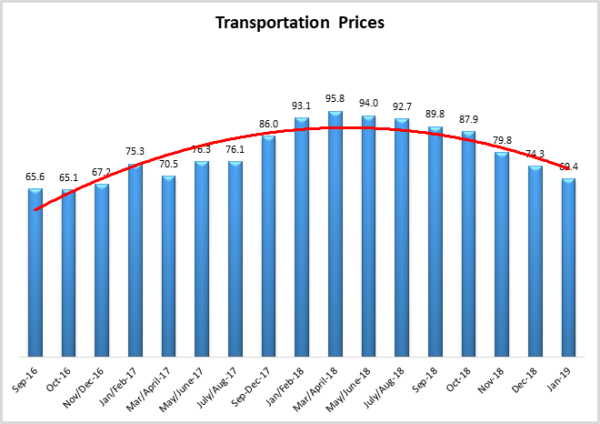
Conversely, Transportation Capacity (58.33) is growing at an increasing rate (+2.1) for the third straight month. It had been in a state of contraction from June 2017 to October 2018. This likely reflects the record truck orders that were placed in the third quarter of 2018. As Transportation Capacity has increased, the rate of Transportation Price growth has trended in the opposite direction. The current index score of 69.38 represents the lowest rate of growth since December 2016. The index scores of Transportation Capacity and Transportation Price over the 29 months of the LMI® are presented in the figure below. A clear inverse relationship exists between the two, in March/April 2018, Transportation Prices were 65 points higher than Transportation Capacity. In January 2019 this gap shrunk to just over 11 points.
Evidence suggests that the logistics industry continues to expand, but at an increasingly slower rate than for much of 2018. In the 28 months of the LMI® Transportation Price has been that metric that is most closely tied to U.S. economic activity. It is somewhat surprising that the yearly low reading for Transportation Price (74.34) comes in what should be one of the busiest retail months of the year. Again, this still shows growth, but at a much slower pace than earlier in the year with readings in the 80’s and 90’s.
As mentioned above, we recorded much slower rates of growth in many metrics in December. Traditionally the fourth quarter, and the holiday season in particular, see an increased level of economic activity. However, Transportation Prices, Transportation Utilization and Warehouse Prices register their lowest readings of the entire year. Transportation Costs are at their lowest rate of growth since March/April 2017. This is likely tied to the continuing increase in Transportation Capacity (56.25) which is growing at its highest rate since March/April 2017, and since then had primarily been contracting. We also register the second lowest rates of growth for Warehouse Utilization and the overall LMI. These metrics are all still growing. Whether or not the diminishing rates are reflective of the other recent indicators (the Dow, truck orders, PMI, etc.) that the economy may be slowing down remains to be seen. However, we have now registered a significant drop in growth rates for two consecutive readings.
It is interesting that both Inventory Levels (66.25) and Inventory Costs (75.65 ticked up in January 2019. This may indicate that inventories are being replenished following the holiday season. Whether or not an influx of holiday-related returns plays in to this remains unclear. Increased Inventory Costs may also be tied to the continuing growth in Warehousing Prices.
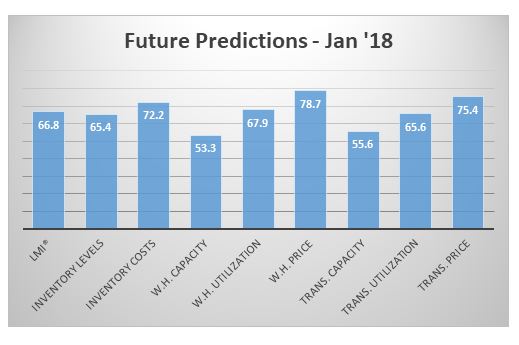
Future predictions indicate that respondents predict an increase in all eight LMI® metrics over the next 12 months. Both Transportation and Warehouse Prices are predicted to grow at slightly higher rates than they are currently. Capacity is anticipated to be up across the board. It is worth noting that over the past year LMI® respondents have been very accurate in their future predictions. Whether or not this period’s dip in growth rates will have an impact on this accuracy remains to be seen. Future predictions for LMI components 12 months from now are displayed below:
 The index scores for each of the eight components of the Logistics Managers’ Index, as well as the overall index score, are presented in the table below. Inventory Levels, Inventory Costs, Warehousing Utilization, Warehouse Prices and Transportation Capacity are increasing at increasing rates. Transportation Utilization and Transportation Price are increasing at decreasing rates – although they are all still growing. Finally, Warehousing Capacity is decreasing but at a decreasing rate, although 49.16 is close to a steady state of 50.0. The overall LMI® index score is up slightly and indicates growth in the logistics industry.
| LOGISTICS AT A GLANCE | |||||
| Index | January 2019 Index | December 2018 Index | Month-Over-Month Change | Projected Direction | Rate of Change |
| LMI® | 65.20 | 64.65 | +0.6 | Growing | Increasing |
| Inventory Levels | 66.25 | 63.06 | +3.2 | Growing | Increasing |
| Inventory Costs | 75.65 | 72.73 | +2.9 | Growing | Increasing |
| Warehousing Capacity | 49.16 | 48.18 | +1.0 | Contracting | Increasing |
| Warehousing Utilization | 65.96 | 64.60 | +1.4 | Growing | Increasing |
| Warehousing Prices | 76.96 | 74.76 | +2.2 | Growing | Increasing |
| Transportation Capacity | 58.33 | 56.25 | +2.1 | Growing | Increasing |
| Transportation Utilization | 59.92 | 63.27 | -3.4 | Growing | Decreasing |
| Transportation Prices | 69.38 | 74.34 | -5.0 | Growing | Decreasing |
Historic Logistics Managers’ Index Scores
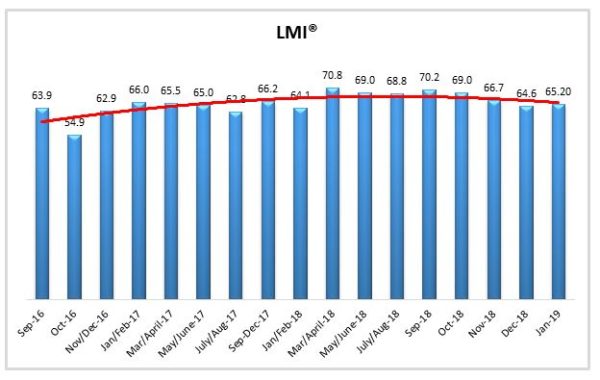
This period’s along with the prior 15 readings of the LMI are presented table below:
| Month | LMI | Average for previous readings – 65.6
High – 70.8 Low – 54.9 Std. Dev – 3.60 |
| January ‘19 | 65.20 | |
| December ‘18 | 64.65 | |
| November ‘18 | 66.6 | |
| October ‘18 | 69.01 | |
| September ‘18 | 70.22 | |
| July/August ‘18 | 68.8 | |
| May/June ‘18 | 69.0 | |
| March/April ‘18 | 70.8 | |
| January/February‘18 | 64.1 | |
| September-December ‘17 | 66.18 | |
| July/August ‘17 | 62.78 | |
| July/August ‘17 | 65.0 | |
| Mar/April ‘17 | 65.5 | |
| Jan/Feb ‘17 | 66.0 | |
| Nov/Dec ‘16 | 62.9 | |
| Oct ‘16 | 54.9 | |
| Sep ‘16 | 63.9 |
LMI®
The overall LMI index is 65.20 in the January 2019 reading. This is up slightly from the rate of growth in from December (64.65). This is the first increase in the overall index score since September. Seven of the eight metrics are reporting a state of growth (although two of these are at a decreasing rate), with only Warehousing Capacity currently contracting. January’s reading is in line with the average index score of 65.6. This months’ reading is brought up primarily by increases in Inventory Costs, Warehouse Prices, and Transportation Capacity.
Looking forward, respondents predict the overall LMI will continue to grow over the next year, predicting an overall index score of 66.8. This indicates an expectation of steady if unspectacular growth in the logistics industry through 2019.
Every reading since the beginning of this project in September of 2016 has indicated growth in the logistics industry. The January 2019 reading does not buck this trend, as 65.20 is well above the growth/contraction threshold of 50.0.
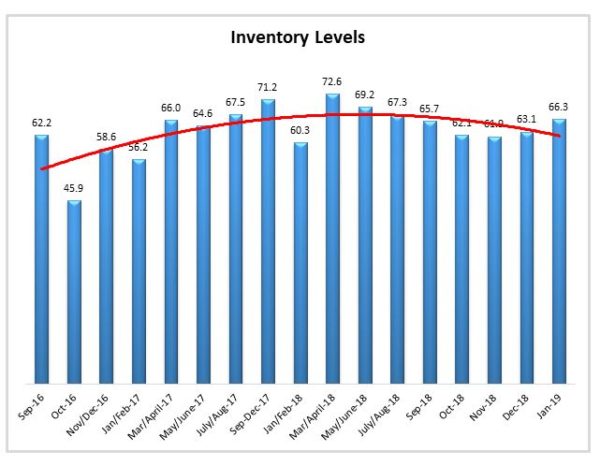
Inventory Levels
The Inventory Level index is 66.3, which indicates that inventory levels are continuing to rise. Because this is well above 50, inventory levels are still growing, and this is the second month of increasing values. This value is 6 points above the level a year ago at this time, of 60.3. January last year saw a significant, but temporary drop from December before increasing back up to over 72, followed by a downward trending period. After remaining stable in October and November, inventory levels have been slowly increasing. As all values above 50 indicate growing inventory levels, the string of uninterrupted growth that started in November/December of 2016 continues.
The long-term trendline shows that values are expected to stay in the growth region, that is, above 50, for the near future. If current trends continue, it could fall below 50 at some point in the future. However, when asked to predict what will conditions will be like 12 months from now, the average value is 65.7, indicating inventory levels are expected to be higher than current levels. This value is scarcely last month’s year-ahead prediction of 66.7, which indicates a consistent prediction of increasing levels next year.
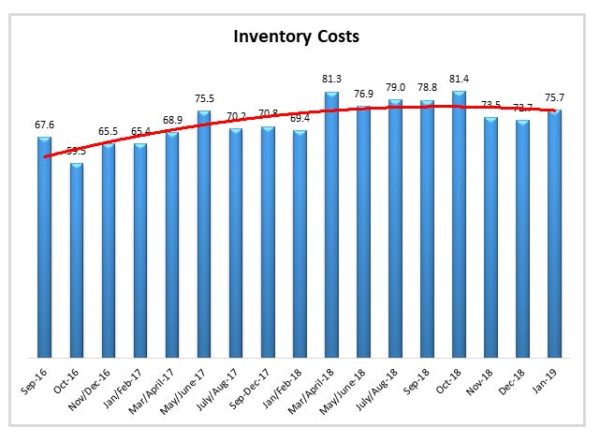
Inventory Costs
Given the high levels of inventory growth, it is not surprising that inventory costs are also increasing. The current value is 75.7. The current value is slightly higher than the previous value of 72.7. The last three readings have been in the same range, representing a stable growth rate after a significant decline from October. The current value is 6.3 points higher than the 69.4 value last year at this time. The current value is also above the long-term average of 72.3, another sign that costs are expected to rise by a greater than expected amount. Inventory Cost growth has been increasing, but seems to be flattening.
Taking this graph and the previous graph of inventory values together, both inventory levels and inventory costs seem to be continuing to grow. This could be related to the fact that warehousing capacity is decreasing slightly. Because inventory levels are continuing to increase, and warehousing capacity is decreasing, it seems quite likely costs will continue to rise. Respondents agree with this analysis. When asked about what they expect inventory costs to be like 12 months from now, the index value is 72.2, a slight decrease over last month’s value of 76.3. Respondents clearly expect inventory costs to continue to be high for the next 12 months.
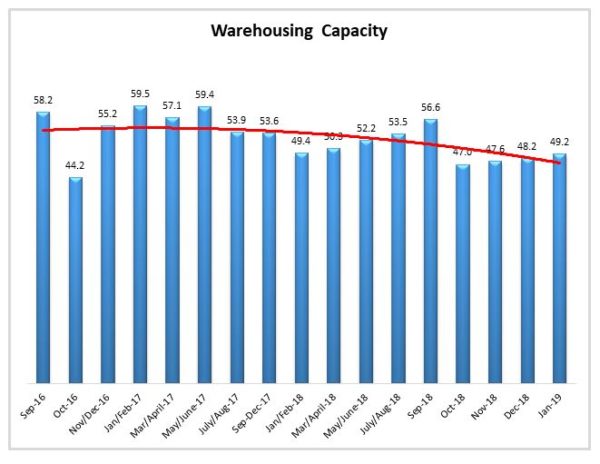
Warehousing Capacity
The Warehousing Capacity Index registered 49.2 percent in January 2019. This represents slight increase (1%) from the December 2018 reading of 48.2, and a nearly 12 point decrease from the September 2018 reading of 56.64 and is still sharply down from the Jan/Feb 2017 high of 59.5. This is the fifth lowest reading ever recorded in the LMI®. It would appear that warehousing capacity is contracting, now four months in a row, though at a slightly less rapid pace than the month prior.
Looking forward at the next 12 months, the predicted Warehousing Capacity index is 53.3. This is close to the break-even of 50.0, indicating that respondents are not hopeful we will see significant gains in available capacity over the next 12 months.
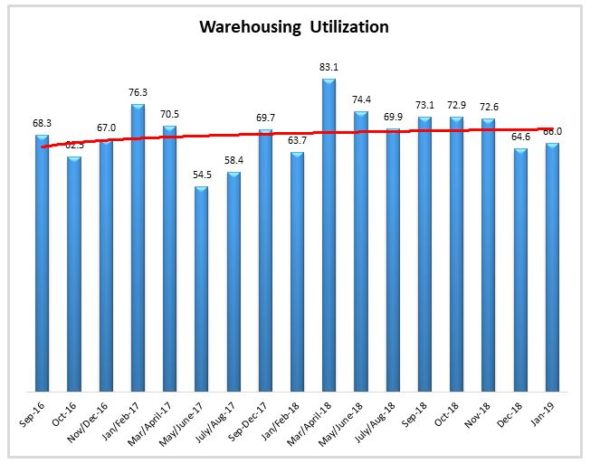
Warehousing Utilization
The Warehousing Utilization Index registered 66.00 percent in January 2019. This is a marginal increase of 1.4% from the December 2018 reading of 64.6, and a still very sharp decline of 6.62 percentage points from the November 2018. This is the sixth lowest level of Warehousing Utilization overall, and is up only 11.5 points from the all-time low of 54.5 in June 2017. This is the second month of increased utilization, along with the decreasing capacity, suggesting that the market may be tightening.
Looking forward at the next 12 months, the predicted Warehousing Utilization index is 67.9, indicating that firms anticipate utilizing existing warehouse capacity consistently over the next year.
Warehousing Prices
Finally, the Warehousing Prices Index registered 77.0 percent in January 2019. This is a somewhat sharp increase of 2.2 percentage points from the December 2018 reading of 74.8, and a rebound to the November 2018 level. This also represents a break in the three months in a row of a decreasing rate of increase on warehousing prices. With the decrease in capacity, the increase in utilization, this increase in the rate of price falls in line with market conditions.
Looking forward at the next 12 months, the predicted Warehousing Prices index is 78.7. This indicates that firms are expecting consistent, significant growth in Warehouse Prices overs the next 12 months.
Transportation Capacity
The Transportation Capacity Index registered 58.3 percent in January 2019. This is an increase of 2 percentage points from the December 2018 reading of 56.3. The upward trend in transportation capacity is continuing, the latest reading being the seventh consecutive period showing an increase from the previous reading. Further, a reading above 50 percent indicates expansion, and this is the third consecutive reading above 50.
It should be noted the data also indicates a score of 55.6 percent for the next year. This is 4.2 percent decrease in future expectations when compared to December 2018 data.
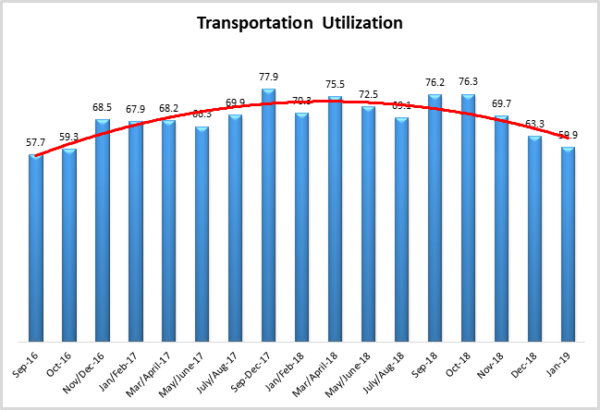
Transportation Utilization
The Transportation Utilization Index registered 59.9 percent in January 2019. This is a decrease of 3.4 percentage points from the December 2018 reading of 63.3. This score indicates a continuing expansion trend in transportation utilization, but the rate of the increase is continuing to slow down. Historically, it constitutes the third lowest value ever indicated by the Transportation Utilization Index.
Our future Transportation Utilization Index indicates a 65.6 percent level for the next 12 months. Future expectations are also down 5.8 percent than their December 2018 levels.
Transportation Prices
The Transportation Prices Index registered 69.4 percent in January 2019. This is 4.9 percent lower than the December 2018 transportation prices reading of 74.3. Transportation Prices Index is continuing to come off its historical highs, with the latest reading being the seventh consecutive decrease from the all-time high registered in March-April 2018. The upside down “U-shape” trend of Transportation Prices over time is a nearly perfect opposite of the U-shaped trend of Transportation Capacity over the life of the LMI.
The future expectations for transportation prices are at 75.4 percent, indicating that the upward pressure on transportation prices is likely to persist over the next 12 months. Yet, it should be noted that the future expectations are also 5.4 percent lower than they were in December.
About This Report
The data presented herein are obtained from a survey of logistics supply executives based on information they have collected within their respective organizations. LMI® makes no representation, other than that stated within this release, regarding the individual company data collection procedures. The data should be compared to all other economic data sources when used in decision-making.
Data and Method of Presentation
Data for the Logistics Manager’s Index is collected in a monthly survey of leading logistics professionals. The respondents are CSCMP members working at the director-level or above. Upper-level managers are preferable as they are more likely to have macro-level information on trends in Inventory, Warehousing and Transportation trends within their firm. Data is also collected from subscribers to both DC Velocity and Supply Chain Quarterly as well. Respondents hail from firms working on all six continents, with the majority of them working at firms with annual revenues over a billion dollars. The industries represented in this respondent pool include, but are not limited to: Apparel, Automotive, Consumer Goods, Electronics, Food & Drug, Home Furnishings, Logistics, Shipping & Transportation, and Warehousing.
Respondents are asked to identify the monthly change across each of the eight metrics collected in this survey (Inventory Levels, Inventory Costs, Warehousing Capacity, Warehousing Utilization, Warehousing Prices, Transportation Capacity, Transportation Utilization, and Transportation Prices). In addition, they also forecast future trends for each metric ranging over the next 12 months. The raw data is then analyzed using a diffusion index. Diffusion Indexes measure how widely something is diffused, or spread across a group. The Bureau of Labor Statistics has been using a diffusion index for the Current Employment Statics program since 1974, and the Institute for Supply Management (ISM) has been using a diffusion index to compute the Purchasing Managers Index since 1948. The ISM Index of New Orders is considered a Leading Economic Indicator.
We compute the Diffusion Index as follows:
PD = Percentage of respondents saying the category is Declining,
PU = Percentage of respondents saying the category is Unchanged,
PI = Percentage of respondents saying the category is Increasing,
Diffusion Index = 0.5 * PD + 0.5 * PU + 1.0 * PI
For example, if 25% say the category is declining, 38% say it is unchanged, and 37% say it is increasing, we would calculate an index value of 0*0.25 + 0.5*0.38 + 1.0*0.37 = 0 + 0.19 + 0.37 = 0.56, and the index is increasing overall. For an index value above 0.5 indicates the category is increasing, a value below 0.5 indicates it is decreasing, and a value of 0.5 means the category is unchanged. When a full year’s worth of data has been collected, adjustments will be made for seasonal factors as well.
Logistics Managers Index
Requests for permission to reproduce or distribute Logistics Managers Index Content can be made by contacting in writing at: Dale S. Rogers, WP Carey School of Business, Tempe, Arizona 85287, or by emailing [email protected] Subject: Content Request.
The authors of the Logistics Managers Index shall not have any liability, duty, or obligation for or relating to the Logistics Managers Index Content or other information contained herein, any errors, inaccuracies, omissions or delays in providing any Logistics Managers Index Content, or for any actions taken in reliance thereon. In no event shall the authors of the Logistics Managers Index be liable for any special, incidental, or consequential damages, arising out of the use of the Logistics Managers Index. Logistics Managers Index, and LMI® are registered trademarks.
About The Logistics Manager’s Index®
The Logistics Manager’s Index (LMI) is a joint project between researchers from Arizona State University, Colorado State University, University of Nevada, Reno, Rochester Institute of Technology and Rutgers University, supported by CSCMP.