- Growth is INCREASING AT AN INCREASING RATE for Inventory Levels, Warehousing Utilization, Transportation Capacity, Transportation Utilization, and Transportation Prices
- Growth is INCREASING AT A DECREASING RATE for Inventory Costs and Warehousing Capacity
- Growth is HOLDING STEADY for Warehousing Prices
The Logistics Manager’s Index reads in at 56.5 in February 2024. This is up (+0.9) from January’s reading of 55.6 and is tied with October 2023 for the highest reading for the overall index in the last year. For the second month in a row, this growth is bolstered by expansion in all eight sub-metrics captured in the index. This is driven by a continued expansion in Inventory Levels (58.5) which has led to a tightening in Warehousing Capacity (52.8) and growth across all three transportation metrics. Particularly notable is the expansion in Transportation Prices, which at 57.6 have reached their fastest rate of growth since the start of the freight recession in June 2022. Interestingly, Transportation Capacity was also up this month to 60.9, bumping it higher than Transportation Prices and suggesting that we have not yet entered a true growth period in the freight market.
Researchers at Arizona State University, Colorado State University, Florida Atlantic University, Rutgers University, and the University of Nevada, Reno, and in conjunction with the Council of Supply Chain Management Professionals (CSCMP) issued this report today.
Results Overview
The LMI score is a combination of eight unique components that make up the logistics industry, including inventory levels and costs, warehousing capacity, utilization, and prices, and transportation capacity, utilization, and prices. The LMI is calculated using a diffusion index, in which any reading above 50.0 indicates that logistics is expanding; a reading below 50.0 is indicative of a shrinking logistics industry. The latest results of the LMI summarize the responses of supply chain professionals collected in February 2024.
The LMI read in at 56.5 this month, up (+0.9) from January’s reading of 55.6. This is the sixth time in the last seven months that the LMI has shown expansion. This growth is driven by continued progress in transportation and the buildup of inventories upstream at the manufacturing and wholesale levels. The overall index is up, but still below the all-time average of 62.4 – which in many ways epitomizes the current slow but positive and steady state of the U.S. economy.
The University of Michigan Consumer Confidence Index stayed high in February, reading in at 76.9. While this is down (-2.4) from January’s reading of 79.0 it is up 14.9% from the same period last year[1]. While core inflation in the U.S. was up by 0.4 percent in January, the PCE index (the Fed’s preferred measure) was only up 2.4 percent, which is down from the 2.6 seen in December. When taken together, the economy continues to grow, and consumer prices are largely moderating – though likely not quickly enough for the Fed to consider a cut to interest rates at their meeting in mid-March[2]. One of the factors behind the strong U.S. economy is immigration. Net immigration from August 2022 to July 2023 was the highest it has been since 2017 and immigrants now make up 18.6 percent of the labor force in the U.S., which has been a relief to some businesses that struggled with labor during the pandemic years. This is largely driven by tripling in refugees how have been granted asylum and quickly entered the labor force (up to 1.2 million from 423,000 year-over-year). This is bolstered by increased domestic energy production as the U.S. has continued to be a net exporter of energy[3]. While it may be politically complicated, abundant labor and abundant energy is a combination that is unique to the U.S. and is likely a major factor behind the increased pace of economic recovery seen in the U.S. relative to other developed nations.
Eurozone inflation was down to a 2.6 percent annual increase in February which is lower than expected and down from the 2.8 seen in January. This is spurred on by lower energy prices across the continent[4]. The February Chinese service PMI was up to 51 in February which is its highest reading since September. Conversely, China’s manufacturing PMI was down to 49.1, which is lower than January and marks the sixth consecutive month of contraction, something that is a worrying sign for the country that is colloquially known as “the world’s factory”. Chinese manufacturing is being challenged by subdued domestic spending as well as tensions with many of their primary trade partners[5]. It will be interesting to see if the U.S. and European economies can truly reach robust rates of growth if the world’s second-largest economy continues to struggle. There is slowness north of the border as well as retail sales were down by 0.4% in Canada in January (although this came after a stronger-than-expected increase of 0.8% in December, so this could be a regression to the mean). Much like the U.S., Canada’s economy is growing but at a slower pace and the Canadian central bank is expected to leave interest rates where they are at their March meeting[6].
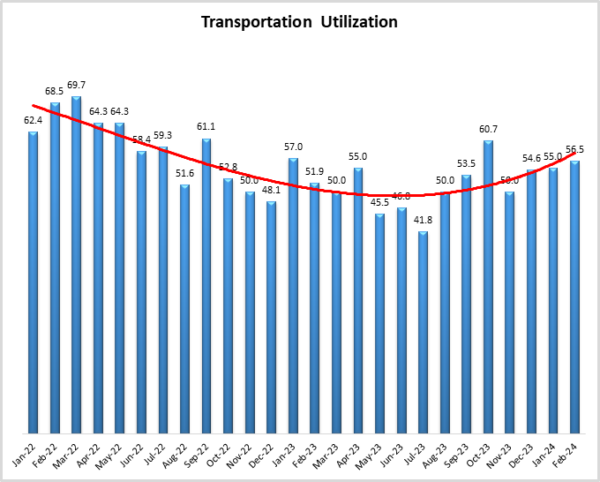
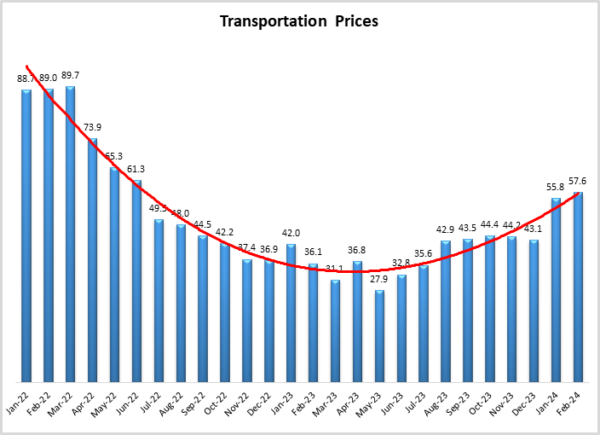
The resilience of the U.S. economy is apparent in Transportation Price movements. After moving from contraction to expansion for the first time in 20 months in January, Transportation Price growth increased again (+1.8) to 57.6 in February. This is a function of demand and not cost, as increasing Transportation Prices came despite U.S. diesel costs being down to $4.058 per gallon in the last week of February, which is $0.236 down from the same time a year ago[7]. Additionally, fears that the increases were only due to issues in the Red Sea also seem to have subsided with the price spikes due to Houthi attacks seem to have peaked as shipping rates from Asia to the U.S. declined in February. Rates are still up by over 100% from where they were in early December, but they have dipped slightly in recent weeks[8]. That does not mean the crisis is over. Maersk recently predicted that they will likely be avoiding sailing through the Red Sea through Q2 and possibly Q3[9], meaning transit times from Asia to Western Europe and to the East Coast of the U.S. will remain elevated. Relatedly, Transportation Utilization is up slightly as well (+1.5) to 56.5.
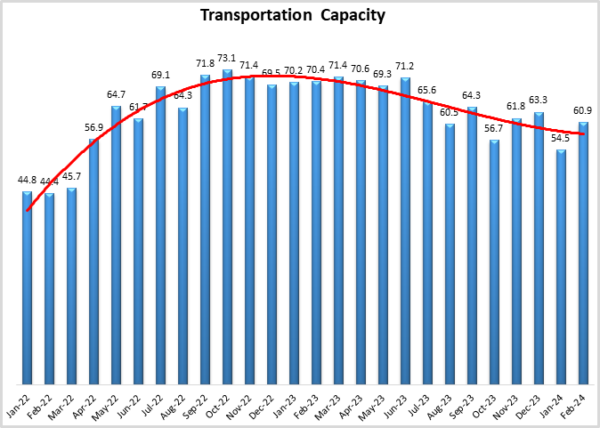
Despite this welcome increase in price and utilization, the freight market has not fully broken out of its recession and moved back to what we consider a boom period. This is in part due to the continued surplus of capacity in the market. Transportation Capacity was up (+6.4) to a reading of 60.9 in February. Interestingly, capacity remained relatively tight for larger firms (those with 1,000+ employees) relative to smaller firms; with the larger LMI respondents reporting a growth rate of only 53.3 to their smaller counterparts’ 68.1. This difference may suggest that larger firms who are often dealing with a more national network are still finding tightness in long-haul that may not exist for more regional shippers. Big picture however, it means that we have still not had multiple consecutive readings in which Transportation Prices exceed Transportation Capacity, meaning we are not yet ready to call an end to the freight recession (although our respondents are predicting that will come sometime this year).
It is notable that capacity is still growing after this extended slow period. One factor for the continued resilience of transportation capacity is the high levels of cash-on-hand for the larger ocean and over-the-road shipping firms[10]. Daimler Trucking is expecting their 2024 earnings to be consistent with 2023. Daimler’s Q4 earnings were up to 1.56 billion Euros, a significant increase from the 1.03 billion in earnings the year before[11]. This increase is at least partially due to continued inflation in the Eurozone. Knight-Swift announced in late February that they were making a leadership change, promoting former CFO Andrew Miller to replace David Jackson (who had been CEO since 2015)[12]. An exact reason has not been given for the change, but gross profits were down by just over $500 million in 2023 for the U.S.’s largest carrier by revenues[13]. Despite that, none of these carriers has announced major capacity cuts. In fact, J.B. Hunt is attempting to expand their fleet by purchasing Walmart’s intermodal container and chassis fleets[14]. This represents a dis-integration for Walmart, allowing the U.S.’s largest retailer to focus more on their retail business while letting long-time partner Hunt handle shipping. For J.B. Hunt this may be an opportunistic expansion at a time when the freight market is down from the heights of 2020-2021 but is showing signs of recovery.
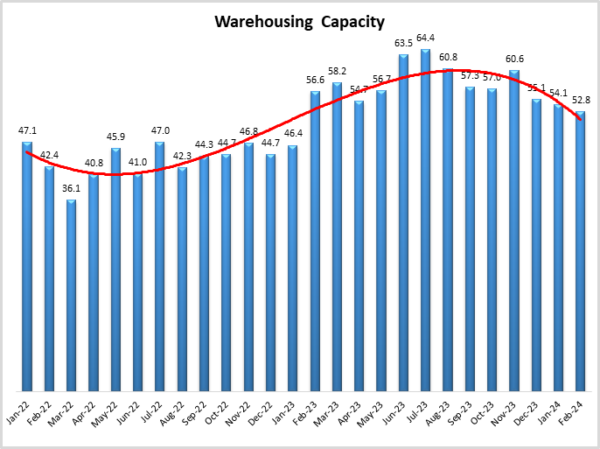
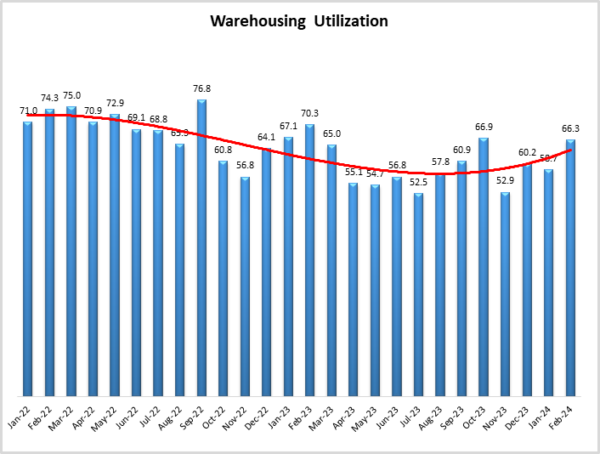
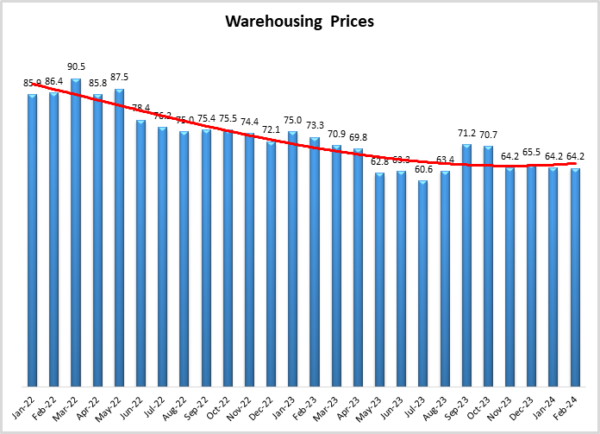
While the warehousing industry is not contracting, it is certainly not growing the way it has through most of the 2020s. With firms going back to JIT systems we see retailers like Rite Aid and Fanatics reducing the amount of space they are leasing[15]. Interestingly, given the slowing growth of Warehousing Capacity, which read in at 52.8 (-1.3) in February, it seems that much of this released space is being taken up by smaller firms who may have previously been boxed out of the market by their larger competitors. This is evident in the difference in Warehousing Capacity rates (51.1 for smaller firms and 54.8 for their larger counterparts). Despite the more pronounced slowdowns in places like the Inland Empire[16] or California’s Central Valley[17] (a beautiful place and home to Fresno State University – a major college sports rival of the universities of 40% of the authorship team), more capacity is expected to come online in the near future, as U.S. leasing activity in Q4 increased by 14.8% from Q3. Additionally, we see Warehousing Utilization up (+7.6) more than any other metric this month to a growth rate of 66.3. This jump in utilization is particularly notable for Downstream firms who reported a significant growth rate of 71.4 (compared to 63.0 for Upstream firms). Warehousing Prices on the other hand remained steady (+/-0.0), coming in at 64.2 for the second consecutive month.
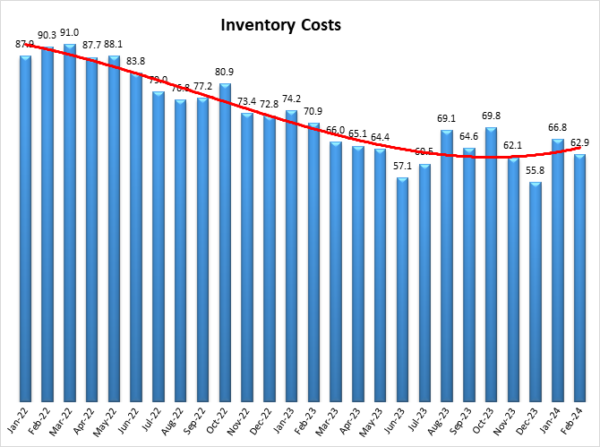
A reason to be optimistic about warehousing in 2024 is what seems to be happening with inventories. Inventory Levels are up (+5.8) to 58.5 which is the fastest rate of growth since February 2023 and a clear sign that firms are restocking after running inventories down over the holidays. Unlike what we have observed in the last 18 months, this increase is being driven by Upstream firms. In January, Upstream respondents saw inventory contract at a rate of 47.1, but in February it is expanding at a rate of 63.2. This is a marked shift for U.S. manufacturers and wholesalers who have been hesitant to increase inventories. 3PLs are also represented in this group, so the increase there may represent higher levels of turnover in general. Meanwhile, many retailers have now fully pivoted to JIT (with Inventory levels growing at the modest rate of 55.6). We see anecdotal evidence of this in Walmart loosening supplier requirements whereby they will now allow them to deliver shipments 90% on time and 95% in full. This is a relaxation of the pandemic-era rules in which suppliers were required to hit 98% for both metrics. Walmart’s CEO John Furner stated that this shift is related to feeling “good about (their) inventory position” and a return to normal ordering patterns and seasonality[18]. These differences are reflected in Inventory Costs, which are down overall (-3.9) to 62.9, but up significantly Upstream, where they read in at 70.6 (significantly higher than the Downstream reading of 55.6). The buildup of Upstream inventories is a positive sign for the logistics industry as it suggests we are now seeing more balance across multiple levels of the supply chain.
The flow of inventory is reflected in the increasing volume of imports coming through the West Coast ports. 110,656 TEUs entered the Port of LA the week of February 25th, which is up 90% year-over-year. Imports have been up year-over-year in all but one of the first nine weeks of 2024[19]. The pressure on West Coast ports could continue if new contracts are not signed with the East Coast ports. The Port of Charleston was denied in their appeal to the Supreme Court in late February as they attempted to overturn a lower court ruling requiring them to use only union labor[20]. This ruling gives the longshore union greater power in the negotiations that will continue through this Spring. Inventory for e-commerce firms like Shein and Temu has flowed into the U.S. due to a loophole that allows packages with contents valued at less than $800 to enter the country through an expedited process. This loophole, known as “de minimis” has grown in popularity, a billion packages entered the U.S. through this process in 2023 and 485 million have already come in that way through only the first two months of the year[21]. Proponents say this law allows smaller firms to have greater access to U.S. consumers, increasing competitiveness (and avoiding trade restrictions), while opponents are concerned that lax evaluation standards may allow importers to get away with human rights violations. Either way, the law stands now, and goods brought in through this process represent a bit of a bright spot in terms of U.S. import activity.
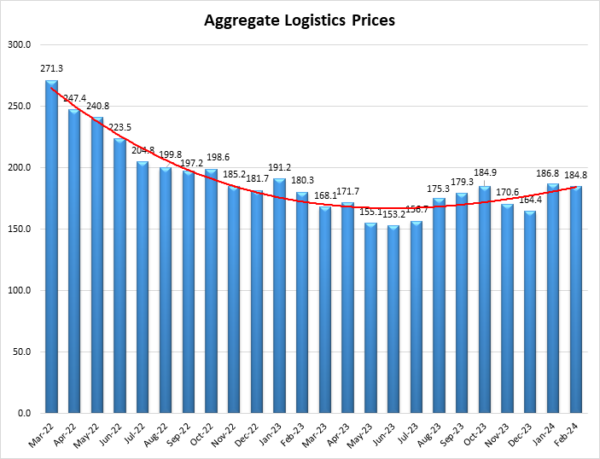
The shift in prices likely contributed to the moves in inflation registered in January. The San Francisco Fed’s measure of supply-based inflation was 2.82 points for monthly core PCE and 2.74 for monthly headline PCE inflation, both of which were the highest supply contributions to inflation since January 2023[22]. This is consistent with the LMI measure of Aggregate Logistics Prices which also reached a 12-month high of 186.8 in January 2024. In February the rate of expansion slowed slightly to 184.6. Supply issues were the primary driver of inflation through 2022 as can be seen by the Aggregate Prices read in at an all-time high of 271.3. This month’s prices are well below that, and the slowdown in expansion calls into question whether or not the slight uptick in inflation observed in January will continue into February.
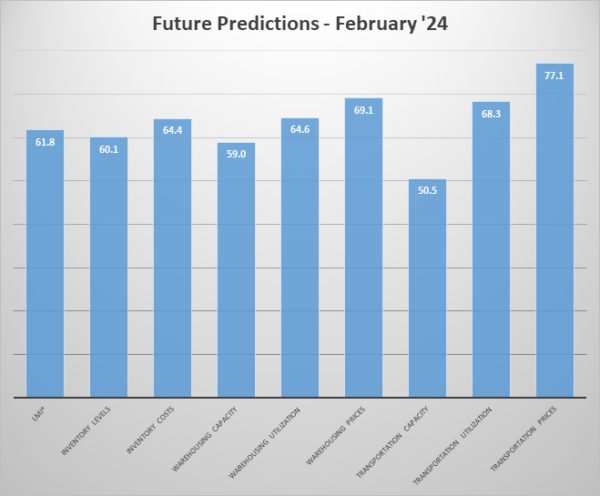
Respondents were asked to predict movement in the overall LMI and individual metrics 12 months from now. Respondents continue to be largely optimistic about the future of the logistics industry, predicting an overall growth rate of 61.8, which is down (-1.0) slightly from January’s future prediction of 62.8. Interestingly, the all-time average for the overall index is 62.4, which is very near to the mid-point of the future predictions of the last two months, suggesting that respondents are expecting a “return to normal” in 2024. As part of this growth respondents are predicting growth in Inventory Levels with an associated expansion in Inventory Costs (although at 64.4, the predicted costs are down by 7.8 points from January’s prediction of 72.2). The three warehousing metrics read in between 59.0-69.1 meaning that respondents are anticipating the strong and steady growth that has been the norm for this sector. Much like January, February’s future predictions anticipate Transportation Capacity stabilizing at 50.5 (down from 50.9). As a result of this, both Transportation Prices and Utilization are predicted to expand at healthy rates of 68.3 and 77.1 respectively. This Transportation Price expansion would be particularly robust, representing a return to a boom market and price growth not seen since Q1 of 2022.
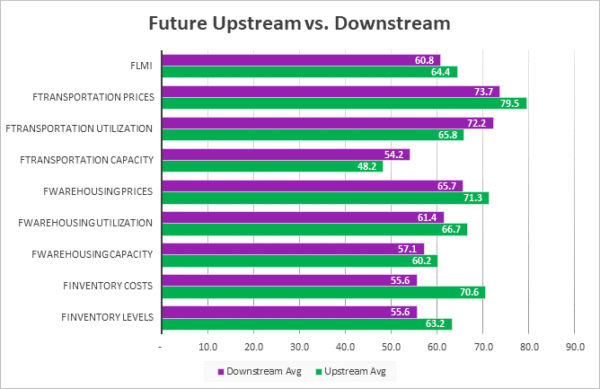
The future expectations from our Upstream respondents (green bars) and their Downstream (purple bars) counterparts are more aligned in February than they were in January (when they diverged significantly on three separate metrics). This month the only statistically significant difference between the two groups is in predicted Inventory Costs, which is 15.0-points higher Upstream (70.6 to 55.6). This is driven by (non-statistically significant) differences in predicted Inventory Levels (63.2 to 55.6). As a result, Upstream respondents are also predicting slightly higher rates of expansion for both Warehousing Prices (71.3 to 65.7) and Transportation Prices (79.5 to 73.7). We also see a difference in predicted Transportation Capacity, where Upstream firms are predicting contraction (48.2), and Downstream firms predict mild expansion (54.2). Upstream firms have been holding less inventory for the last several months. Based on these readings, they are expecting to “catch up” to their Downstream counterparts over the next 12 months.
| Futures | Inv. Lev. | Inv. Costs | WH Cap. | WH Util. | WH Price | Trans Cap. | Trans Util. | Trans Price | LMI |
| Upstream | 63.2 | 70.6 | 60.2 | 66.7 | 71.3 | 48.2 | 65.8 | 79.5 | 64.4 |
| Downstream | 55.6 | 55.6 | 57.1 | 61.4 | 65.7 | 54.2 | 72.2 | 73.7 | 60.8 |
| Delta | 7.7 | 15.0 | 3.0 | 5.2 | 5.6 | 6.0 | 6.4 | 5.8 | 3.6 |
| Significant? | No | Yes | No | No | No | No | No | No | No |
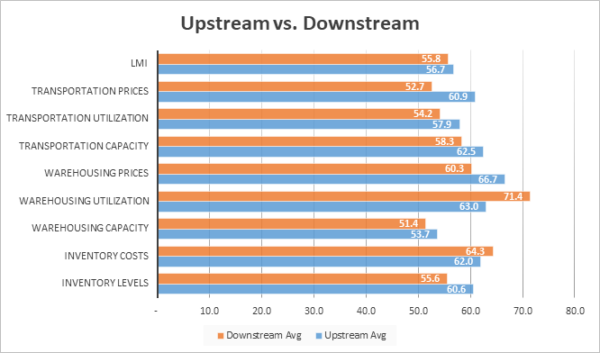
In January’s report we wondered whether we would see more balance in activity across the supply chain. Based on February’s analysis of response differences from Downstream (orange bars) and Upstream respondents (blue bars) it seems this balance is beginning to appear. In January we observed statistically significant differences in five metrics, but in February this was down to zero. The biggest change is the movement in Upstream firms from contraction (47.1) to expansion (60.6), exceeding the inventory expansion of their Downstream counterparts (55.6). Upstream firms had been carrying depressed levels of inventory for months but predicting that an expansion would come sometime in 2024. This prediction came to fruition in February and has also led to slightly faster rates of expansion in Warehousing Prices, all three transportation metrics, and the overall index. At the same time, Downstream metrics are down from last month for six of the five of the non-capacity metrics (where they are higher). This downshift is due to the slowdown in inventory buildups at the Downstream retail level, which is consistent with what those respondents had been predicting as they move back towards JIT inventory management.
| Inv. Lev. | Inv. Costs | WH Cap. | WH Util. | WH Price | Trans Cap | Trans Util. | Trans Price | LMI | |||||||||||
| Upstream | 60.6 | 62.0 | 53.7 | 63.0 | 66.7 | 62.5 | 57.9 | 60.9 | 56.7 | ||||||||||
| Downstream | 55.6 | 64.3 | 51.4 | 71.4 | 60.3 | 58.3 | 54.2 | 52.7 | 55.8 | ||||||||||
| Delta | 5.0 | 2.3 | 2.3 | 8.5 | 6.4 | 4.2 | 3.7 | 8.2 | 0.9 | ||||||||||
| Significant? | No | No | No | No | No | No | No | No | No |
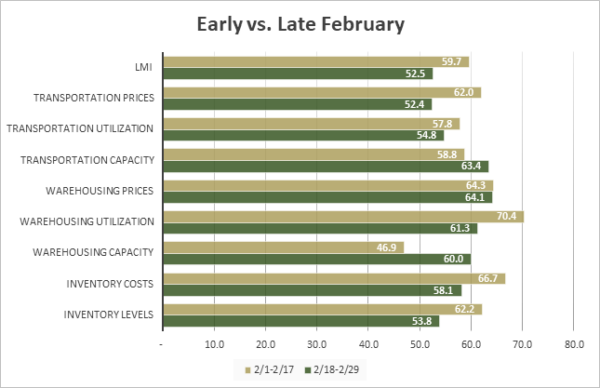
Responses varied from early (gold bars) to late (green bars) February, largely suggesting that the first half of the month was busier than the second. The most pronounced moves were in Warehousing Capacity (46.9 to 60.0), Transportation Prices (62.0 to 52.4) and the overall index (59.7 to 52.5). This downshift largely seems to be the product of a decreased growth in Inventory Levels which increased robustly in early February (62.2) before moving back towards more marginal levels of growth (53.8) in late February. This move suggests that firms – particularly Upstream firms – were finishing up post-holiday restocking early in the month, and then moved back towards the predicted return to JIT inventories later in the month. There is also likely a seasonal aspect to this, as the Chinese Lunar New Year often leads to building up inventories ahead of the shutdown and then a slowdown later in February. It will be interesting to see if a continuance of JIT policies leads to more reserved logistics activity, or if the higher pace of turnover leads to greater levels of activity as we move towards Spring.
| Inv. Lev. | Inv. Costs | WH Cap. | WH Util. | WH Price | Trans Cap | Trans Util. | Trans Price | LMI | |||||||||||
| 2/1-2/17 | 62.2 | 66.7 | 46.9 | 70.4 | 64.3 | 58.8 | 57.8 | 62.0 | 59.7 | ||||||||||
| 2/18-2/29 | 53.8 | 58.1 | 60.0 | 61.3 | 64.1 | 63.4 | 54.8 | 52.4 | 52.5 | ||||||||||
| Delta | 8.4 | 8.6 | 13.1 | 9.2 | 0.2 | 4.6 | 3.1 | 9.6 | 7.2 | ||||||||||
| Significant? | No | No | Yes | No | No | No | No | Marginal | Yes |
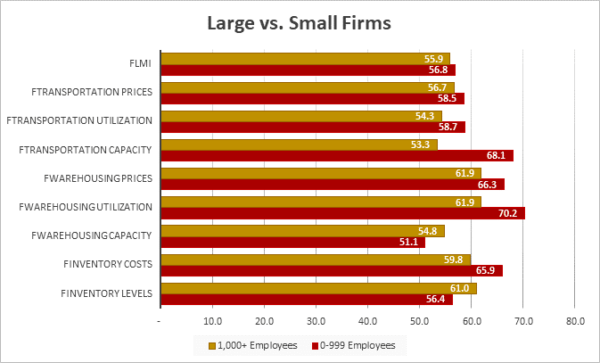
Similar to what we saw with Upstream firms, in February smaller firms (those with 0-999 employees, represented by maroon lines) began to close many of the gaps that had existed between them and larger firms in our respondent base (those with 1,000 employees or more, represented by gold lines). The most notable change is smaller firms moving back towards expansion in Inventory Levels (up to 56.4 from 45.5). The increase in inventories led smaller firms to see significantly higher rates of growth in Warehousing Utilization compared to larger firms (70.7 to 61.9). Interestingly, smaller firms also saw significantly greater rates of expansion in Transportation Capacity (68.1 to 53.3). The fact that more capacity is available to smaller firms at a time when they are presumably busier is somewhat contradictory. One potential explanation for this is that as larger Downstream retailers have slowed down their inventory buildups, Transportation Capacity has loosened up, allowing smaller firms access to more potential freight options month-over-month. Last month we stated that for the logistics industry to officially move back into a boom period, smaller firms will need to join their larger counterparts in a cycle of more significant rates of growth. We are clearly not in a boom period yet, but this would be a step in that direction.
| Employees | Inv. Lev. | Inv. Costs | WH Cap. | WH Util. | WH Price | Trans Cap. | Trans Util. | Trans Price | LMI |
| 0-999 | 56.4 | 65.9 | 51.1 | 70.2 | 66.3 | 68.1 | 58.7 | 58.5 | 56.8 |
| 1,000+ | 61.0 | 59.8 | 54.8 | 61.9 | 61.9 | 53.3 | 54.3 | 56.7 | 55.9 |
| Delta | 4.6 | 6.2 | 3.7 | 8.3 | 4.4 | 14.8 | 4.4 | 1.8 | 0.9 |
| Significant? | No | No | No | Marginal | No | Yes | No | No | No |
The index scores for each of the eight components of the Logistics Managers’ Index, as well as the overall index score, are presented in the table below. The rate of expansion for the overall index is up (+1.0) to 56.6. This expansion is primarily driven by growth in Inventory Levels, Warehousing Utilization, and the three transportation metrics. For only the second time in the last five years, as well as the second consecutive month, we are observing growth across all eight metrics. This “all-growth” scenario is often associated with a transitionary period, so it is interesting that we have seen it two months in a row, and that the overall index has held so steady. It will be interested to observe how things move from here.
| LOGISTICS AT A GLANCE | |||||
| Index | February 2024 Index | January 2024 Index | Month-Over-Month Change | Projected Direction | Rate of Change |
| LMI® | 56.5 | 55.6 | +1.0 | Expanding |
Faster |
| Inventory Levels | 58.5 | 52.8 | +5.8 | Expanding | Faster |
| Inventory Costs | 62.9 | 66.8 | -3.9 | Expanding | Slower |
| Warehousing Capacity | 52.8 | 54.1 | -1.3 | Expanding | Slower |
| Warehousing Utilization | 66.3 | 58.7 | +7.6 | Expanding | Faster |
| Warehousing Prices | 64.2 | 64.2 | 0.0 | Expanding | No Change |
| Transportation Capacity | 60.9 | 54.5 | +6.4 | Expanding | Faster |
| Transportation Utilization | 56.5 | 55.0 | +1.5 | Expanding |
Faster |
| Transportation Prices | 57.6 | 55.8 | +1.8 | Expanding |
Faster |
Historic Logistics Managers’ Index Scores
This period’s along with prior readings from the last two years of the LMI are presented table below:
| Month | LMI | Average for last 3 readings – 54.3
All-time Average – 62.4 High – 76.2 Low – 45.4 Std. Dev – 8.30
|
| Feb ‘24 | 56.6 | |
| Jan ‘24 | 55.6 | |
| Dec ‘23 | 50.6 | |
| Nov ‘23 | 49.4 | |
| Oct ‘23 | 56.5 | |
| Sep ‘23 | 52.4 | |
| Aug ‘23 | 51.2 | |
| July ‘23 | 45.4 | |
| June ‘23 | 45.6 | |
| May ‘23 | 47.3 | |
| Apr ‘23 | 50.9 | |
| Mar ‘23 | 51.1 | |
| Feb ‘23 | 54.7 | |
| Jan ‘23 | 57.6 | |
| Dec ‘22 | 54.6 | |
| Nov ‘22 | 53.6 | |
| Oct ‘22 | 57.5 | |
| Sep ‘22 | 61.4 | |
| Aug ‘22 | 59.7 | |
| July ‘22 | 60.7 | |
| June ‘22 | 65.0 | |
| May ‘22 | 67.1 | |
| Apr ‘22 | 69.7 | |
| Mar ‘22 | 76.2 | |
| Feb ‘22 | 75.2 |
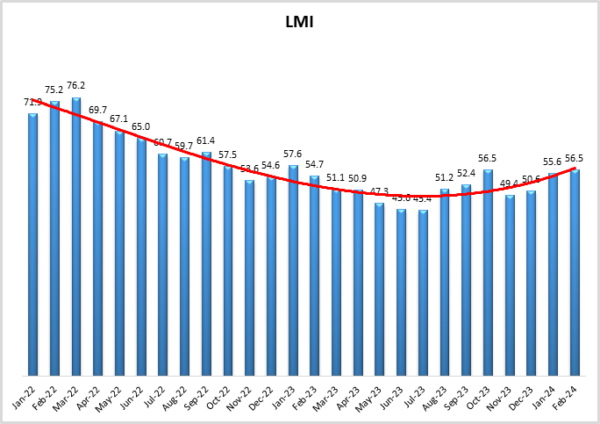
LMI®
The overall index reads in at 56.5 in February, up (+0.9 from January’s reading of 55.6, matching October as the highest readings in the last 12 months. Overall logistics activity continues to pick up after lagging through the summer of 2023. The smaller increase in growth rates in February is due to an increased buildup of inventories (particularly for smaller and Upstream firms). The overall index is up 1.8-poitns from a year ago and 18.7-points down from two years ago when it was near all-time highs, but the reading of 56.5 represents a healthier, more sustainable rate of growth and is closer to the all-time average expansion rate of 62.4. The index was very similar Upstream (56.7) and Downstream (55.8) as well as for smaller (56.8) and larger (55.9) firms. However, the overall index did grow significantly more slowly in late February (5.5) compared to early February (59.7) which could be reflective of a post-U.S. holiday/pre-Chinese holiday surge.
When asked to predict what conditions will be over the next 12 months respondents foresee a rate of expansion of 61.8, down slightly (-1.0) from January’s future prediction of 62.8. As mentioned above, these two readings frame the all-time average of 62.4, suggesting that we are moving back towards more normalized – and likely sustainable – rates of expansion. While there is no significant statistical difference between the two, Upstream firms are predicting a slightly faster rate of growth that their Downstream counterparts (64.4 to 60.8).
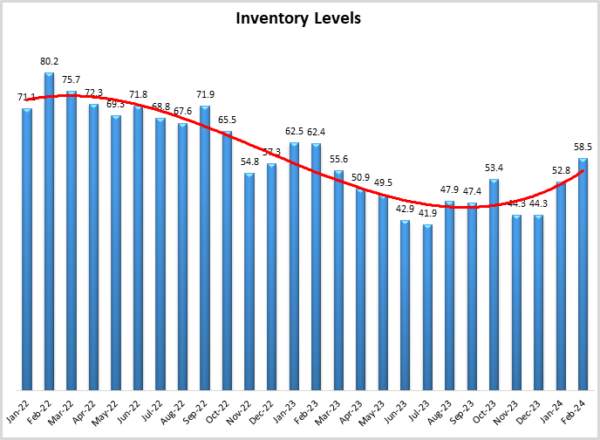
Inventory Levels
The Inventory Level index is unchanged at 58.5, up 5.8 points from last month, indicating a stronger increase than last month. Inventories decreased in seven of the last eight months in 2023, making it the only year in the history of the index in which Inventory Levels contracted more frequently than they expanded. Inventories are up in both months of 2024 however and the readings in the 50’s suggest that there is restocking happening, but at a more reasonable level than two years ago, when this metric was 21.7 points higher than it is today. Much of this increase is driven by the long-anticipated restocking of Upstream firms, who returned a value of 60.6, while Downstream respondents adhered more to a JIT strategy, returning a value of 55.6. Much of this restocking happened in early February when respondents returned a value of 62.2. Later respondents were somewhat lower, but still increasing, with an average of 53.8.
When asked to predict what conditions will be like 12 months from now, the average value is 60.1, down slightly (-1.4) from January’s future prediction of 61.5, and 1.6 points higher than the current reading. Like last month, this is primarily driven by Upstream respondents who predict an increase of 63.2, which Downstream firms predict a more modest growth rate of 55.6.
Inventory Costs
Inventory costs read in at 62.9, down (-3.9) from January’s reading of 66.8. This reading is 7.9 points lower than last year, and 27.3 points lower than two years ago. Early respondents returned a value of 66.7, and late respondents returned 58.1. While this 8.6-point drop is notable, it is moderate relative to last month’s drop of 14.0 points from early to late January. Smaller firms reported an inventory cost of 65.9, a significant increase, while larger firms reported a value of 59.8, a slightly smaller increase. This is the opposite of what we see with Inventory Levels, meaning that smaller firms are paying more for less inventory – a potential explanation as to why their Inventory Levels are increasing more slowly than those of their larger counterparts.
Predictions for future Inventory Cost growth is 64.4, down (-7.8) from January’s prediction of 72.2 but more in line with December’s future prediction of 61.5. Once again, we see our inventory metrics driven by Upstream respondents, who predict a growth rate of 70.6, significantly higher (+15.0) than the Downstream prediction of 55.6. The buildup of Upstream inventories is a positive sign for the logistics industry as it suggests we are now seeing more balanced across multiple levels of the supply chain.
Warehousing Capacity
The Warehousing Capacity index registered in at 52.8 in February 2024, down (-1.3) from January’s reading of 54.1, and continuing the slowing growth rate we have observed for the last three months. Warehousing Capacity has read in in the 50’s in four of the past five months, which suggests that the market is closing in on some level of equilibrium. This equilibrium seems to be consistent across supply chains, as we only read a 2.3-point split between Upstream (53.7) and Downstream (51.4) which is not statistically significant (p<.1). The difference between small (51.1) and large (54.8) not statistically significant (p>.1) either.
When asked to predict what conditions will be like 12 months from now respondents expect Warehouse Capacity is to continue along in steady expansionary territory at 59.0, up (+2.6) from January’s future prediction of. Upstream expectations (60.2) are slightly higher than Downstream expectations (57.1) with this difference not being statistically significant (p>.1) suggesting that respondents across the supply chain are hopeful for some increase in capacity which would in turn lead to relief in prices.
Warehousing Utilization
The Warehousing Utilization index registered in at 66.3 points for the month of February, reflecting a 7.6-point decrease from the month prior. This reading is down 4 points from a year ago, and down 8 points from the reading two years ago. In addition, there was an 8.5-point split between Upstream (63.0) and Downstream (71.4) which is likely reflective of the inventory buildup happening further up the supply chain. We also see a marginally significant difference between small (70.2) and large (61.9) employers. This is consistent with the fact that smaller firms have access to less capacity and are paying more, both of which necessitate higher levels of utilization.).
When asked to predict what conditions will be like 12 months from now respondents expect Warehouse Utilization to increase at a rate of 64.6, down (-5.3) from January’s future prediction of 69.6. future Upstream expectations (71.3) are slightly higher than Downstream expectations (65.7) due to their ongoing inventory buildup.
Warehousing Prices
The Warehousing Price index registered in at an unchanged (+0.0) 64.2 points for the month of February. This reading is down 9.1 points from a year ago, and down a sizable 22.2 points from the reading two years ago when inflation began to spiral out of control. We observe a 6.4-point split between Upstream (66.7) and Downstream (60.3) which was not statistically significant but corroborates the narrative of manufacturers, wholesalers, and 3PLs building gup inventories. We see a similar non-statistically significant difference between small (66.3) and large (61.9) employers.
When asked to predict what conditions will be like 12 months from now respondents expect Warehouse Prices to increase at a rate of 69.1, down (-2.0) from January’s future prediction of 71.1. Like our other metrics, future Upstream expectations (71.3) are higher than Downstream expectations (65.7). Taken all together, these predictions would represent a shift in the warehousing industry as the bulk of the growth over the last few years has been focused Downstream closer to the consumer. The Upstream storage market heating up would represent a significant change as inventories continue to rebalance across the supply chain.
Transportation Capacity
The Transportation Capacity Index registered 60.9 percent in February 2024. This constitutes a positive rebound of 6.4 points from January’s reading of 54.5 – which itself was a large drop from December. The Upstream Transportation Capacity index is at 62.5, while the Downstream index is at 58.3. As such, the positive rebound in Transportation Capacity is prevalent across the supply chain, both Upstream (63.0) and Downstream (71.0). Although it should be noted that for the first time in a while, Upstream capacity is growing a bit more slowly. Capacity is also much tighter for large firms (53.3) than for small ones (68.1), which is consistent with larger firms bringing in inventories at a slightly faster rate than their smaller counterparts.
The future Transportation Capacity index is at 50.5, down very slightly (-0.4) from January’s future prediction of 50.9. This indicates expectations of slight expansion over the next 12 months as fleets continue to right-size. The Downstream future Transportation Capacity index is at 54.2 while the Upstream future Transportation Capacity index indicates 48.2. While this difference is not statistically significant, it does support expectations that Upstream firms will be busy restocking (and therefore needing more transportation) over the next 12 months.
Transportation Utilization
The Transportation Utilization Index registered 56.5 in February 2024. This corresponds to a small increase (+0.4) from January’s reading of 55.0. With this uptick, the Transportation Utilization continues to remain slightly above 50, indicating slight expansion. The Downstream Transportation Utilization Index is now at 54.2, while the Upstream index is now at 57.9, but the difference is not statistically significant. We saw similarly small differences in the early (57.8) vs late (54.8) responses, and bigger (54.3) vs. smaller (58.7) firms, indicating that in general, Transportation Utilization is increasing at a moderate pace.
The future Transportation Utilization Index indicates expansion at a 68.3 level for the next 12 months, which is 6.4 points higher than the previous reading of 61.9. The Upstream Transportation Utilization index is at 65.8 while the Downstream index is at 72.2. So, the expectations of continued growth in transportation are slightly stronger Downstream, but the difference is not statistically significant.
Transportation Prices
The Transportation Prices Index reads in at 57.6 in February 2024, which is up (+1.8) from January’s reading of 55.8 and marks the fastest rate of expansion since June of 2022 at the start of the freight recession. The Downstream Transportation Prices index is now at 52.7, while the Upstream index is at 60.9, signaling that firms further up the supply chain are now beginning to move inventories. This is a marked shift from what we saw at the end of 2023 when Downstream firms were seeing price increases and Upstream firms continued to enjoy price contractions. Interestingly, Transportation Price growth increased at a marginally significantly slower rate in late (52.4) relative to early (62.0) February. It will be critical to monitor this trend to observe whether or not this slowdown was due to seasonality regarding the Chinese New Year, or if we are moving back towards price contraction. As will be seen below, future predictions suggest it will be the former and not the latter, but Transportation Prices should still be monitored going forward.
The future index for Transportation Prices is now at 77.1, indicating increasingly stronger expectations of higher Transportation Prices in the next 12 months. The Downstream Transportation Prices index is at 73.7 while the Upstream Transportation Prices index is at 79.5, so strong expectations of higher Transportation Prices in the next 12 months are spread across the supply chain.
About This Report
The data presented herein are obtained from a survey of logistics supply executives based on information they have collected within their respective organizations. LMI® makes no representation, other than that stated within this release, regarding the individual company data collection procedures. The data should be compared to all other economic data sources when used in decision-making.
Data and Method of Presentation
Data for the Logistics Manager’s Index is collected in a monthly survey of leading logistics professionals. The respondents are CSCMP members working at the director-level or above. Upper-level managers are preferable as they are more likely to have macro-level information on trends in Inventory, Warehousing and Transportation trends within their firm. Data is also collected from subscribers to both DC Velocity and Supply Chain Quarterly as well. Respondents hail from firms working on all six continents, with the majority of them working at firms with annual revenues over a billion dollars. The industries represented in this respondent pool include, but are not limited to: Apparel, Automotive, Consumer Goods, Electronics, Food & Drug, Home Furnishings, Logistics, Shipping & Transportation, and Warehousing.
Respondents are asked to identify the monthly change across each of the eight metrics collected in this survey (Inventory Levels, Inventory Costs, Warehousing Capacity, Warehousing Utilization, Warehousing Prices, Transportation Capacity, Transportation Utilization, and Transportation Prices). In addition, they also forecast future trends for each metric ranging over the next 12 months. The raw data is then analyzed using a diffusion index. Diffusion Indexes measure how widely something is diffused or spread across a group. The Bureau of Labor Statistics has been using a diffusion index for the Current Employment Statics program since 1974, and the Institute for Supply Management (ISM) has been using a diffusion index to compute the Purchasing Managers Index since 1948. The ISM Index of New Orders is considered a Leading Economic Indicator.
We compute the Diffusion Index as follows:
PD = Percentage of respondents saying the category is Declining,
PU = Percentage of respondents saying the category is Unchanged,
PI = Percentage of respondents saying the category is Increasing,
Diffusion Index = 0.0 * PD + 0.5 * PU + 1.0 * PI
For example, if 25 say the category is declining, 38 say it is unchanged, and 37 say it is increasing, we would calculate an index value of 0*0.25 + 0.5*0.38 + 1.0*0.37 = 0 + 0.19 + 0.37 = 0.56, and the index is increasing overall. For an index value above 0.5 indicates the category is increasing, a value below 0.5 indicates it is decreasing, and a value of 0.5 means the category is unchanged. When a full year’s worth of data has been collected, adjustments will be made for seasonal factors as well.
[1] Hsu, J. (2024, February 23). Surveys of Consumers. Survey of Consumers – Final Results for February 2024. http://www.sca.isr.umich.edu/
[2] Smialek, J. (2024, February 29). A Key Inflation Measure Moderated in January. The New York Times. https://www.nytimes.com/2024/
[3] U.S. Energy Information Administration. (2024, March 2). Oil imports and exports—U.S. Energy Information Administration (EIA). Oil Imports and Exports 2023. https://www.eia.gov/
[4] Cohen, P. (2024, March 1). Eurozone Inflation, at 2.6%, Continues to Ease. The New York Times. https://www.nytimes.com/2024/
[5] Cheng, J. (2024, February 29). China’s Factory Activity Slows Again, Highlighting Limits of Government Measures. WSJ. https://www.wsj.com/world/
[6] Stewart, R. M. (2024, February 22). Canada Retail Sales Rise 0.9% in December But Fall in January. WSJ. https://www.wsj.com/economy/
[7] U.S. Energy Information Administration. (2024, February 26). Gasoline and Diesel Fuel Update. Gasoline and Diesel Fuel Update February 26, 2024. https://www.eia.gov/petroleum/
[8] LaRocco, L. A. (2024b, February 15). Red Sea attack-fueled ocean freight inflation is starting to ease on key global trade routes. CNBC. https://www.cnbc.com/2024/02/
[9] LaRocco, L. A. (2024a, February 14). Shipping giant Maersk says Red Sea vessel diversions could extend into second half of 2024. CNBC. https://www.cnbc.com/2024/02/
[10] LaRocco, L. A. (2024c, March 1). There’s been a rebound in volatile shipping stocks. The market opportunity isn’t over, report says. CNBC. https://www.cnbc.com/2024/03/
[11] Smolak, H. (2024, March 1). Daimler Truck Expects 2024 Adjusted Earnings in Line With Previous Year; Raises Dividend. WSJ. https://www.wsj.com/business/
[12] Kellaher, C., & Page, P. (2024, February 27). Trucking Giant Knight-Swift Swaps Out Top Leadership. Wall Street Journal. https://www.wsj.com/articles/
[13] Yahoo Finance. (2024, March 2). Knight-Swift Transportation Holdings Inc. (KNX) Income Statement—Yahoo Finance. Yahoo Finance: Knight-Swift Transportation Holdings Inc. (KNX) 3/2/2024. https://finance.yahoo.com/
[14] Feuer, W. (2024, February 22). J.B. Hunt to Buy Walmart’s Intermodal Assets in a Shipping Agreement. Wall Street Journal. https://www.wsj.com/articles/
[15] Young, L. (2024a, February 13). Warehousing Demand Is Starting to Shrink. Wall Street Journal. https://www.wsj.com/articles/
[16] Harrison, D. (2024, February 27). Warehouse Boom Fades, and the Hopes of a California Region Fade With It. WSJ. https://www.wsj.com/business/
[17] Lee, D., & Masunaga, S. (2024, February 21). The Inland Empire’s once-unstoppable warehousing industry falls into a slump. Los Angeles Times. https://www.latimes.com/
[18] Young, L. (2024b, February 21). Walmart Eases Supplier Delivery Demands as Stocking Pressures Recede. Wall Street Journal. https://www.wsj.com/articles/
[19] Port of Los Angeles. (2024, February 25). Port Optimizer—Control Tower. Port of Los Angeles Signal February 25 2024. https://signal.portoptimizer.
[20] Berger, P. (2024, February 20). Supreme Court Rejects Port of Charleston Case in Labor Battle. Wall Street Journal. https://www.wsj.com/articles/
[21] Vanderford, R. (2024, March 1). WSJ News Exclusive | Imports Under Closely Watched U.S. Trade ‘Loophole’ Surge. Wall Street Journal. https://www.wsj.com/articles/
[22] Shapiro, A. (2024, March 2). Supply- and Demand-Driven PCE Inflation—San Francisco Fed January 2024. https://www.frbsf.org/


