- Growth is INCREASING AT AN INCREASING RATE for: Warehousing Utilization, Warehousing Prices, Transportation Capacity, and Transportation Utilization
- Growth is INCREASING AT AN DECREASING RATE for: Inventory Costs and Warehousing Capacity
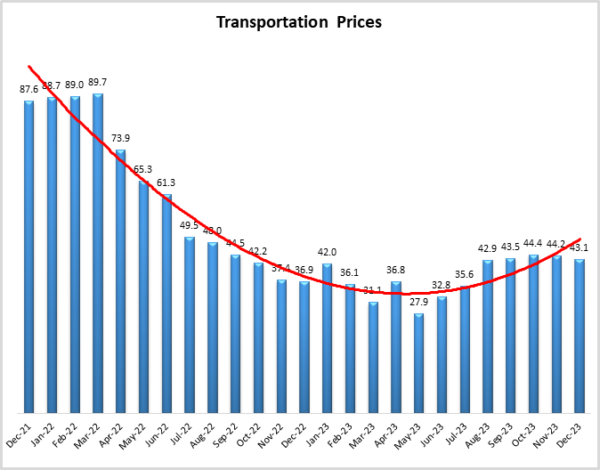
- Inventory Levels and Transportation Prices ARE DECREASING
The Logistics Managers’ Index moved back into expansion territory in December. This movement back to growth was led by increased activity among the three warehousing metrics. Warehousing Capacity is tighter (-5.5) while Utilization (+7.4) and Prices (+1.2) are both expanding at increasing rates. Inventory Levels continued to decline at a steady pace (although they were breaking even Downstream – likely indicative of JIT practices products selling briskly). This movement is likely the catalyst behind Transportation Utilization moving back into expansion (+4.6). Despite this, freight continues to struggle, with Transportation Prices decreasing at an increasing rate (-1.1). Finally, it is worth noting that Inventory Costs are growing at 55.8 (-6.3) but at the lowest level recorded in the history of the index. It will be interesting to continue monitoring this metric to see if it continues to moderate given the clear push towards JIT inventory management.
Researchers at Arizona State University, Colorado State University, Florida Atlantic University, Rutgers University, and the University of Nevada, Reno, and in conjunction with the Council of Supply Chain Management Professionals (CSCMP) issued this report today.
Results Overview
The LMI score is a combination of eight unique components that make up the logistics industry, including: inventory levels and costs, warehousing capacity, utilization, and prices, and transportation capacity, utilization, and prices. The LMI is calculated using a diffusion index, in which any reading above 50.0 indicates that logistics is expanding; a reading below 50.0 is indicative of a shrinking logistics industry. The latest results of the LMI summarize the responses of supply chain professionals collected in December 2023.
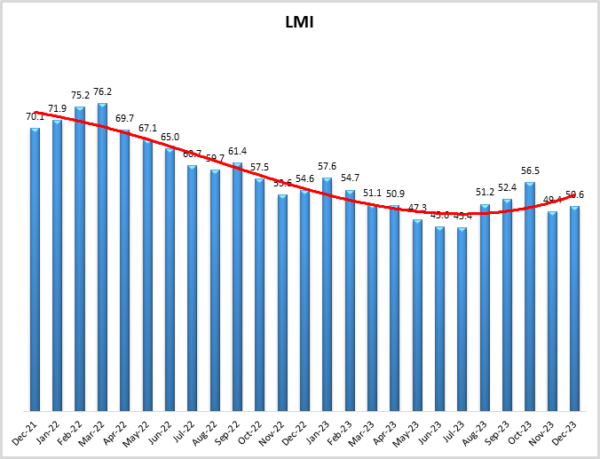
The LMI read in at 50.6 this month, up (+1.2) from November and back into mild expansion. As is always the case in December, movements in the logistics industry were driven by holiday shopping. The strength shoppers showed over cyber week continued throughout the holiday shopping season, with U.S. retail sales up 3.1% from November 1st to Christmas Eve. Online retail – which requires more trucks and warehouses located close to consumers – was a major part of this activity, with growth of 6.3%. Interestingly, sales per day was down slightly in December from November ($13.8B from $14.9B). This is reflective of both consumers increasingly spending earlier in the holiday season to avoid stock-outs, and the longer than usual 31-day gap between Black Friday and Christmas caused by an early Thanksgiving[1]. This spending was spurred in part by inflation continuing to drop. The personal-consumption expenditures (PCE) index was down 0.1% in November, which is the first drop in the PCE since the height of covid lockdowns in April of 2020. Wallstreet has taken this as a sign that interest rates will almost assuredly come down over the next year as all major indexes have now been up for eight consecutive weeks[2]. A significant portion of deflation can be traced to shifts in the logistics market. Aggregate Logistics costs (measured on a scale of 0-300, with 150 as the “break-even level) read in at 164.4, which is down (-6.2) from November’s reading of 170.6 and well below the readings during the heavy inflation period of 2022 which were often over 250.0. This is consistent with the San Francisco Fed’s measure of contributors to inflation, which showed supply costs as deflationary for both core and headline PCE inflation in November[3] – a direct reflection of decreased inventory costs inherent to the move back to JIT practices.
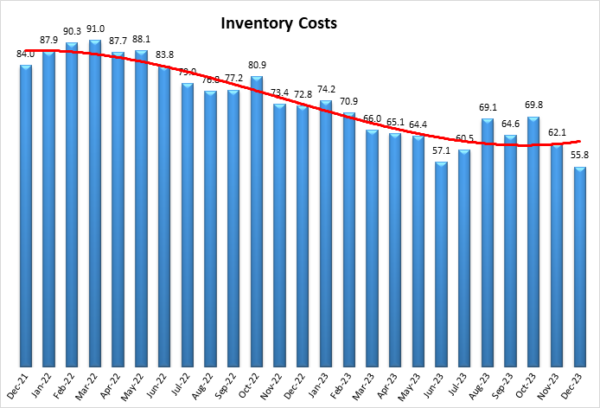
The impact of JIT on this deflation is evidenced by Inventory Costs, which read in at 55.8 (-6.3) – their lowest level in the history of the index. The costs are particularly low Upstream, where they read in at 50.8 which is very close to no movement at all. This metric has never contracted in the history of the LMI. It will be interesting to see if that changes in the new year or if this is the low point and manufacturers and wholesalers will begin building inventories up again. An Upstream rebuild is expected among respondents, who predicted Upstream Inventory Levels will increase at a rate of 56.2 over the next 12 months. This stands in contrast to high-turnover program with our Downstream respondents. Downstream Inventory Levels are 50.0 in December and are expected to be 50.0 over the next 12 months – the clearest sign yet that retailers are looking to get back to JIT and get off the inventory roller coaster they have been riding over the last few years. For this to happen there will need to be some restocking as current Inventory Levels read in at 44.3, which is a level of contraction that is identical to what we saw in November.
Some of the strategy behind the designs on JIT can be seen in the shift in how U.S. firms are importing goods. Sailings from China to the West Coast of the U.S. remains subdued[4]. While this is consistent with seasonal trends, it is still notable, and perhaps reflective of the continued shift in manufacturing from China to sources closer to the U.S. Conversely, over $105 billion of goods have been diverted away from the Red Sea due to attacks by Houthi Pirates. Between the instability in the Red Sea and the low water levels at the Panama Canal, moving goods from Asia to Europe or the East Coast of the U.S. – or vice-versa – has become difficult. This is reflected in container prices from Shanghai to the U.K. jumping to $10,000 for a 40-foot container – up from $2,400 in mid-December[5]. Conversely, more of the manufacturing base continues to nearshore to Mexico to take advantage of low-cost labor, technical expertise, proximity to the U.S., and the free border crossings allowed by the USMCA. Reflective of the increased freight volume coming in from Mexico, U.S. Customs and Border Protection is re-opening critical freight lines on the Texas/Mexico border after they had been closed due to immigration concerns. While this was somewhat politically controversial, rail carriers supported the decision as it will allow them to move inventory between the U.S. and their largest trading partner[6]. All of these factors have led analysts to be quite bullish on the prospects of continued growth in Mexico as supply chains continue their shift from the east to the south[7].
Finally, some restocking will likely come back in the form of returns. Shoppers last year returned approximately 16.5% of their purchases. With holiday savings up in 2023 and Americans expected to buy $5 billion of goods in 2023, many are bracing for a flurry of post-holiday returns. Optoro is predicting $173 billion in returned goods between Thanksgiving and the end of “returns season” in January[8]. Retailers such as Amazon, TJX, and Macy’s have made the requirements for returns more stringent, with 40% of retailers now charging for returns – up from 31% in 2022[9].
One of the major obstacles to the plan of fast-moving inventory is the continued tightness in the warehouse sector. The rate of expansion for Warehouse Capacity is down (-5.5) to 55.1 which is the lowest reading for this metric since April. This is driven primarily by Downstream firms, who reported contracting Warehousing Capacity of 43.9 – a stark contrast with the 60.9-point expansion reported Upstream. Capacity also tightened in late December, reading in at 51.5 in the second half of the month (relative to 61.8 in early December). This corresponded with another shift during the month as Warehousing Utilization went from 52.9 up to 63.8. This pushed the overall Warehousing Utilization metric up to 60.2. This is up (+7.4) from November’s reading of 52.9, a reading which had caused us to wonder if we would see this metric move into contraction for the first time in the history of the index. After the surge in utilization in late December, a move towards contraction now appears highly unlikely. A sign of the continued growth of the industrial real estate space is the recent investment of Brad Jacobs (executive chairmen of XPO logistics) into a new company focused on supplying construction components to builders. Lately the majority of activity in U.S. real estate has been focused in warehousing and manufacturing, whether lower interest rates in 2024 could push some of this activity to residential building remains to be seen[10]. Labor continues to be a constraint along with space, leading to firms be more aggressive in incorporating autonomous vehicles and forklifts into their warehouses, shipping yards, intermodal facilities, and docks[11]. All these factors together have led Warehousing Prices to increase (+1.2) to 65.5. This move upwards could be a sign of things to come, particularly Downstream where respondents are forecasting an aggressive growth rate of 79.7 (to Upstream’s 67.4) over the next 12 months – likely indicating continued expectations of expansion in e-commerce throughout 2024.
Transportation continues to be in a bit of a holding pattern, showing the lowest average level of movement among our three sets of metrics. Transportation Capacity expanded at a slightly faster (+1.4) rate of 63.3 in December. Capacity growth was down significantly in the second half of the month, increasing from 56.8 to 66.9 – likely reflective of a slowdown in e-commerce orders from December 20th on. The abundance of capacity is manifested in orders for Class 8 trucks which were down in November for the fourth consecutive month. Despite this slowdown, the 242,000 trucks delivered through the first 11 months of the year is up 7.8% year-over-year. Interestingly, the types of trucks being ordered has shifted, with vocational vehicles (e.g. dump trucks) and private fleets making up a larger share of orders[12]. It will be interesting to observe whether the types of trucks being ordered will change significantly at any point; starting with the new year on January 1st, only electric trucks can be added to the fleets servicing Southern California’s ports. This is the beginning of a phased transition, in which carbon-burning trucks will be banned from the ports by 2035[13].
Transportation Utilization moved back towards expansion at 54.6, which is up (+4.6) from November when it read in as no movement at 50.0. Interestingly, utilization had been holding steady and then increased in the second half of the month (58.1 to 50.0) – potentially representing the last-minute shipping of holiday goods. Finally, Transportation Prices contracted slightly faster at a rate of 43.1 which is down (-1.1) from November’s reading of 44.2. This was driven more by slowness Upstream (40.6) than Downstream (48.5). At least some of this pricing is due to fuel prices. GasBuddy is predicting that fuel prices will continue to fall in 2024, hovering around $3.38 per gallon in the U.S. This would be down from the $3.51 average in 2023 and $3.95 in 2022. This comes despite output cuts from OPEC+, primarily because the U.S. is on pace to pump more oil than any country in the history of the world[14]. Fuel prices were one of the major drivers of supply-based inflation over the last two years, a decrease in costs would continue to push inflation down and help to revive the freight sector in 2024.
Looking forward, Upstream firms are predicting tighter Transportation Capacity (47.8 to Downstream’s 57.8), although both Upstream and Downstream predictions would be above current levels. We also see expectations of significant expansion for Transportation Price for both Upstream (65.9) and Downstream (77.3) firms. Both numbers would represent a major shift and clear ends to the freight recession that we have been mired in since April of 2022.
In general, it will be interesting to see where the logistics industry goes in 2024. In general, the macroeconomic picture in the U.S. was better than expected in 2023. When The economy grew approximately 3% (relative to predictions of 0.3%), unemployment was at 3.7% (relative to predictions of 4.8%), and an average of 232,000 jobs were added per month (as opposed to the job losses that were predicted due to interest hikes). To top it off, wages grew faster than inflation[15]. Despite the positive news, many consumers have been somewhat pessimistic about the economy[16], in what some are calling a “vibe-cession” in which consumers feel the economy is in bad shape despite positive numbers (and in many cases a positive personal situation). Even this may be shifting however, as the University of Michigan’s Consumer Sentiment was up to 69.7 in December from November’s reading of 61.3. While the Happiness Index was up as well[17]. As we will see from December’s future predictions, our respondents seem to share that optimism. If the economy exhibits the growth that both the consumers and logistics professionals are anticipating, 2024 will be a marked improvement over what the logistics industry of 2022-2023.
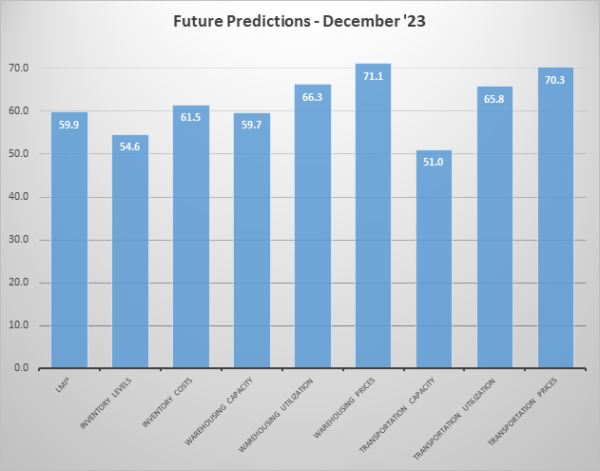
Respondents were asked to predict movement in the overall LMI and individual metrics 12 months from now. Future expectations remain optimistic about the future, with the overall index at 59.9 which is up (+2.5) from November’s prediction of 57.4. This is close to the all-time index average of 62.5 and would represent a healthy rate of expansion. Respondents are expecting Inventory Levels to grow slightly, but to turnover quickly in a JIT-style. This quick turnover is expected to drive demand for warehousing and transportation, with Warehousing and Transportation Prices expected to grow at rates over 70.0 even as capacity increases slightly for across the board. Inventories have been lean for months, but as we go into 2024 with a year of inventory reduction practices under our belt, it is likely that the normal seasonality that leads to capacity utilization in warehousing – and particularly freight – will return. Once again, we see that respondents are optimistic about the logistics industry in 2024. It will be interesting to see how accurate they are in that prediction as the new year begins.
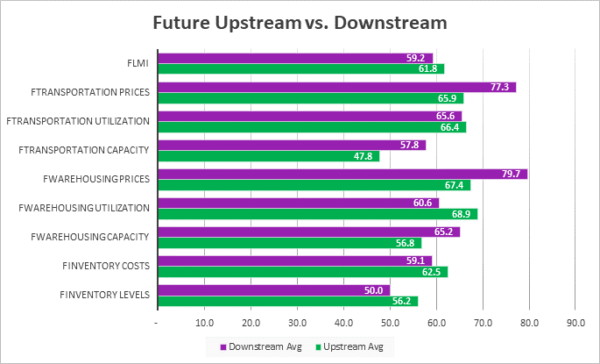
Unlike what we have seen through most of 2023, optimism regarding future changes comes from more from our Upstream respondents (green bars) than from their Downstream (purple bars) counterparts. After a year or dormancy, Upstream firms are expecting faster increases in Inventory Levels (56.2 to 50.0) and with a faster rate of contraction for Transportation Capacity. Taken together these suggest that Upstream firms will be moving a lot of inventory and will be hard pressed to find the transportation necessary to move it. On the other side of the supply chain Downstream firms are predicting significantly faster rates of growth in Warehousing Prices (79.7 to 67.4) and Transportation Prices (77.3 to 65.9). These price numbers in the high 70’s would represent a marked shift from 2023. When taken together with the Downstream prediction for Inventory Levels breaking even, we can take this as an expectation that inventories will turnover quickly and the costs of storing and moving goods quickly will grow quickly. It will be important to keep an eye on these cost levels, as supply costs have been a driver of inflation in the past (although that was at rates 10-15 points higher in our index).
| Futures | Inv. Lev. | Inv. Costs | WH Cap. | WH Util. | WH Price | Trans Cap. | Trans Util. | Trans Price | LMI |
| Upstream | 56.2 | 62.5 | 56.8 | 68.9 | 67.4 | 47.8 | 66.4 | 65.9 | 61.8 |
| Downstream | 50.0 | 59.1 | 65.2 | 60.6 | 79.7 | 57.8 | 65.6 | 77.3 | 59.2 |
| Delta | 6.2 | 3.4 | 8.3 | 8.3 | 12.3 | 10.1 | 0.8 | 11.3 | 2.6 |
| Significant? | No | No | No | No | Yes | Marginal | No | Marginal | No |
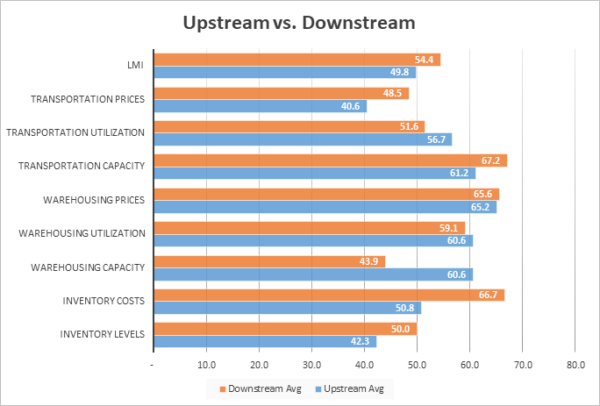
We also currently see some differences across the supply chain. In a repeat of last month, Downstream respondents (orange bars) reported growth in the overall index while their Upstream counterparts (blue bars) reported slight contraction. The root of this difference is Downstream Inventory Levels holding steady at 50.0 while Upstream inventories contract at 42.3. Due to this, Downstream firms have significantly higher Inventory Costs (66.7 to 50.8) and significantly lower Warehousing Capacity (43.9 to 60.6). Downstream firms are also paying higher prices for warehousing (65.6 to 65.2) and transportation (48.5 to 40.6). This dynamic may shift however as Upstream firms are predicting faster rates of growth in the overall index over the next 12 months (61.8 to 59.2), driven primarily by expectations of tighter Transportation Capacity and faster inventory growth.
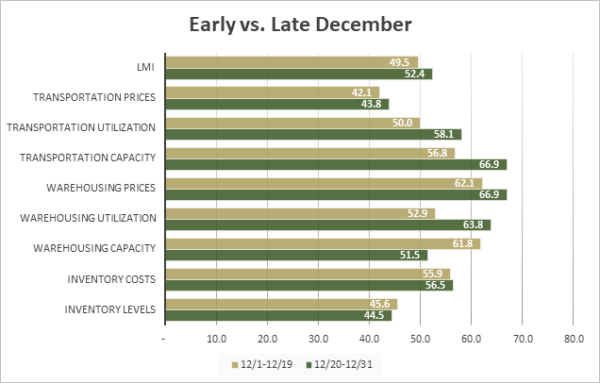
 Responses varied slightly from early (gold bars) to late (green bars) December. In a shift from November, where things were fairly uniform throughout the month, we see notable differences between the first and second halves of December. Warehousing Capacity was significantly lower (63.8 to 52.9) while Warehousing Utilization (63.8 to 52.9) and Transportation Capacity (66.9 to 56.8) were significantly higher. When combined with a slight dip in Inventory Levels, these shifts may indicate that most goods were done being shipped by December 20th, freeing up trucks and filling up warehouses. although it is likely that in-store purchases were happening, the most orders for online goods were likely placed by the 2oth. These movements led to growth in the overall LMI (52.4) in the second half of December after mild contraction (49.5) in the first half of the month. It will be interesting to see if this foreshadows further growth in January, or if we will dip back into contraction post-holiday (future predictions from respondents would seem to lean towards the former).
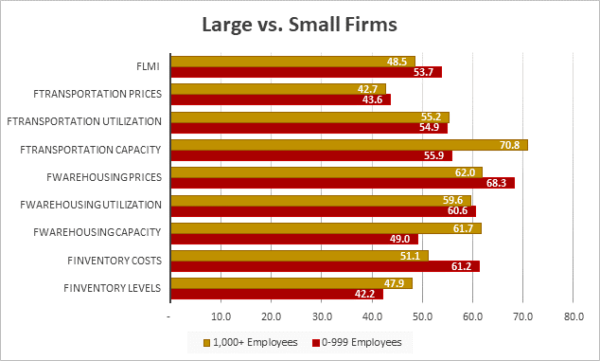
When comparing larger firms (those with 1,000 employees or more, represented by gold lines) and from smaller firms (those with 0-999 employees, represented by maroon lines) we see a continuation of what we saw last month, where smaller firms are seeing more movement than their larger counterparts. Smaller firms are seeing significantly faster rates of growth for Inventory Costs (61.2 to 51.1), significantly faster rates of contraction for Warehousing Capacity (49.0 to 61.7), significantly slower expansion for Transportation Capacity (55.9 to 70.8), and growth in the overall index relative to contraction in smaller firms (53.7 to 48.5). These differences could be stemming from a few factors, one is that smaller firms waited until the last moment to stock up on inventories and took advantage of excess capacity in the run up to the Christmas holiday – something that was hypothesized in this report earlier this Fall. The other possibility is that they are being squeezed out of both warehousing and transportation space by larger firms who are able to pay more. Whether it is one reason or the other, or perhaps a combination of the two, it will be interesting to see if smaller firms remain busier in the new year or if larger firms overtake them once again as they begin restocking post-holiday.
| Employees | Inv. Lev. | Inv. Costs | WH Cap. | WH Util. | WH Price | Trans Cap. | Trans Util. | Trans Price | LMI |
| 0-999 | 42.2% | 61.2% | 49.0% | 60.6% | 68.3% | 55.9% | 54.9% | 43.6% | 53.7% |
| 1,000+ | 47.9% | 51.1% | 61.7% | 59.6% | 62.0% | 70.8% | 55.2% | 42.7% | 48.5% |
| Delta | 5.7% | 10.2% | 12.7% | 1.0% | 6.3% | 15.0% | 0.3% | 0.9% | 5.2% |
| Significant? | No | Marginal | Marginal | No | No | Yes | No | No | Marginal |
The index scores for each of the eight components of the Logistics Managers’ Index, as well as the overall index score, are presented in the table below. The overall index is back to a very slight level of expansion following last month’s foray into mild contraction. We also see continued contraction in Transportation Prices and Inventory Levels. Transportation Utilization has moved back towards expansion after holding steady at 50.0 in November, joining the other five sub-metrics in expansion.
| LOGISTICS AT A GLANCE | |||||
| Index | December 2023 Index | November 2023 Index | Month-Over-Month Change | Projected Direction | Rate of Change |
| LMI® | 50.6 | 49.4 | +1.2 | Expanding |
From Contraction |
| Inventory Levels | 44.3 | 44.3 | 0.0 | Contracting |
No Change |
| Inventory Costs | 55.8 | 62.1 | -6.3 | Expanding | Slower |
| Warehousing Capacity | 55.1 | 60.6 | -5.5 | Expanding | Faster |
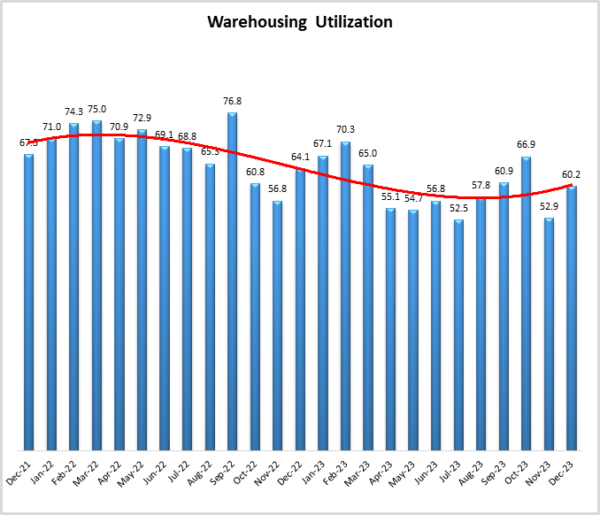
| Warehousing Utilization | 60.2 | 52.9 | +7.4 | Expanding | Faster |
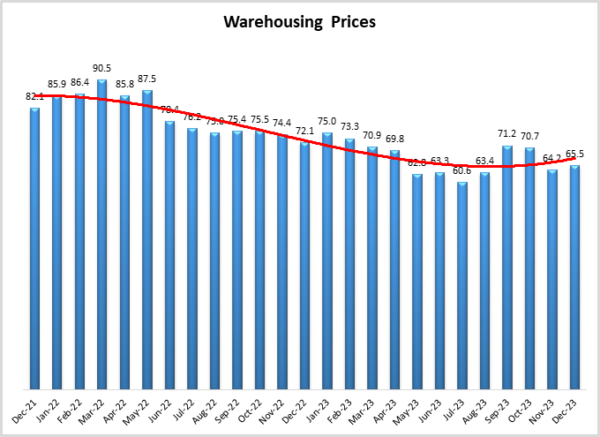
| Warehousing Prices | 65.5 | 64.2 | +1.2 | Expanding | Faster |
| Transportation Capacity | 63.3 | 61.8 | +1.4 | Expanding | Faster |
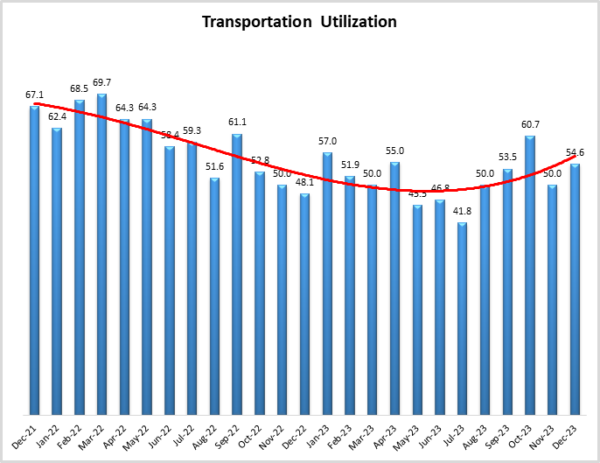
| Transportation Utilization | 54.6 | 50.0 | +4.6 | Expanding |
From No Change |
| Transportation Prices | 43.1 | 44.2 | -1.1 | Contracting | Faster |
Historic Logistics Managers’ Index Scores
This period’s along with prior readings from the last two years of the LMI are presented table below:
| Month | LMI | Average for last 3 readings – 52.2
All-time Average – 62.5 High – 76.2 Low – 45.4 Std. Dev – 8.34
|
| Dec ‘23 | 50.6 | |
| Nov ‘23 | 49.4 | |
| Oct ‘23 | 56.5 | |
| Sep ‘23 | 52.4 | |
| Aug ‘23 | 51.2 | |
| July ‘23 | 45.4 | |
| June ‘23 | 45.6 | |
| May ‘23 | 47.3 | |
| Apr ‘23 | 50.9 | |
| Mar ‘23 | 51.1 | |
| Feb ‘23 | 54.7 | |
| Jan ‘23 | 57.6 | |
| Dec ‘22 | 54.6 | |
| Nov ‘22 | 53.6 | |
| Oct ‘22 | 57.5 | |
| Sep ‘22 | 61.4 | |
| Aug ‘22 | 59.7 | |
| July ‘22 | 60.7 | |
| June ‘22 | 65.0 | |
| May ‘22 | 67.1 | |
| Apr ‘22 | 69.7 | |
| Mar ‘22 | 76.2 | |
| Feb ‘22 | 75.2 | |
| Jan ‘22 | 71.9 | |
| Dec ‘21 | 70.1 |
LMI®
The overall index reads in at 50.6 in December. This is up (+1.2) from November’s reading of 49.4 and back into (mild) expansion territory. While inventories did continue to contract, the overall index still moved back into expansion due to growth across the warehousing metrics and in Transportation Utilization. When taken together it appears that inventories are cycling through systems quickly, keeping utilization and storage costs high. This is particularly pronounced Downstream, where Inventory Costs are much higher (66.7 to 50.8) and Warehousing Capacity is much lower (43.9 to 60.6) – leading to overall growth Downstream and mild contraction Upstream (54.4 to 49.8).
Despite the move towards contraction, respondents remain optimistic regarding future growth. The predicted expansion rate over the next 12 months is 59.9 which is up (+2.2) from November’s future prediction of 57.4. This is comfortably into expansion territory and close to the all-time average of 62.5. In a flip of what we see today, Upstream firms are slightly more optimistic than their Downstream counterparts (61.8 to 59.2), perhaps reflecting a coming increase in manufacturing and B2B commerce.
Inventory Levels
The Inventory Level value is 44.3 in December, which is exactly where it was in November as well. We have now seen Inventory Levels decline in 7 of the last 8 months. Levels are 13.0 points lower than a year ago, and 17.3 points lower than two years ago that this time. This month’s reading are surely a relief for firms that have – quite unseasonably – seen inventories increase in the past two Decembers. The contraction over the last two months suggest that firms have done a much better job at managing their inventories in 2023 relative to 2020-2022. This month, upstream respondents returned a value of 42.3, a decrease, while downstream respondents returned 50.0, showing exactly no change and offering further evidence that retailers have fully reembraced JIT strategies. .
When asked to predict what conditions will be like 12 months from now, the average value is 54.6, up (+4.6) from November’s future prediction of 50.0. Interestingly, Downstream respondents are still predicting growth of 50.0, indicating expectations of fast-moving goods over the next year. Upstream firms are not far off from that, predicting a mild expansion of 56.2 for 2024.

Inventory Costs
Inventory costs are 55.8 in December, this is the lowest reading for this metric in the history of the index and is down (-6.3) from November’s reading of 62.1. When combined with last month’s drop, Inventory levels are down 14.0-points from October. The slowdown in costs is the product (and reward) of the aggressive inventory reduction we have seen from firms throughout 2023. For perspective, this value is 17.0 points lower than last year, and 28.2 points lower than two years ago. Both upstream and downstream reported increased inventory costs, but upstream reported 50.8, a trivial amount of increase, while downstream reported 66.7, a significant increase in costs. Additionally, smaller firms reported an inventory cost of 61.2, an increase, while larger firms reported a value of 51.1, a marginal increase which is likely reflective of their ability to obtain cheaper, more efficient storage solutions.
Predictions for future Inventory Cost growth is 61.5, down (-4.5) from November’s prediction of 65.8. I Upstream respondents’ future predictions averaged 62.5, while downstream respondents averaged 59.1, a similar increase. Above, we saw Upstream respondents expect larger increases in Inventory Levels, and we also see Upstream respondents expect higher levels of Inventory Costs.
Warehousing Capacity
The Warehousing Capacity index registered in at 55.1 for the month of December 2023, reflecting a 5.1-point decrease from the reading last month. This reading is up 10.4-points from the reading one year ago, and up 8.6-points from the reading two years ago. In addition, there was a 16.7-point split between Upstream (60.6) and Downstream (43.9) which was statistically significant (p<.05). Comparing the differences between small (<999 employees) and large (>999) employers we see that these values are 49.0 and 61.7, respectively. This 11.7-point split was marginally statistically significant (p<.1).
Finally, exploring the future predictions for this value we see that Warehouse Capacity is expected to continue to stay in expansionary territory at 59.7, up slightly (+1.4) from November’s future prediction of 56.3. Future Upstream expectations (56.8) are lower than Downstream expectations (65.2) which may be indicative of the former building up inventories while the latter maintains a high rate of turnover.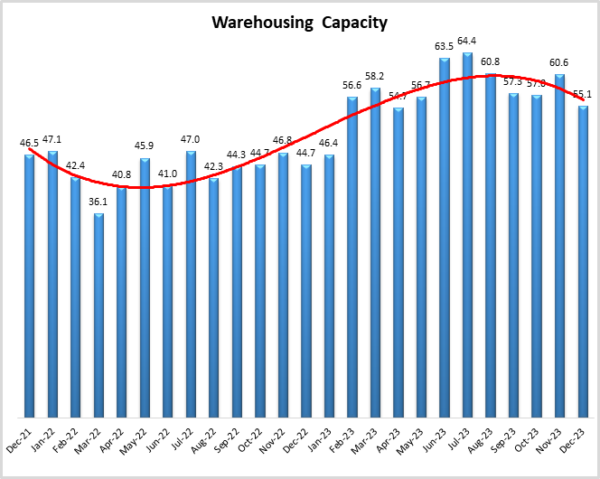
Warehousing Utilization
The Warehousing Utilization index registered in at 60.2-points for the month of December 2023, reflecting a 7.3-point increase from the month prior. This reading is down 6.6-points from the reading one year ago, and down 7.3-points from the reading two years ago. In addition there was a 1.7-point split between Upstream (60.6) and Downstream (43.9) which was not statistically significant (p>.1). Comparing the differences between small (<999 employees) and large (>999) employers we see that these values are 60.6 and 59.6, respectively. This 1.0-point split was not statistically significant (p>.1).
Finally, exploring the future predictions for this value we see that Warehouse Utilization is expected to continue to stay in expansionary territory at 66.3, up (+7.5) from November’s future prediction of 58.8. Future Upstream expectations (68.9) are higher than Downstream expectations (60.6), correlating with the predicted buildup of Upstream inventories.
Warehousing Prices
The Warehousing Price index registered in at 65.5-points for the month of December 2023, reflecting a 1.3-point increase. This reading is down 3.9-points from the reading one year ago, and down 16.6-points from the reading two years ago. In addition, there was a 0.4-point split between Upstream (60.6) and Downstream (43.9) which was not statistically significant (p>.1). Comparing the differences between small (<999 employees) and large (>999) employers we see that these values are 68.3 and 62.0, respectively. This 6.3-point split was not statistically significant (p>.1).
Finally, exploring the future predictions for this value we see that Warehouse Prices are expected to continue to stay in expansionary territory at 71.1, this is up (+5.8) from November’s future prediction of 65.3 and would represent a significant rate of price expansion. Future Upstream expectations (67.4) are lower than Downstream expectations (79.7). This comes despite Downstream firms expecting more capacity and slower utilization growth. Taken together, this strongly suggests that retailers are expecting to move a high volume of inventory through their supply chains quickly.
Transportation Capacity
The Transportation Capacity Index registered 63.3 in December, up (+1.5) from November’s reading of 61.8. Transportation Capacity was much tighter for smaller firms (55.9) than for their larger counterparts (70.8), possibly indicating that smaller firms were boxed out of the spot market during the December rush. Capacity did loosen up during late December relative to the first half of the month (66.9 to 56.8), suggesting that shipping began to cool down as we reached the end of December. The Upstream Transportation Capacity index is at 61.2, while the Downstream index is at 67.2.
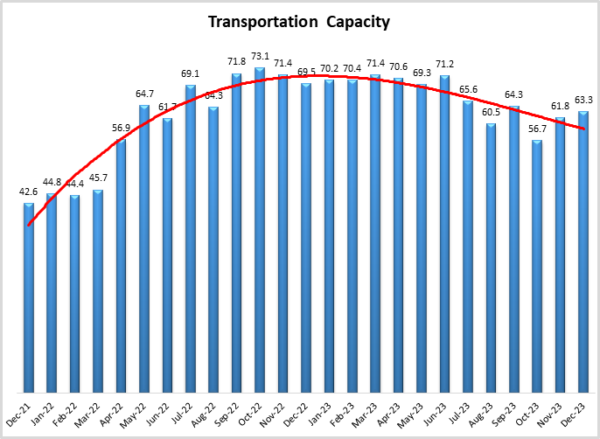
The future Transportation Capacity index indicates 51.0, up (+2.8) from November’s future prediction of 48.2. This is the first time in three months that this metric has been in expansion territory. However, the score of 51.0 suggest that capacity will be added on something close to an as-needed basis as the freight market moves towards a healthier rate of equilibrium. The Downstream future Transportation Capacity index is at 57.8 while the Upstream future Transportation Capacity index indicates 47.8. Upstream firms are expecting less space to be available as they rebuild stocks of inventory, while Downstream firms anticipate space freeing up as they move goods through the system more quickly, and also possibly build new fulfillment centers to facilitate e-commerce.
Transportation Utilization
The Transportation Utilization Index registered 54.6 in December 2023, this is up (+4.6) from November’s reading of 50.0 and moves the metric back into expansion territory. The expansion was more pronounced in the second half of the month, where it utilization grew at a clip of 58.1 – up notedly from the “hold-steady” rate of 50.0 in the first half of December. Upstream firms were busier at 56.7 to Downstream’s 51.6 which was interesting given the business we generally see from retailers (and did for all other metrics) during December.
The future Transportation Utilization Index reads in at 65.8 which is up (+3.5) from November’s future prediction of 62.3 and indicates an expectation for steady growth over the next 12 months. The Upstream Transportation Utilization index is at 65.6 while the Downstream index is at 66.4. So, the expectations of steady continued growth in Transportation Utilization are relatives evenly distributed across the supply chain.
Transportation Prices
The Transportation Prices Index reads in at 43.1 in December 2023, down slightly (-1.1) from November’s reading of 44.2. Hence, this price index remains in slight contraction territory. There has not been much variance in this metric, as it has stayed within a range of 42.9-44.4 (a range of 1.5-points) since August – which was the first reading post-Yellow. Respondents are predicting growth in this metric in the near future, but for the second half of 2023, Transportation Prices were mildly contracting across the board. Downstream firms saw a slower contraction at 48.0 to Upstream’s 40.6, but it is the first reading back in contraction Downstream since early this Fall.
The future index for Transportation Prices is 70.3, up (+6.5) from November’s future prediction of 63.8. A prediction above 70.0 indicates expectations for significant expansion of price in the coming year. Taking a more granular view, the Downstream Transportation Prices index is at 77.3 while the Upstream Transportation Prices index is at 65.9, so both are expecting price increases. The high expectations for retailers corroborates the expectations for high volumes of fast-moving inventory in 2024.
About This Report
The data presented herein are obtained from a survey of logistics supply executives based on information they have collected within their respective organizations. LMI® makes no representation, other than that stated within this release, regarding the individual company data collection procedures. The data should be compared to all other economic data sources when used in decision-making.
Data and Method of Presentation
Data for the Logistics Manager’s Index is collected in a monthly survey of leading logistics professionals. The respondents are CSCMP members working at the director-level or above. Upper-level managers are preferable as they are more likely to have macro-level information on trends in Inventory, Warehousing and Transportation trends within their firm. Data is also collected from subscribers to both DC Velocity and Supply Chain Quarterly as well. Respondents hail from firms working on all six continents, with the majority of them working at firms with annual revenues over a billion dollars. The industries represented in this respondent pool include, but are not limited to: Apparel, Automotive, Consumer Goods, Electronics, Food & Drug, Home Furnishings, Logistics, Shipping & Transportation, and Warehousing.
Respondents are asked to identify the monthly change across each of the eight metrics collected in this survey (Inventory Levels, Inventory Costs, Warehousing Capacity, Warehousing Utilization, Warehousing Prices, Transportation Capacity, Transportation Utilization, and Transportation Prices). In addition, they also forecast future trends for each metric ranging over the next 12 months. The raw data is then analyzed using a diffusion index. Diffusion Indexes measure how widely something is diffused or spread across a group. The Bureau of Labor Statistics has been using a diffusion index for the Current Employment Statics program since 1974, and the Institute for Supply Management (ISM) has been using a diffusion index to compute the Purchasing Managers Index since 1948. The ISM Index of New Orders is considered a Leading Economic Indicator.
We compute the Diffusion Index as follows:
PD = Percentage of respondents saying the category is Declining,
PU = Percentage of respondents saying the category is Unchanged,
PI = Percentage of respondents saying the category is Increasing,
Diffusion Index = 0.0 * PD + 0.5 * PU + 1.0 * PI
For example, if 25 say the category is declining, 38 say it is unchanged, and 37 say it is increasing, we would calculate an index value of 0*0.25 + 0.5*0.38 + 1.0*0.37 = 0 + 0.19 + 0.37 = 0.56, and the index is increasing overall. For an index value above 0.5 indicates the category is increasing, a value below 0.5 indicates it is decreasing, and a value of 0.5 means the category is unchanged. When a full year’s worth of data has been collected, adjustments will be made for seasonal factors as well.
[1] Nassauer, S., & Kapner, S. (2023, December 26). Shoppers Kept Spending This Holiday Season. WSJ. https://www.wsj.com/business/
[2] Harrison, D., & Omeokwe, A. (2023, December 22). Prices Fell in November for the First Time Since 2020. Inflation Is Approaching Fed Target. WSJ. https://www.wsj.com/economy/
[3] Shapiro, A. (2023, December 28). Supply- and Demand-Driven PCE Inflation. December, 2023. San Francisco Fed. https://www.frbsf.org/
[4] Byers, H. (2023, September 5). Ocean carriers’ record rejections last-ditch effort to bolster spot rates. FreightWaves. https://www.freightwaves.com/
[5] LaRocco, L. A. (2023, December 21). Container rates hit $10,000 as ocean freight inflation soars in Red Sea crisis. CNBC. https://www.cnbc.com/2023/12/
[6] Ames, B. (2023, December 22). Rail group cheers White House move to reopen Mexico border crossing | DC Velocity. DC Velocity. https://www.dcvelocity.com/
[7] Mahoney, N. (2023, December 27). Mexico’s booming exports expected to boost cross-border trade in 2024. FreightWaves. https://www.freightwaves.com/
[8] Young, L. (2023b, December 26). Retailers Are Bracing for Their Postholiday Returns Hangover. Wall Street Journal. https://www.wsj.com/articles/
[9] Pisani, J. (2023, December 25). Return Policies Have Gotten More Annoying This Holiday Season. WSJ. https://www.wsj.com/business/
[10] Young, L. (2023a, December 11). Brad Jacobs Targets Construction Materials for Next Billion-Dollar Rollup. Wall Street Journal. https://www.wsj.com/articles/
[11] Berger, P. (2023, December 21). Self-Driving Vehicles Are Finding a Home in Industrial Operations. Wall Street Journal. https://www.wsj.com/articles/
[12] Adler, A. (2023, December 27). New Class 8 truck deliveries fall for 4 consecutive months. FreightWaves. https://www.freightwaves.com/
[13] Eavis, P., & Abramson, M. (2023, December 28). California Pushes Electric Trucks as the Future of Freight. The New York Times. https://www.nytimes.com/2023/
[14] Egan, M. (2023, December 27). Gas prices will fall in 2024 and Americans will spend $32 billion less on fuel, GasBuddy predicts | CNN Business. CNN. https://www.cnn.com/2023/12/
[15] Rattner, S., & Maggiacomo, T. (2023, December 28). Opinion | More Than Words: 10 Charts That Defined 2023. The New York Times. https://www.nytimes.com/
[16] Lahart, J. (2023, December 27). How Can Spending Be Up When People Feel Down? WSJ. https://www.wsj.com/economy/
[17] Hsu, J. (2023, December 22). Sentiment soars as consumers expect easing of inflation. University of Michigan News. https://news.umich.edu/


