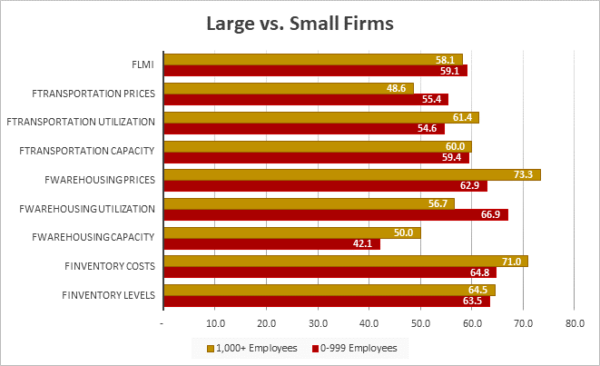
Growth is INCREASING AT AN INCREASING RATE for inventory levels, inventory costs, warehousing prices, and transportation utilization. Growth is INCREASING AT A DECREASING RATE for warehousing utilization, transportation capacity, and transportation prices. Warehousing capacity is CONTRACTING
The Logistics Manager’s Index reads in at 58.3 in March 2024. This is up (+1.8) from February’s reading of 56.5. This is the fastest rate of expansion in the overall index since the reading of 61.2 from 18 months ago in September of 2022. The logistics industry is at a healthier place than it was then however. That reading from 18 months ago was largely inflated by unwanted inventories and high Warehousing Costs along with an anemic freight market. March of 2024 is a different story as we are seeing long-planned inventory expansions, along with more efficient levels of utilization in both warehousing and transportation as the drivers of growth. The level of 58.3 is within half a standard deviation from the all-time average of 62.2, suggesting that the overall logistics industry is now at the low end of what we would consider healthy and normal growth. Other signs of this health are that the growth has been consistent for Upstream (57.9) and Downstream (60.8), and also smaller (59.1) and larger (58.1) firms.
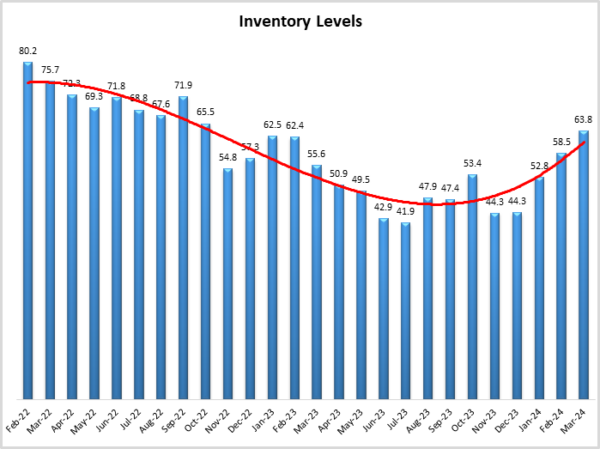
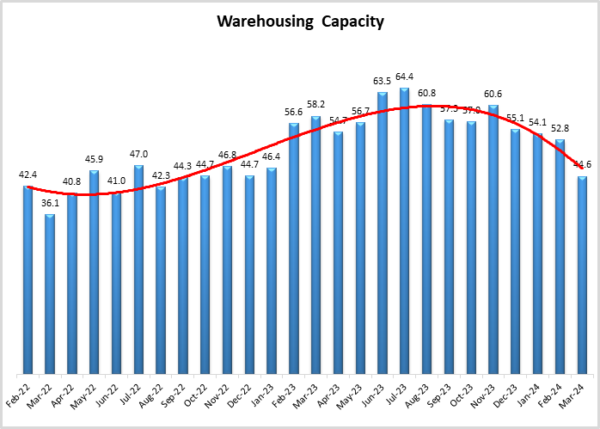
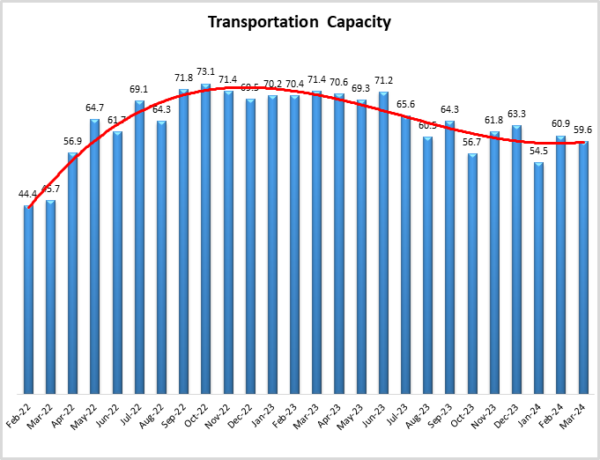
The change this month was primarily driven by a continued rebuilding of Inventory Levels (+5.3) which at 63.8 are at their highest level since October 2022. This growth has had cascading effects on tightening Warehousing Capacity (-8.2) which is back into contraction territory for the first time since January 2023. These changes suggest that firms are building up inventories in anticipation of continued consumer spending and suggests that the economy will continue to grow in the near-term. Transportation Capacity is down (-1.3), but at 59.6 is still higher than Transportation Prices (53.0), meaning that we are not yet ready to call an end to the freight recession. Although it is much less severe than it was six months or a year ago.
Researchers at Arizona State University, Colorado State University, Florida Atlantic University, Rutgers University, and the University of Nevada, Reno, and in conjunction with the Council of Supply Chain Management Professionals (CSCMP) issued this report today.

Results Overview
The LMI score is a combination of eight unique components that make up the logistics industry, including: inventory levels and costs, warehousing capacity, utilization, and prices, and transportation capacity, utilization, and prices. The LMI is calculated using a diffusion index, in which any reading above 50.0 indicates that logistics is expanding; a reading below 50.0 is indicative of a shrinking logistics industry. The latest results of the LMI summarize the responses of supply chain professionals collected in March 2024.
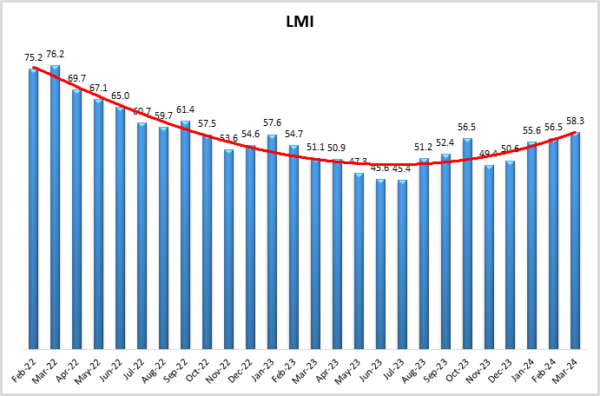
The LMI read in at 58.3 in March, up (+1.8) February’s reading of 56.5. This is the seventh time in the last eight months that the LMI has shown expansion. This growth is driven by the buildup of inventories, the subsequent tightening of warehousing, and the ongoing slow yet steady recovery in transportation. The overall index is now at the low end of healthy levels of growth, closing in on the all-time average of 62.2 and is pointing towards steady economic growth in the near term. The broader optimism of our respondents is reflected in the University of Michigan’s Index of Consumer Sentiment which is up (+3.3%) to 79.4 in March and is 28.1% higher than a year ago. Consumers are confident about both the current state of the economy, and that inflation will continue to slow down[1]. Wall Street seems to be confident as well as the S&P 500 ended the first quarter up 10%. With growth coming from all 11 sectors of the index, this is the best opening to a year for the index since 2019. Historically, first quarters this strong have portended strong growth through the rest of the year[2]. It will be interesting to see if this momentum holds through the rest of 2024.
Underlying this is continued job growth and slowing inflation. The U.S. added 275,000 jobs in February on the back of 229,000 jobs added in January. On the flip side, with more people entering the labor force the unemployment rate is up to 3.9%, which is higher bust still historically low as the U.S. has now seen unemployment under 4% for 25 consecutive months[3]. Evidence that the uptick in the unemployment rate is due more to a growing labor force than to job losses can be seen in jobless claims dipping down to only 210,000 new claims in the last week of March[4]. This is a continuation of the end of 2024 as U.S. economic growth in Q4 2023 was revised up from 3.2 to 2.4%. The Atlanta Federal Reserve estimates that it is growing at a rate of 2.1% in Q1 2024, but at this point that is still a speculative number[5]. As for inflation, many analysts are predicting that interest rates will need to come down by June or July for the Fed to meet its forecast of three rate cuts in 2024. Citi expects hiring to slow in Q2, which would leave an opening for the Fed to begin cooling rates [6].
As is often the case, inventories are the straw that stirs the drink in the logistics industry. Inventory Levels were up (+5.3) to 63.8 in March, which is their highest level since October of 2022 when firms were desperate to slash inventories. Since this time, Inventory Levels have largely registered in the 50’s and 40’s, including contracting in seven of eight months from May to December of 2023. They have been increasing steadily since then and moving back into the mid-60’s in March suggests that many firms are now back to business as normal. This normalcy has returned in part due to continued consumer activity. Consumer spending was up 0.6% in February as U.S. consumers continue to spend past analyst expectations of post-covid “revenge spending”. While a significant chunk of this spending is on services such as flights and meals, retailers are seeing some impact as well[7]. The savings accounts many consumers built up during covid have dwindled, leading some analysts to speculate whether younger generations are not saving for things like home ownership (particularly in metros where prices may put things like that out of reach), and are instead spending on smaller-ticket goods. Whatever the cause, this steady stream of activity has led to a steady stream of goods flowing through supply chains.
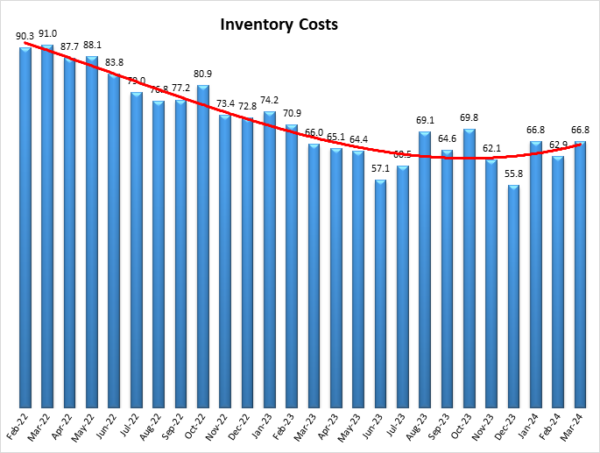
This increase in volumes has naturally come with an increase in costs as well. Inventory Costs are up (+3.9) to 66.8. Unlike what we saw in 2023, many of these costs are being generated Upstream. Upstream firms reported robust growth in Inventory Levels (64.8) whereas their Downstream counterparts reported mild contraction (46.7) – likely reflecting the unexpected consistency in consumer spending that was mentioned above. Due to this, Upstream (70.2) Inventory Costs are also higher than what is being reported Downstream (63.3).
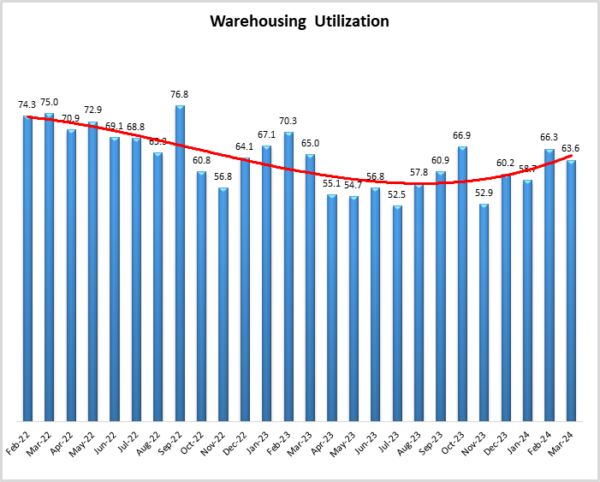
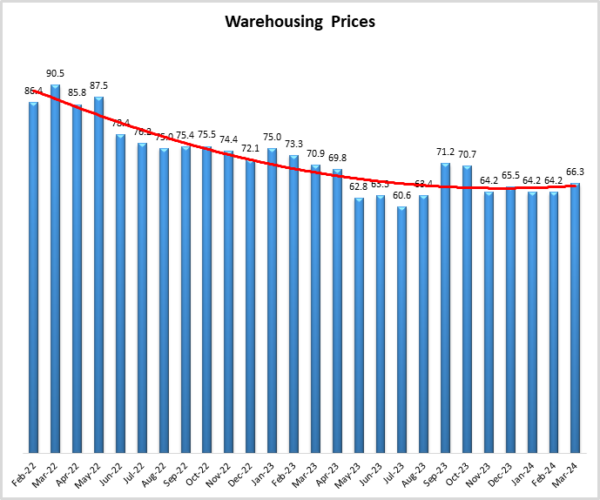
Anecdotal evidence of the increase in Upstream inventories and warehousing needs is Home Depot’s plan to add four distribution centers dedicated to handling bulky items purchased by contractors and larger construction firms. These types of materials are often moved via flat-bed truck, and increased volume could push the Upstream freight market back towards expansion[8]. Growing inventories are clearly impacting the warehousing industry. Warehousing Capacity is down (-8.2) to 44.6, the first time this metric has been in contraction since January 2023. This capacity tighter for smaller firms (42.1) than for their larger counterparts (50.0). This tightness is driving up the growth rate of Warehousing Prices as well (+2.1) which read in at 66.3 in March. Warehousing Utilization is also growing at 63.6, but at a slightly slower rate (-2.7) than February.
Link Logistics CEO Luke Petherbridge expects his firm to increase their portfolio by 86 million square feet, which would be on par with their growth from last year. Much of this movement is driven by increased demand for urban locations that can facilitate last-mile delivery[9]. Black stone is making a similar move, acquiring 48 properties with three million square feet of industrial space. The scarcity of space in LA and Orange County markets (where this purchase took place) is the reason that the price came out to $332 per square foot and reflects the continuing tightness in the U.S.’s largest markets[10]. Conversely, Kroger is shuttering three cross docking facilities in the southern U.S. These facilities had come online in the last few years and were designed to act as waypoints for ecommerce grocery deliveries[11]. Post-pandemic however, it seems that this level of delivery capacity is no longer required for one of the U.S.’s largest grocers. Relatedly, UPS may shutter up to 200 sort centers by 2026 as they attempt to optimize their network to cut costs. This is necessary because inflation and the plateau in e-commerce growth means that instead of delivering the 108 million packages they had predicted, 88 million were delivered in 2024[12]. The days of rampant expansion based around e-commerce have passed, and now delivery giants like UPS, USPS, and Amazon are moving back into an “exploitation” phase, in which they are looking more to optimize than to expand.
These anecdotes are important as a reminder that the economy is not monolithic, and that even as demand for warehousing in some industries is increasing, in others it seems to be falling. A major instance of this difference is the slowdown in demand for e-commerce platforms and the increase for facilities to support manufacturing. E-commerce has settled into a “new normal” of around 15% of total retail, while at the same time manufacturing construction is increasing due to the push for nearshoring and reshoring[13]. Future predictions support this, as Upstream respondents predict significantly higher rates of Warehousing Utilization than their Downstream counterparts by a rate of 64.6 to 53.6.
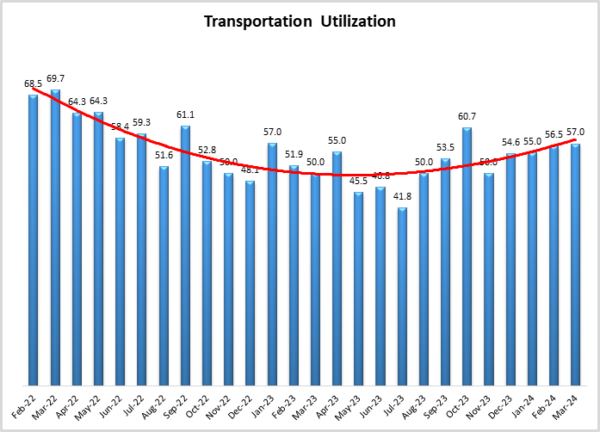
Relative to inventory and warehousing, there was less movement among our transportation metrics in March. Available Transportation Capacity dipped slightly (-1.3) to 59.6. Transportation Capacity moved even less (+0.5), increasing to 57.0 – although it should be pointed out that we did see a significant difference between Upstream (53.6) and Downstream (64.5) firms regarding this metric. In general, we are seeing mixed news on the transportation front, with some firms feeling more confident than others. For instance, OnTrac announced in the last week of March that they would be moving to a seven day a week delivery schedule with the goal to offer faster shipping times and provide a higher service level. This move runs counter to the post-pandemic paring down of delivery windows that has happened with firms like FedEx. Experts are divided on whether Sunday deliveries are a profitable strategy as they require significant volume to counteract higher weekend delivery fees[14]. It will be interesting to observe whether U.S. consumers will continue purchasing at volumes that justify this strategy.
Conversely, Hapag-Lloyd, one of the five largest ocean carriers in the world, is expecting earnings to be down significantly for 2023. While volumes were only down 0.5%, freight rates fell 48% as the bottom dropped out of international shipping, which is partially due to the high number of newly-finished ships that were ordered during covid and have only recently rolled off the line[15]. In ocean carrier market we see a bullwhip effect similar to what we saw with ground fleets in 2022. The primary differences being that shipbuilding is slower and more expensive than ordering class-8 trucks. Because of these factors, this instance of the bullwhip came later, and may hit just as hard as what we saw in the trucking industry. In general, ocean shipping is facing several difficulties. The biggest news in global shipping was of course the tragic accident in which a cargo ship took down the Francis Scott Key Bridge in Baltimore. This will essentially shutter the port of Baltimore for the foreseeable future. While Baltimore is a key port for goods like coal, autos, and heavy machinery, it is likely that these commodities will be able to ship out elsewhere on the East Coast[16]. That being said, there will likely be an associated cost increase in the absence of the fifth-busiest port on the U.S. East Coast. This reshuffling could lead to more demand for both rail and over-the-road shipments on the East Coast as firms alter their supply networks. As volume has shifted back to from the East to the West Coast, transloading – in which containers are shifted back and forth between truck and rail – has increased in popularity once again. This shift in strategy is necessitated by the double-digit shift in volumes back to California (due to issues at both the Suez and Panama Canals). Moves like this, which can speed up ground shipping are necessary in the current environment where ocean shipping times have become so inflated without access to the two canals[17].
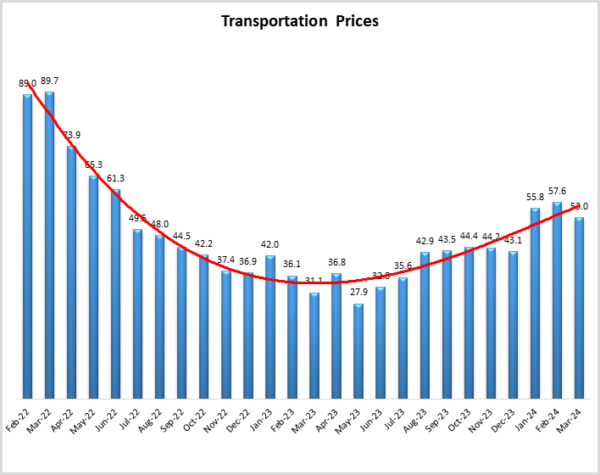
Transportation Prices are growing, but at 53.0 it is a lower rate (-4.6) than February. Even with this slow down, Transportation Prices have now increased for three consecutive months following what had been 18 straight months of decline. Diesel fuel was up 0.006 dollars per gallon in the last week of March, but still down 9.4 cents from a year ago, providing some relief to carriers. Regular U.S. drivers are seeing no such relief, as prices are up 10.2 cents per gallon from a year ago and making inflation stickier than some had predicted[18]. Wall Street traders are betting these increased prices will bump production at U.S. refineries back into high gear, which may relieve some of this glut and help juice consumer spending[19]. Some evidence that consumer spending and the economy overall will continue to gain speed is in the future prediction that Transportation Prices will increase at a rate of 75.3 over the next 12 months. Transportation Prices are the most reactive of the LMI metrics and tend to be a strong predictor of overall economic activity. If Transportation Prices truly end up increasing at elevated rate, it may portend good things to come.
That being said, there is also uncertainty regarding the future. EPA regulations released the last Friday of March aims to limit the amount of pollution allowed from any truck manufacturer’s production line over time, with limits beginning for 2027 model year vehicles. If executed upon, these rules could reduce greenhouse gas emissions by approximately one billion tones by 2055. There are challenges to meeting this, as heavy-duty electric trucks are still significantly more expensive than their traditional counterparts, and the necessary charging station infrastructure is not yet in place. Because of this, the largest impacts from these regulations will be on short-haul vehicles that run less than 250 miles per day on average and can recharge in the same place each night[20]
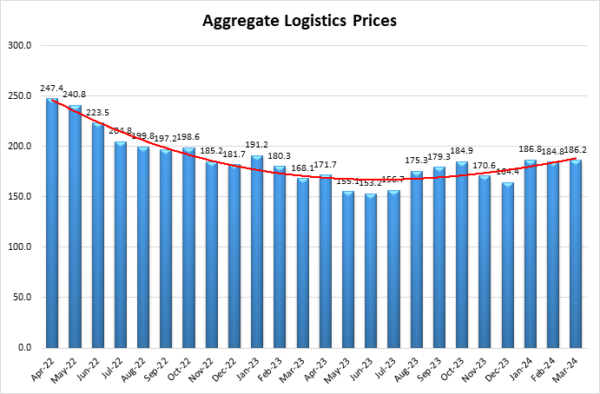
A continuing reason for the “stickiness” of inflation through Q1 of 2024 has been the steady growth of supply costs. Core inflation slowed in February are core prices were only up 0.3% from January (they had been up 0.5% from December to January) (Wiseman, 2024c). Interestingly, supply-driven costs have been the biggest drivers of monthly core and headline inflation (Shapiro, 2024). This was reflected in last month’s overall logistics costs, which read in at 184.8 (down from 186.8 in January). In March, this metric reads in at 186.2 which is closer to what we saw in January. This is a small movement and does not guarantee that we will see inflation increase. But it should be noted that supply costs are increasing, which could put some pressure on prices.
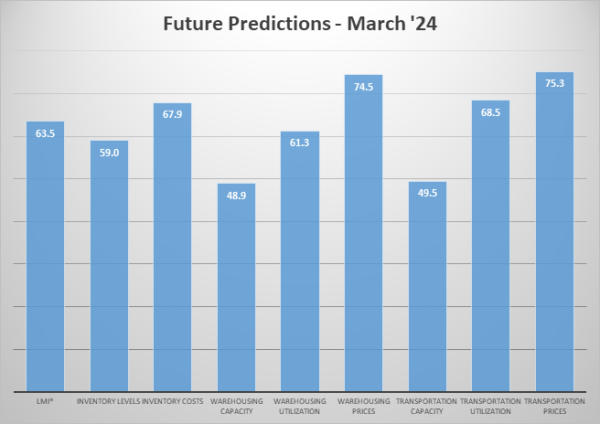
Respondents were asked to predict movement in the overall LMI and individual metrics 12 months from now. Respondents continue to be largely optimistic about the future of the logistics industry, predicting an overall growth rate of 63.5, which is up (+1.7) from February’s future prediction of 61.8, and fairly consistent with January’s future prediction of 62.8. The three future predictions through Q1 of 2024 have all triangulated around the all-time average of 62.2 for the overall index, which suggests that the logistics industry will grow at a healthy, sustainable pace throughout the rest of the year. This moderated growth is at least partially due to a prediction that capacity will finally be right-sized, with mild contraction – bordering on no movement – predicted for Warehousing Capacity (48.9) and Transportation Capacity (49.5). The tightness in Capacity is predicted to lead to corresponding increases for both Warehousing (74.5) and Transportation (75.3) Prices. This type of price growth may be possible if Inventory Levels also follow respondent predictions at 59.0. A reading at this level suggests that inventories will move through supply chains at a fairly steady pace, necessitating constant use of available warehousing and transportation through the rest of 2024.
The future expectations from our Upstream respondents (green bars) and their Downstream (purple bars) counterparts differ across a few key metrics in March, all of which are predicated on the expectation that Upstream firms will be building up inventories more aggressively over the next 12 months. Upstream firms ran relatively lean through 2023 and are looking to make up for it in 2024. They are predicting robust rates of growth in Inventory Levels (64.8) which contrasts sharply with the mild contraction (46.7) predicted by Downstream firms. This directly leads to a non-significant difference in Inventory Costs (70.2 Upstream to 63.3 Downstream) and a marginally significant difference in Warehousing Utilization (64.6 Upstream to 53.6 Downstream). Upstream reports slightly busier readings across nearly every metric (including mild contraction in Transportation Capacity). Downstream respondents are only expecting greater levels of activity for Transportation Prices growth at a difference of 80.6 to 72.9. Based on these readings, it seems that Upstream firms are expecting to “catch up” to their Downstream counterparts over the next 12 months.
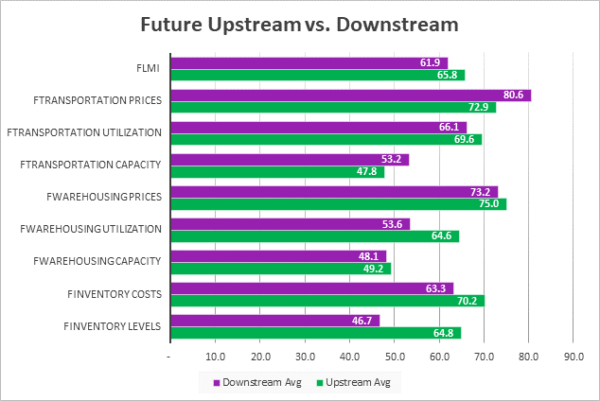
| Futures | Inv. Lev. | Inv. Costs | WH Cap. | WH Util. | WH Price | Trans Cap. | Trans Util. | Trans Price | LMI |
| Upstream | 64.8 | 70.2 | 49.2 | 64.6 | 75.0 | 47.8 | 69.6 | 72.9 | 65.8 |
| Downstream | 46.7 | 63.3 | 48.1 | 53.6 | 73.2 | 53.2 | 66.1 | 80.6 | 61.9 |
| Delta | 18.2 | 6.8 | 1.1 | 11.0 | 1.8 | 5.4 | 3.4 | 7.8 | 3.9 |
| Significant? | Yes | No | No | Marginal | No | No | No | No | No |
The cross-supply chain balance that we had been waiting on for over a year finally came in February and has stayed through March. March’s analysis shows only one significant difference between Downstream (orange bars) and Upstream (blue bars) respondents. Downstream firms reported significantly higher rates of expansion in Transportation Utilization (64.5 to 53.6). In general, Downstream firms reported more transportation activity (prices were higher by 58.3 to 50.7), but only the difference in utilization was statistically significant. Unlike February when Upstream reported significantly higher changes in Inventory Levels, both groups are reporting robust inventory growth (64.1 Upstream and 63.3 Downstream in March). This is somewhat consistent with the messaging we had been getting Upstream that they would be significantly rebuilding inventories in early 2024; but is also a mild departure from the Downstream predictions of JIT inventories, with 63.3 representing fairly robust expansion. This shift Downstream may be a short aberration or represent a course correction as consumer spending has remained higher than expected. We will learn more about this by observing Downstream inventory movements through Q2.
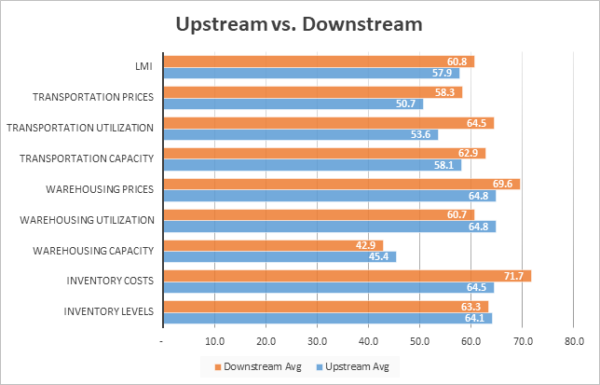
| Inv. Lev. | Inv. Costs | WH Cap. | WH Util. | WH Price | Trans Cap | Trans Util. | Trans Price | LMI | |||||||||||
| Upstream | 64.1 | 64.5 | 45.4 | 64.8 | 64.8 | 58.1 | 53.6 | 50.7 | 57.9 | ||||||||||
| Downstream | 63.3 | 71.7 | 42.9 | 60.7 | 69.6 | 62.9 | 64.5 | 58.3 | 60.8 | ||||||||||
| Delta | 0.7 | 7.2 | 2.5 | 4.1 | 4.8 | 4.8 | 10.9 | 7.6 | 2.9 | ||||||||||
| Significant? | No | No | No | No | No | No | Yes | No | No |
Similar to February, responses this month varied from early (gold bars) to late (green bars) March, largely suggesting that the first half of the month was busier than the second. These differences largely stem from the difference in the buildup of Inventory Levels from early (74.4) to late (55.7) March. The bump in the first half of the month might be reflective of a post-Chinese New Year Replenishment. Whatever the cause was, the slower buildup of inventories in the second half of the month led to Warehousing Capacity moving from contraction (36.6) to very mild expansion (51.0). The decline in inventories and freeing up of capacity may also have been partially due to inventory moving throughout supply chains, as all three logistics metrics were busier in late March. The increase in activity is most pronounced in Transportation Capacity, which was down (-8.9) from 64.4 to 55.6 in the second half of March. Supply chains are at their most efficient when goods are coming through in a swift even flow. With Chinese New Year in the review mirror, it will be interesting to see if we return to a more consistent flow.
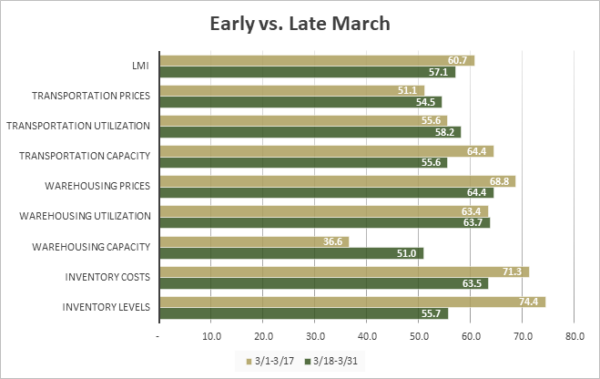
| Inv. Lev. | Inv. Costs | WH Cap. | WH Util. | WH Price | Trans Cap | Trans Util. | Trans Price | LMI | |||||||||||
| 3/1-3/17 | 74.4% | 71.3% | 36.6% | 63.4% | 68.8% | 64.4% | 55.6% | 51.1% | 60.7% | ||||||||||
| 3/18-3/31 | 55.7% | 63.5% | 51.0% | 63.7% | 64.4% | 55.6% | 58.2% | 54.5% | 57.1% | ||||||||||


