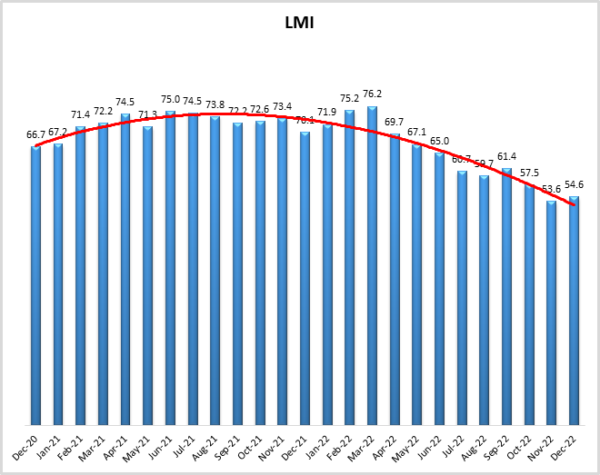
- LMI® at 54.6
- Growth is INCREASING AT AN INCREASING RATE for Inventory Levels and Warehousing Utilization
- Growth is INCREASING AT A DECREASING RATE for Inventory Costs, Warehousing Prices, and Transportation Capacity.
- Warehousing Capacity, Transportation Utilization, and Transportation Prices are CONTRACTING.
The Logistics Managers’ Index reads at 54.6 in December, up (+1.0) from November’s reading of 53.6. The overall index had declined in seven of the eight months leading up to December’s reading, so even the modest increase we see here is a marked change.
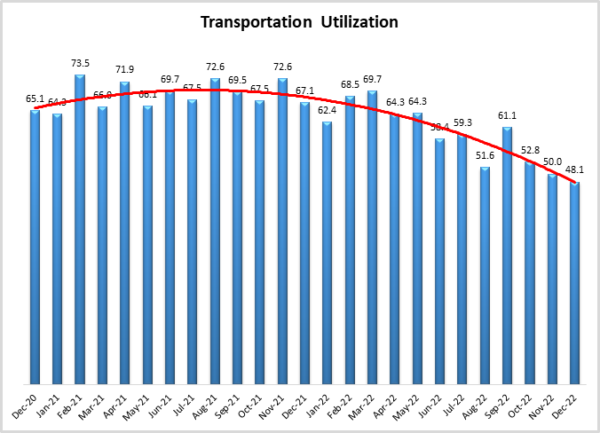
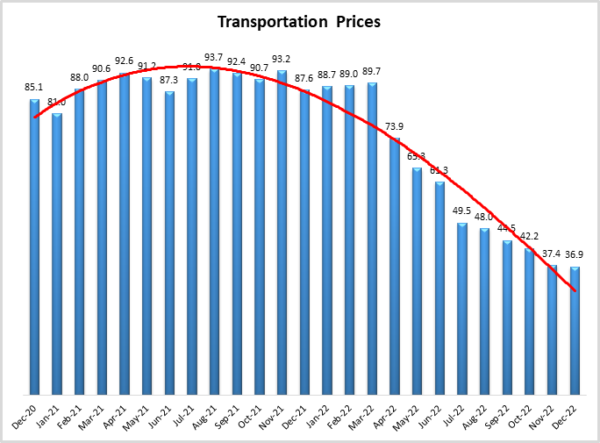
Like November, Inventory Levels (57.3) are increasing at a much slower rate than was observed throughout most of 2022. Inventory Levels were much higher for Downstream than for Upstream firms (62.8 to 53.3 respectively), which is indicative of the split we observed in December. Essentially, Downstream respondents such as retailers held higher levels of inventory and dealt with more limited warehousing as they pushed to get goods to consumers for holiday shopping. Transportation metrics were weak across all levels of the supply chain. Transportation Utilization was down to 48.1, marking the first time it has dipped into contraction territory since April of 2020. Transportation Prices contracted at a rate of 36.9, which is the sharpest rate of contraction we have measured for this metric in the over six years of the Logistics Managers’ Index.
Researchers at Arizona State University, Colorado State University, Florida Atlantic University, Rutgers University, and the University of Nevada, Reno, in conjunction with the Council of Supply Chain Management Professionals (CSCMP) issued this report today.
Results Overview
The LMI score is a combination of eight unique components that make up the logistics industry, including inventory levels and costs, warehousing capacity, utilization, and prices, and transportation capacity, utilization, and prices. The LMI is calculated using a diffusion index, in which any reading above 50.0 indicates that logistics is expanding; a reading below 50.0 is indicative of a shrinking logistics industry. The latest results of the LMI summarize the responses of supply chain professionals collected in December 2022. Transportation metrics continue to be a drag on the logistics industry, while warehousing remains strong, inventories are still expensive, but the pace of growth for Inventory Levels has slowed significantly relative to what we had seen through most of 2022.
As always, December’s economic activity revolves around holiday shopping and the steps firms take to prepare for it. According to Mastercard, consumer spending was up 7.6% for the holiday season (spanning from November 1st – December 24th) year-over-year. E-commerce was up 10.6% year-over-year as consumer spending increased on items like apparel, department stores, and services such as dining, but declined for electronics and jewelry[1]. This may have caught some by surprise as personal spending increased by 0.1% in November, down from the 0.9% increase observed in October, leading some to believe that retail spending would be depressed. However, consumer expectations for continued inflation have declined to their lowest level since June 2021, driving up consumer sentiment in December and partially explaining the willingness to spend for the holidays[2]. Consumers were also enticed to spend due to aggressive sales by retailers, with some large chains like Lands’ End and Tommy Hilfiger cutting prices by 50-70% in the week leading up to Christmas. Analysts believe that due to a combination of inflationary pressures and the consumer assumption that goods were less likely to run out than in 2020 and 2021 that shoppers were more willing to wait until the last minute to buy gifts, this is reflected in (note: the person writing this did most of their shopping on Christmas Eve), leading nervous retailers to cut prices leading up to the holiday[3]. Inventory Level growth was up slightly from November (+2.4), but its reading of 57.3 is still down significantly from the rates of growth in the 80s and 70’s we observed earlier in the year. Despite the sizable reductions in inventories, it does not appear that many retailers are aggressively pursuing a sizable restocking of goods. The level of containers coming through the Southern California ports was 566,522 loaded TEUs in November, the lowest level recorded since March 2020[4]. Container rates from the East Coast of China to the West Coast of North America are now at the same level they were at in late 2019, coming full circle from the wild ride they had during COVID. Rates to the East coast are still up slightly but have come down from the highs they reached earlier this year[5]. This low volume is partially due to the still-high rate of growth in Inventory Costs (-0.6) which read in at 72.8 in December.
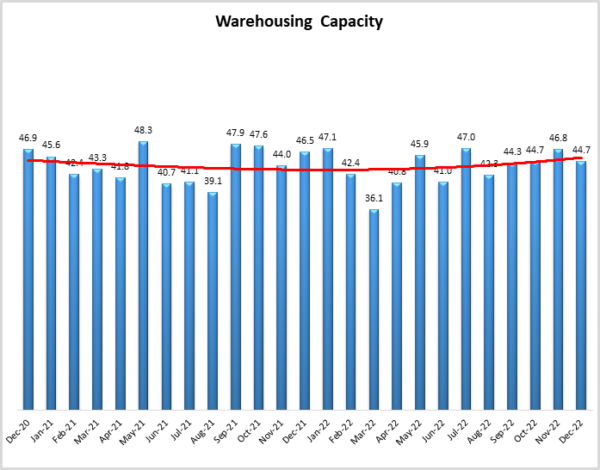
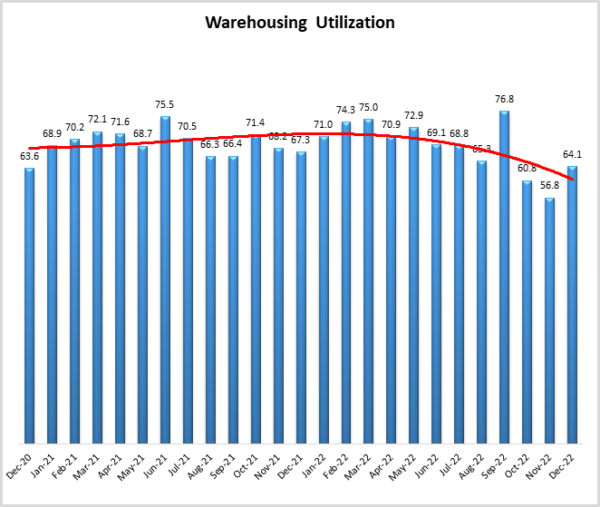
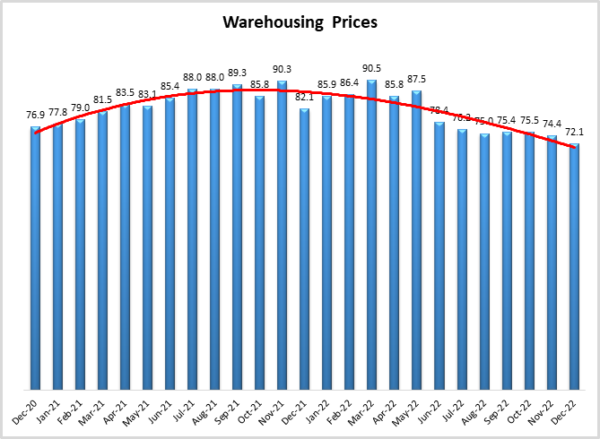
Other factors behind slow imports are depressed demand, shutdowns in China (Tesla shut down production at its Shanghai facility during the last week of December due to a high number of positive COVID cases at the plant)[6], and the continued diversion of inbound inventory through alternative ports. It would appear that firms will continue to pursue a diversified routing strategy as many firms are planning to invest more in distribution centers in places like Pennsylvania and North Carolina as they reorient their distribution networks towards East Coast ports[7]. Much of this new capacity will be near the ports themselves. CBRE is projecting warehousing space around seaports to be in particularly high demand in 2023[8]. Container line CMA CGM, the world’s third-largest carrier by capacity, is investing in cargo terminals on both the West and East Coast of the U.S. to increase its reach into inland logistics and avoid a situation like 2021, in which the carrier and its customers were at the mercy of infrastructure partners[9]. This expansion is in response to the continued lack of Warehousing Capacity (-2.1) which read in at 44.7 in December, marking 29 consecutive months of contraction. In addition to more investment in port storage, there continues to be consistent investment around the more expensive facilities used for last-mile delivery. Given the tightness in available Warehousing Capacity, an increased number of retailers utilized brick-and-mortar stores as fulfillment centers during the holidays[10]. This high demand led Warehousing Utilization to increase significantly (+7.3) to 64.1 in December. Going forward Quiet Platforms, which sells logistics and fulfillment services specifically to retailers is expanding its network in 2023 to small-footprint facilities in large metros in an attempt to provide next- and same-day delivery options to smaller and mid-size retailers[11]. Overall, CBRE predicts that 1.7 to 2.2 billion square feet of additional space dedicated specifically to eCommerce will come online by 20268. The bottom line is that Warehousing Prices remain elevated (-2.3) at a rate of 72.1. This is down from the highs observed in 2021 and early on in 2022, but it is still above 70.0 and is expanding at a level that we would consider to be significant. Prices will remain high (and are expected to in our future predictions) until adequate capacity comes online – specifically in areas near ports and near consumers where it has been desperately needed.
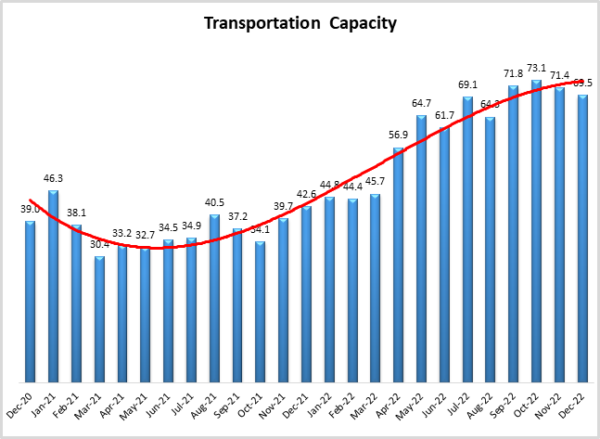
With warehouses largely full of products before the start of the holiday season, less transportation than usual was needed to push goods forward at the last minute. Transportation Capacity continues to grow quickly (-1.9) at a rate of 69.5 – just short of significant expansion – in December. This is still a significant rate of growth but 69.5 does mark a second consecutive month of slowing expansion. The glut of available capacity has driven the tender rejection index down to 4%, a significant drop from the 20-25% rejection rates observed during the height of COVID-19. With carriers able to cover the majority of volume through previously contracted capacity spot market prices continue to stay low[12]. Low levels of demand have driven Transportation Utilization (down 1.9 points and reading in at 48.1) into contraction territory for the first time since April 2020 at the height of COVID lockdowns.
The impact of all of this is that Transportation Price contraction has accelerated to 36.9, marking the second consecutive month that this metric has hit an all-time low. While much of this contraction is due to waning demand, lower costs have played a role as well. U.S. diesel fuel prices were down to $4.537 per gallon in the last week of December. This is the lowest price since February 28th – four days after the start of the Russian invasion of Ukraine that sent fuel prices hurtling upward. This latest reading is down $1.27/gallon from the apex reached in late June, but still up $0.92/gallon from this time last year[13]. Diesel markets have not fully recovered from the shock of last February, but prices have come down as demand continues to wane. The 21-cent drop in diesel the week of December 12th was the second largest ever, second only to the drop seen in October 2008 during the Great Recession[14]. Interestingly, futures markets for diesel are up slightly at the end of December. There could be several factors behind this shift, but chief among them is the loss of refining capacity in Houston due to the recent cold snap in the U.S.[15]. It should be noted though that despite the significant dip in spot rate prices, the contraction among carriers has been fairly mild relative to the freight recession of 2019[16]. This could change at some point as used truck prices were down year-over-year in November for the first time since 2020, causing owner-operators who bought in at high prices to go underwater on their vehicles[17]. This could potentially lead to a tightening of available capacity, which might in turn allow prices to come back up and rebalance the market back toward equilibrium.
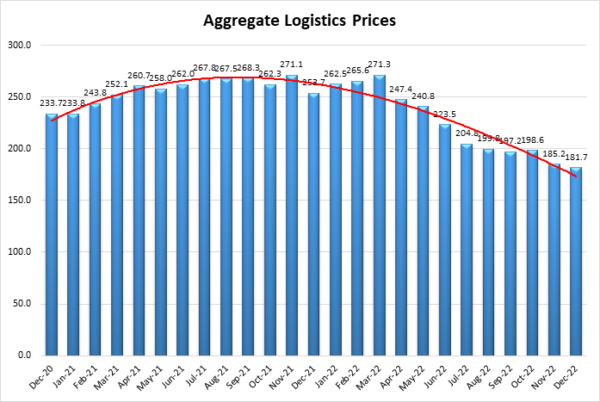
The three cost/price metrics (Inventory Costs, Warehousing Prices, and Transportation Prices) are aggregated in the chart below. When reading this chart, anything over 150 is the expansion, and under 150 is contraction, the range of potential scores is 0-300. December’s reading of 181.7 is down 72.0 points from this time last year, and 89.6 points (or 33%) is down from the all-time high observed in March 2022. Much of the recent slowdown in inflation can be traced back to the reduction in logistics costs. While the Federal Reserve may get the lion’s share of the headlines for battling inflation, it could very reasonably be argued that it is in fact the efforts of supply chain professionals who have led the charge to tamp down inflation through the last nine months of 2022.
The conditions in the logistics industry shifted as the month went on. Available Warehousing Capacity decreased, Warehousing Utilization was up significantly in the latter half of December as downstream retailers strained to position goods as close as possible to consumers shopping at the end of the holiday season. Interestingly, Transportation Utilization went down, but Transportation Price contraction slowed down significantly. As we will see below, the dip in utilization was likely due to Upstream firms having nothing to ship while Downstream firms continued to utilize more expensive last-mile delivery services. The overall LMI was also up in the second half of the month. In the first half of December, it had dipped down to 50.7, which is very near no growth and would have been the lowest number ever recorded for the overall index. Whether the logistics industry will slow back down to the levels seen in early December or continue to grow in the same way it did later in the month remains to be seen. The future predictions below suggest the LMI will grow at a rate of 53.2 in 2023, splitting the difference between what we observed in early and late December.
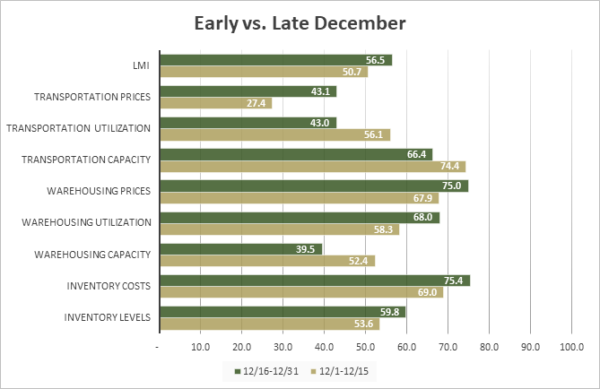
| Inv. Lev. | Inv. Costs | WH Cap. | WH Util. | WH Price | Trans Cap | Trans Util. | Trans Price | LMI | |
| December 1-15 | 53.6 | 69.0 | 52.4 | 58.3 | 67.9 | 74.4 | 56.1 | 27.4 | 50.7 |
| December 16-31 | 59.8 | 75.4 | 39.5 | 68.0 | 75.0 | 66.4 | 43.0 | 43.1 | 56.5 |
| Delta | 6.3 | 6.4 | 12.9 | 9.7 | 7.1 | 8.0 | 13.1 | 15.7 | 5.8 |
| Significant? | No | No | Yes | Marginal | No | No | Yes | Yes | Yes |
The index scores for each of the eight components of the Logistics Managers’ Index, as well as the overall index score, are presented in the table below. Transportation Utilization is now contracting, meaning that five of the eight metrics show signs of growth. Warehousing Capacity has now tightened for 29 consecutive months. Transportation Prices are down for the sixth consecutive month, contracting at their sharpest rate ever in December.
|
LOGISTICS AT A GLANCE |
|||||
| Index | December 2022 Index | November 2022 Index | Month-Over-Month Change | Projected Direction | Rate of Change |
| LMI® | 54.6 | 53.6 | +1.1 | Growing | Faster |
| Inventory Levels | 57.3 | 54.8 | +2.4 | Growing | Faster |
| Inventory Costs | 72.8 | 73.4 | -0.6 | Growing | Slower |
| Warehousing Capacity | 44.7 | 46.8 | -2.1 | Contracting | Faster |
| Warehousing Utilization | 64.1 | 56.8 | +7.3 | Growing | Faster |
| Warehousing Prices | 72.1 | 74.4 | -2.3 | Growing | Slower |
| Transportation Capacity | 69.5 | 71.4 | -1.9 | Growing | Slower |
| Transportation Utilization | 48.1 | 50.0 | -1.9 | Contracting | From Growing |
| Transportation Prices | 36.9 | 37.4 | -0.5 | Contracting | Faster |
This month, Downstream firms (orange bars) reported significantly greater rates of positive change for Transportation Utilization, and in the overall LMI, they also reported significantly greater rates of contraction in Warehousing Capacity as they struggled to deal with higher (though non-significant) Inventory Level expansion. This split explains much of the mixed economic news discussed above. Consumers have been willing to spend during December, meaning that retailers had to have greater levels of inventory, which required more warehousing space. It is also likely that due to the record level of eCommerce, this holiday season downstream firms were utilizing a greater degree of the available last-mile delivery capacity. However, because inventories were already high, less transportation was needed higher up the supply chain.
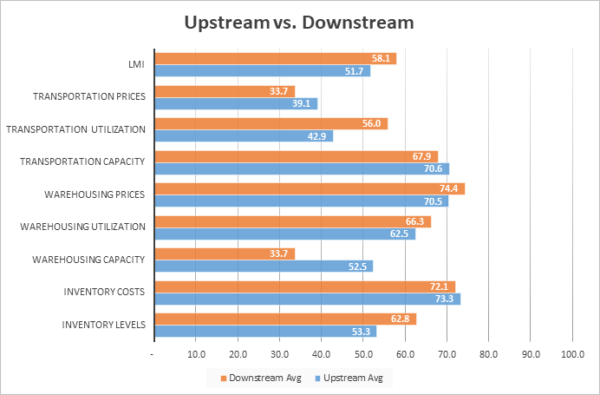
| Inv. Lev. | Inv. Costs | WH Cap. | WH Util. | WH Price | Trans Cap | Trans Util. | Trans Price | LMI | |
| Upstream | 53.3% | 73.3% | 52.5% | 62.5% | 70.5% | 70.6% | 42.9% | 39.1% | 51.7% |
| Downstream | 62.8% | 72.1% | 33.7% | 66.3% | 74.4% | 67.9% | 56.0% | 33.7% | 58.1% |
| Delta | 9.5% | 1.2% | 18.7% | 3.8% | 3.9% | 2.8% | 13.1% | 5.3% | 6.4% |
| Significant? | No | No | Yes | No | No | No | Yes | No | Yes |
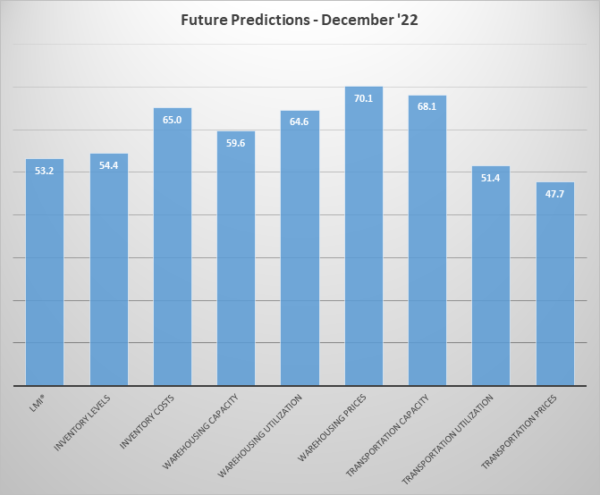
Respondents were asked to predict movement in the overall LMI and individual metrics 12 months from now. Their predictions for future ratings are presented below. December’s and November’s future predictions suggest a “return to normal” for logistics in 2023. The overall growth expectation of 53.2 is up (+1.7) from November’s future prediction of 51.5. Taking out Warehousing Prices (70.1) which tend to lag the other metrics and change more slowly due to contract length, the predictions for metrics range from mild contraction (47.7 for Transportation Prices) to moderately high growth (68.1 for Transportation Capacity). We classify readings in the 40s, 50s, or 60s as “normal” rates of change. This suggests that after the wild swings seen from 2020-2022, the logistics industry may be moving back towards a bit more predictability – a change that would be welcome by firms at almost every level of the supply chain.
The exact nature of the future predictions varies by supply chain position[18]. In December we observe a marginally significant difference in the expectation of both Transportation Utilization and the overall LMI, and a significant difference in expectations for Warehousing Utilization growth over the next 12 months. Also, while they are not statistically significant, notable differences also exist in expectations for Inventory Levels and Transportation Prices. In all cases, the Downstream firms anticipate greater rates of expansion in 2023. This is likely reflective of expectations of continued strength on the consumer side, but some hesitation upstream in manufacturing and industrials. A similar economic bifurcation existed from 2018-2019, it will be interesting to observe if 2023 follows in those footsteps.
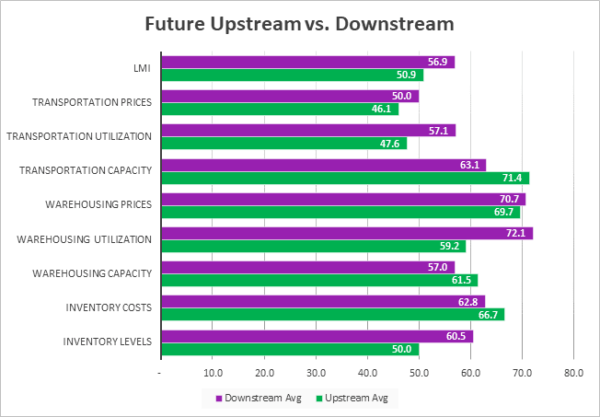
| Futures | Inv. Lev. | Inv. Costs | WH Cap. | WH Util. | WH Price | Trans Cap. | Trans Util. | Trans Price | LMI |
| Upstream | 50.0 | 66.7 | 61.5 | 59.2 | 69.7 | 71.4 | 47.6 | 46.1 | 50.9 |
| Downstream | 60.5 | 62.8 | 57.0 | 72.1 | 70.7 | 63.1 | 57.1 | 50.0 | 56.9 |
| Delta | 10.5 | 3.9 | 4.5 | 12.9 | 1.1 | 8.3 | 9.5 | 3.9 | 6.1 |
| Significant? | No | No | No | Yes | No | No | Marginal | No | Marginal |
Historic Logistics Managers’ Index Scores
This period along with prior readings from the last two years of the LMI is presented table below:
| Month | LMI | Average for last 3 readings – 55.2
All-time Average – 64.6 High – 76.2 Low – 51.3 Std. Dev – 7.1
|
| Dec ‘22 | 54.6 | |
| Nov ‘22 | 53.6 | |
| Oct ‘22 | 57.5 | |
| Sep ‘22 | 61.4 | |
| Aug ‘22 | 59.7 | |
| July ‘22 | 60.7 | |
| June ‘22 | 65.0 | |
| May ‘22 | 67.1 | |
| Apr ‘22 | 69.7 | |
| Mar ‘22 | 76.2 | |
| Feb ‘22 | 75.2 | |
| Jan ‘22 | 71.9 | |
| Dec ‘21 | 70.1 | |
| Nov ‘21 | 73.4 | |
| Oct ‘21 | 72.6 | |
| Sep ‘21 | 72.2 | |
| Aug ‘21 | 73.8 | |
| July ‘21 | 74.5 | |
| June ‘21 | 75.0 | |
| May ‘21 | 71.3 | |
| Apr ‘21 | 74.5 | |
| Mar ‘21 | 72.2 | |
| Feb ‘21 | 71.4 | |
| Jan ‘21 | 67.2 | |
| Dec ‘20 | 66.7 |
LMI®
November’s overall Logistics Manager’s Index reads in at 54.6, up (+1.0) from November’s reading of 53.6. This is the sixth consecutive month that the overall index has read below its all-time average of 64.6. In a continuation of what we have seen all year, the uptick in growth comes from increases in Inventory Levels and an associated bump in Warehousing Utilization, along with continued tightness in Warehousing Capacity. On the flip side, all of the transportation metrics are down (with Transportation Prices contracting at their sharpest rate ever). It will be interesting to observe if these same dynamics continue through the new year, or if they change as firms work their way through their remaining excess inventory. The LMI currently sits at a modest rate of growth, it remains to be seen if this is indicative of a “new normal”, or merely represents a holiday-fueled respite in an eventual slide into contraction.
Respondents seem to expect a moderate rate of expansion over the next 12 months, predicting a growth rate of 53.2, up (+1.8) from November’s future prediction of 51.5. These future predictions reflect expected strength in warehousing, and continued softness in transportation.
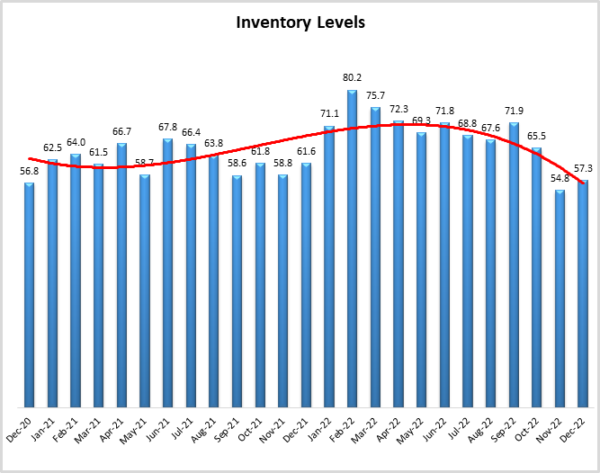
Inventory Levels
The Inventory Level value is 57.3, up (+2.5) from November’s reading of 54.8. The current value is 4.3 points lower than the same time last year and down 22.9 from the index’s all-time highest value in February of this year. For the second month in a row, and only the second time in 2022, the current reading is below the all-time average value for this metric of 62.6. Much of this growth is driven by retailers. This month, Downstream respondents reported greater inventory growth than their Upstream counterparts by 9.5 pts, (62.8 vs 53.3).
When asked to predict what conditions will be like 12 months from now, the average value is 54.4, up considerably from last months’ value (47.2). Downstream respondents returned a higher average (62.8 vs 53.3). Respondents’ expectations about future Inventory Levels are likely affected by their expectations about the economy, so it seems likely that the prediction of higher inventory levels reflects changing expectations about the economy for the next year.
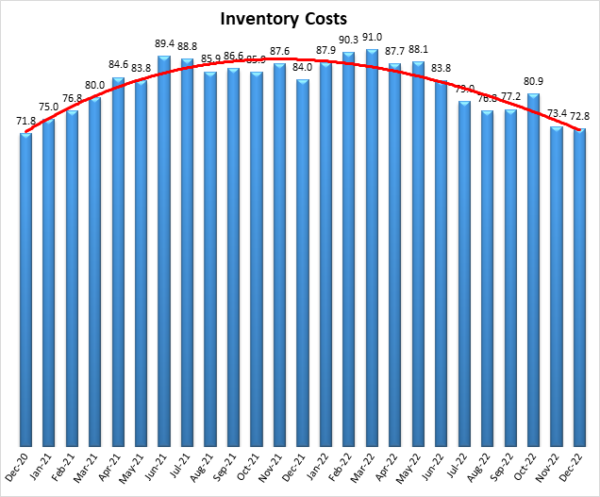
Inventory Costs
The current Inventory Costs index value represents a decrease, continuing the downward trend. The value of 72.8 is down (-0.6) from November’s reading of 73.4. This is still a significant rate of growth, but it is slower growth than we have seen in any month in 2022 and is down 11.2 points from this time last year. Unlike the differences observed in Inventory Levels, costs seem to be distributed throughout the supply chain, with no significant difference between what was reported by Upstream or Downstream respondents (73.3 to 72.1 respectively). It is interesting that Inventory Costs continue to grow at such substantial rates even as Inventory Level growth slows. This likely reflects the high cost of warehousing (which we will discuss below) as well as the type of inventories (i.e., electronics, construction materials) that are currently “stuck” due to experiencing lower demand than what we saw over the past few years.
Consistent with this, respondents predict that Inventory Costs will continue growing significantly as a rate of 65.0, down slightly (-3.4) from November’s future prediction of 68.4.
Warehousing Capacity
The November 2022 Warehousing Capacity registered in at 44.7, down (-2.1) from November’s reading of 46.8 and identical to what was reported in October. It is not surprising that Warehousing Capacity contracted quickly in December as firms made final preparations for the holiday season. The impact of retailers on this number is clear as the split between Upstream (52.5) and Downstream (33.7) was rather dramatic. This 18.7-point difference is one of the largest deltas we have observed. This is the 29th consecutive month of contraction for Warehousing Capacity, but the 52.5 reading Upstream indicates that space is actually loosening up at some levels of the supply chain, which we have not seen in some time.
Looking forward at the next 12 months, respondents continue to expect available Warehousing Capacity to grow at a rate of 59.6. This is up (+5.6) from November’s future prediction of 54.0, suggesting some optimism that as inventories continue to normalize, the supply and demand mismatch with relation to capacity will begin to dissipate.
Warehousing Utilization
The Warehousing Utilization Index registered in at 64.1, up (+8.7) from November’s reading of 56.8. This is also down 11.4 points from the reading one year ago, and down by over 14 points from two years ago. Unlike what we observed for capacity, the split between Upstream (62.5) and Downstream (66.3) suggests that across-the-board utilization continues to tighten. It will be interesting to examine how to use [DR1] [DR2] dynamic shift post-holiday season, particularly given the increased volume of consumer returns that tends to happen.
Looking forward at the next 12 months, the predicted Warehousing Utilization index is 64.6, up significantly (+9.8) from November’s future prediction of 54.8 and back in line with expectations from October. This suggests firms will be waiting to snap up whatever additional capacity does come online fairly quickly in 2023.
Warehousing Prices
Warehousing Prices Index registered 72.1, down (-2.3) from November’s reading of 74.4, and 10.0 points lower than the metric at this time last year. Warehousing Prices have been one of the fastest growth metrics all year and is likely to continue moving in that direction due to the lag that is often built into this metric due to long-term contracts. Similar to Warehousing Utilization, the split between Upstream (70.5) and Downstream (74.4) was not significant for Warehousing Price growth, although Downstream respondents were unsurprisingly a bit higher due to the expensive facilities utilized for last-mile delivery.
Future predictions suggest that respondents are expecting prices to continue to grow at a rate of 70.1, up (+2.6) from November’s future prediction of 67.5. Although respondents are optimistic that the ongoing capacity crunch will ease in 2023, they still expect the cost of storage to grow at a significant rate.
Transportation Capacity
The Transportation Capacity Index registered 69.5 in December 2022. This constitutes a decrease (-1.9) from the November reading of 71.4. With this decrease, the Transportation Capacity Index continued its retreat from the 2-year high registered in October but remained historically elevated. The Downstream Transportation Capacity index is slightly lower, indicating 67.9 while the upstream index indicates 70.6. There continues to be a substantial mismatch between supply and demand, with the advantage currently tilting toward demand – providing opportunities for low costs for shippers.
The future Transportation Capacity Index continues to indicate expansion, registering 68.1, which is 2.4 points higher than November’s future prediction of 65.7. Upstream firms indicate a future Transportation Capacity index of 71.4 while Downstream firms indicate a future expectation of 63.1. As such, it can be concluded that the expectations of continued Transportation Capacity expansion are diffused across the supply chains with Upstream firms expecting greater increases than Downstream firms.
Transportation Utilization
The Transportation Utilization Index registered 48.1 in December 2022. This denotes a retreat (-1.9) from November’s reading of 50.0 which had indicated no movement. With this drop, the metric is now below the critical level of 50 that separates expansion and contraction. This is the first reading of contraction for this metric since April 2020. Later submissions were even more negative, suggesting that the contraction trend may be accelerating. The downstream Transportation Utilization Index is at 56.0, indicating expansion, while the upstream index is significantly lower at 42.9, indicating contraction. As such, our data indicates that during the holiday season, the customer-facing Downstream supply chain transportation was expanding while the Upstream transportation was contracting.
The future Transportation Utilization Index decreased slightly (.2 points) from the previous reading and indicates a 51.4 level for the next 12 months. The expectations of future growth are greater for Downstream firms where the future Transportation Utilization index is indicating expansion with a score of 57.1, while the Upstream firms are registering 47.6, indicating slight contraction.
Transportation Prices
The Transportation Prices Index read 36.9 in December 2022. This corresponds to a small drop of (-0.5) percent from November’s reading of 37.4. With this drop, the Transportation Prices Index pushes further down into contraction territory and records its second consecutive all-time low in the history of the index. The price index drop remains stronger for Downstream supply chain firms, with the Upstream price index at 39.1 and the Downstream transportation price index at only 33.7. However, the reported price drops were more pronounced at the beginning of the month than towards the end of the month, suggesting that perhaps price decrease pressures are easing somewhat going into the new year.
The future index for Transportation Prices continues to remain below the critical 50 levels, registering 47.7 but this is 5.6 points higher than the previous reading. This seems to be driven primarily by the expectation of continued consumer demand as the future Downstream Transportation Price Index is 50.0 while the Upstream Future Transportation Price Index is 46.1.
About This Report
The data presented herein are obtained from a survey of logistics supply executives based on information they have collected within their respective organizations. LMI® makes no representation, other than that stated within this release, regarding the individual company data collection procedures. The data should be compared to all other economic data sources when used in decision-making.
Data and Method of Presentation
Data for the Logistics Manager’s Index is collected in a monthly survey of leading logistics professionals. The respondents are CSCMP members working at the director level or above. Upper-level managers are preferable as they are more likely to have macro-level information on trends in Inventory, Warehousing and Transportation trends within their firm. Data is collected from subscribers to both DC Velocity and Supply Chain Quarterly as well. Respondents hail from firms working on all six continents, with the majority of them working at firms with annual revenues over a billion dollars. The industries represented in this respondent pool include, but are not limited to: Apparel, Automotive, Consumer Goods, Electronics, Food & Drug, Home Furnishings, Logistics, Shipping & Transportation, and Warehousing.
Respondents are asked to identify the monthly change across each of the eight metrics collected in this survey (Inventory Levels, Inventory Costs, Warehousing Capacity, Warehousing Utilization, Warehousing Prices, Transportation Capacity, Transportation Utilization, and Transportation Prices). In addition, they also forecast future trends for each metric ranging over the next 12 months. The raw data is then analyzed using a diffusion index. Diffusion Indexes measure how widely something is diffused or spread across a group. The Bureau of Labor Statistics has been using a diffusion index for the Current Employment Statistics program since 1974, and the Institute for Supply Management (ISM) has been using a diffusion index to compute the Purchasing Managers Index since 1948. The ISM Index of New Orders is considered a Leading Economic Indicator.
We compute the Diffusion Index as follows:
PD = Percentage of respondents saying the category is Declining,
PU = Percentage of respondents saying the category is Unchanged,
PI = Percentage of respondents saying the category is Increasing,
Diffusion Index = 0.0 * PD + 0.5 * PU + 1.0 * PI
For example, if 25 says the category is declining, 38 says it is unchanged, and 37 says it is increasing, we would calculate an index value of 0.0*0.25 + 0.5*0.38 + 1.0*0.37 = 0 + 0.19 + 0.37 = 0.56, and the index is increasing overall. An index value above 0.5 indicates the category is increasing, a value below 0.5 indicates it is decreasing, and a value of 0.5 means the category is unchanged. When a full year’s worth of data has been collected, adjustments will be made for seasonal factors as well.


