Growth is INCREASING AT AN INCREASING RATE for: Inventory Costs, Warehousing Capacity, and Transportation Capacity.
Growth is INCREASING AT A DECREASING RATE for: Inventory Levels, Warehousing Utilization, Warehousing Prices, and Transportation Utilization.
Transportation Prices are CONTRACTING.
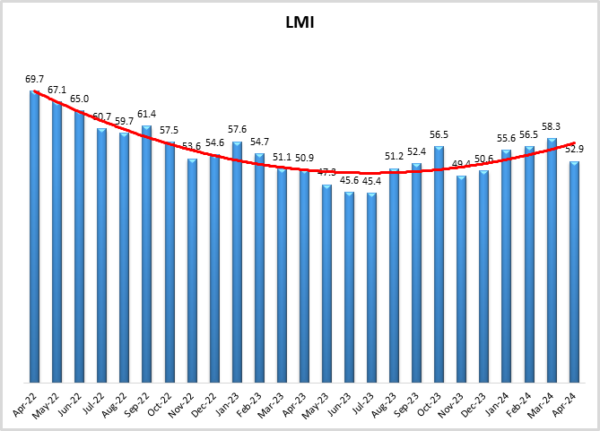
The Logistics Manager’s Index reads in at 52.9 in April 2024. This is down (-5.4) from March’s reading of 58.3, which was the highest rate of growth in 18 months. While this still indicates growth in the logistics industry, this breaks what had been four consecutive months of increasing rates of expansion and is the slowest rate of growth observed so far in 2024. The slowed pace of growth is driven by a significant decrease in the expansion of Inventory Levels (down 12.8-points to 51.0 which is the most marginal level of expansion). This has cascading effects across the supply chain, as lower levels of inventory led to a loosening of both Warehousing (+9.4) and Transportation (+1.8) Capacity, slower expansion for Warehousing Utilization (-8.5), and most importantly, Transportation Prices moving back into contraction at a rate of 44.1. There had been signs that the transportation market was moving back towards equilibrium. However, with the movements in our transportation metrics, Transportation Capacity is now 17.3-points higher than Transportation Prices (61.4 to 44.1) indicating that we are still firmly in a state of freight recession.
There is some nuance to these movements however, as we saw that transportation, and the logistics industry overall were much stronger in the second half of the month. Transportation Prices jumped 27.3-points (back into expansion at 54.8) and Transportation Capacity dropped by 10.1-points (down to 57.4) in the back half of April. This may be reflective of seasonal restocking of summer items, or increased hopes that interest rates could come down in late summer after reading the tea leaves of the most recent Federal Reserve meeting. Whatever the cause, it is clear that the logistics industry was much stronger in the second half of April. It will be interesting to see if that trend continues into May, or if there were other forces at work causing some type of aberration. On that front, it should be noted that the second half of April is much more consistent with recent trends than the sharp contraction we observed in the first half of the month.
Researchers at Arizona State University, Colorado State University, Florida Atlantic University, Rutgers University, and the University of Nevada, Reno, and in conjunction with the Council of Supply Chain Management Professionals (CSCMP) issued this report today.
Results Overview
The LMI score is a combination of eight unique components that make up the logistics industry, including: inventory levels and costs, warehousing capacity, utilization, and prices, and transportation capacity, utilization, and prices. The LMI is calculated using a diffusion index, in which any reading above 50.0 indicates that logistics is expanding; a reading below 50.0 is indicative of a shrinking logistics industry. The latest results of the LMI summarize the responses of supply chain professionals collected in April 2024.
The LMI read in at 52.9 in April, down (-5.4) from April’s reading of 58.3. While this is lower than what we had seen in any of the readings in Q1, this is still indicative of expansion and is the eighth time in the past nine months that we have recorded growth in the overall index. As mentioned above, this dip was largely a function of the pullback we saw from late March to mid-April when the overall index actually contracted. However, there was a recovery from this in late April when the index was significantly higher than earlier in the month (moving from contraction at 46.8 to growth at 56.5). Whether the rest of Q2 looks more like that fallow period, or like the robust growth we saw later in the month will have a significant impact on the direction of the economy as we head into summer. The motif of optimism that is still high, if not slightly dimmed, is reflected in the University of Michigan’s Consumer Sentiment Index. Consumer sentiment was down slightly from March but remained high overall at 77.2 – which is up 17.5 points from a year ago. Consumers have been consistently optimistic on the economy throughout 2024, with all four readings from this year falling within a range of 2.5 points[1].
Likely the most important piece of economic information from April was the job report that was released last Friday. This so-called “Goldilocks” report states that 175,000 jobs were added in the U.S. in April. This is down from the 300,000 that were added in March (and the 240,000 that were predicted). Of the 175,000 jobs added in April, 22,000 were in the transportation and warehousing sector, reflecting the moderate rates of continued growth in the logistics industry. This slowdown is at least partially due to high employment participation, the 8.5 million unfilled job openings that employers reported on the last day of March is the fewest since early 2021[2]. It also suggests that the economy is growing at a more sustainable rate, and the stock market was up as traders are hoping this signal will allow the Fed to lower rates sometime in Q3[3]. When rates do eventually come down it is unlikely that they will be to the levels around 2.5% that had been common since the recession of 2008. The ongoing investment into green energy and AI has led many analysts to predict that the engines of growth in the economy mean that the Fed will set the current “neutral rate” (also known as r*), somewhere in the 3%-4% range[4]. So, while it is reasonable to expect rates to come down in 2024, it is unlikely that they will come down to their pre-covid levels.
While there are some issues, the underlying strength of the U.S. economy contrasts with much of the rest of the world. According to the International Monetary Fund, the U.S. economy will account for 26.3% of GDP in 2024, which is the highest level in almost 20 years. By contrast, Europe’s share is down 1.4% and Japan’s is down 2.1%. China is up as well, but less so than the U.S[5]. S&P Global also shows that manufacturing in Southeast Asia is up in some countries (Taiwan, Indonesia), but remains stunted in others (Thailand) – leading to a PMI of 50.0, or no movement, for the region[6]. This has led to a very strong dollar, which has made goods cheaper for consumers. If the dollar continues to be strong (and does not lead to protectionist policies from other countries), the flood of cheap imports could provide a boost to the freight market. Conversely, Canadian imports to the U.S. were down 5% in April. This is partially due to a drop in autos and automotive components, which have likely slowed due to continually high interest rates[7]. This could be exacerbated by a potential teamsters strike at Canadian National Railway and Canadian Pacific Kansas City. The negotiations are centered around safety provisions and hours. If a strike happens it would disrupt Canada’s two biggest rail carriers which are responsible for moving approximately 300 million metric tons of cargo per year[8].
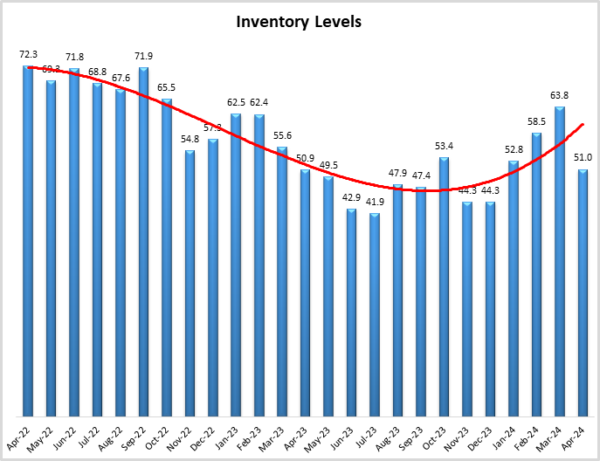
After reaching their highest reading in 18 months in March, Inventory Levels dropped (-12.8) back down to 51.0, which indicates only very slight expansion. Inventories actually contracted at a rate of 47.4 early in the month and then shifted back to (still very slight) growth at 53.4 in late April. There are two potential explanations for this dynamism. The first is that in early March Inventory Levels built up very quickly at a rate of 74.4. This dramatic buildup may have been partly due to grouping together cargos to avoid Chinese New Year, trying to get ahead of interest rates dropping, or a combination of the two. The dramatic move into contraction may merely have been an “equal and opposite reaction” to the expansion a month before. The second potential factor is the realization that the Fed would not be lowering interest rates anytime soon. Evidence that this decline was partially due to pessimism regarding interest rates can be seen in Upstream Inventory Levels declining from a robust growth of 64.8 in March to holding steady at 50.0 in April. This suggests that manufacturers are keeping their powder dry until the interest rate picture becomes clearer – whether April’s more optimistic jobs report will impact this in any meaningful way remains to be seen. There was also a small difference in inventory growth by firm size as smaller respondents reported contraction (49.0) while large firms – who are perhaps in a better position to leverage their size to generate cash – saw mild growth (53.3).
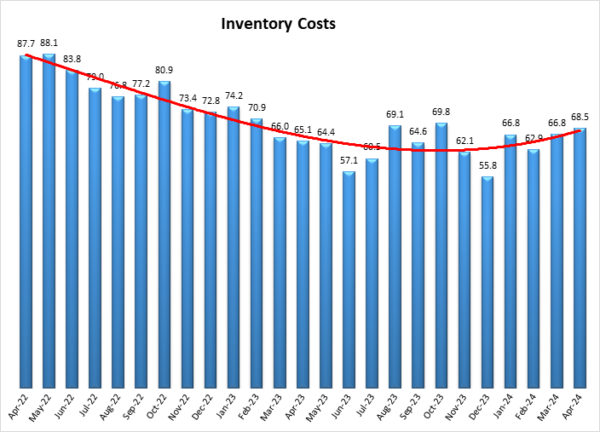
There are some indicators that the influx of goods could pick up. The Chinese manufacturing PMI read in at 50.4 in April. This is down slightly from March’s reading of 50.8 but does indicate a second consecutive month of growth in output[9]. With the strong U.S. dollar and depreciating Yuan, Chinese imports have decreased in relative cost. The ongoing issues with real estate continue to be an albatross for China, but continued growth in manufacturing does provide some hope that the world’s second largest economy is on the road to recovery. Paired with increasing Asian exports is a change in U.S. consumer spending habits. After 30 consecutive months of growth, the Services PMI moved into contraction in April 2024, corroborating anecdotal evidence that Americans are making their long-anticipated pullback on restaurant and entertainment spending[10]. Americans are increasingly moving away from spending on things like eating out and towards grocery stores in an attempt to save money[11]. The buildup for the back-to-school season that will begin later in Q2 will provide some answers on whether consumers are moving away from the spending on services that has defined the last few years and back towards more spending on goods which will require increased logistics activity. No matter what happens with Inventory Levels, it seems that Inventory Costs have become essentially bulletproof, as they increased (1.6) to 68.5, their highest rating since October 2023. This is not a new phenomenon; Inventory Costs are one of the two metrics that has shown expansion in every reading in the history of the LMI.
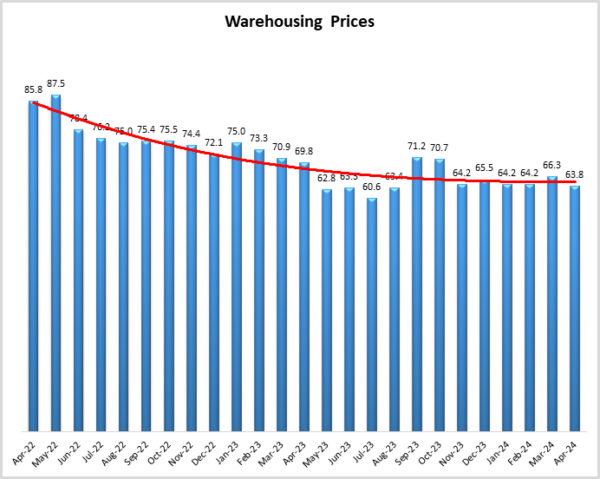
The other metric that has never contracted is Warehousing Prices, which read in at 63.8 (-2.5) in April. This is somewhat intuitive as Inventory Costs are logically tied to Warehousing Prices. Stord provided a vote of confidence that warehousing will continue to be robust with its recent acquisition of ProPack Logistics and their portfolio of warehousing that specialize in climate-controlled storage for SMEs[12]. For Stord, it seems that this is more about an expansion of the scope of their abilities than the scale of their operations. This exemplifies the creative steps that 3PLs have taken to diversify their offerings with the goal of generating alternate sources of revenue that are needed with the flattening of the e-commerce market. This is corroborated in a recently released CBRE report that shows that retailers and wholesalers (36%) passed 3PLs (35%) as the largest occupiers of warehousing space. They expect the warehousing market to continue growing at a slower but steady pace of 5% in 2024 as firms increasingly settle into a “post-pandemic new normal”[13].
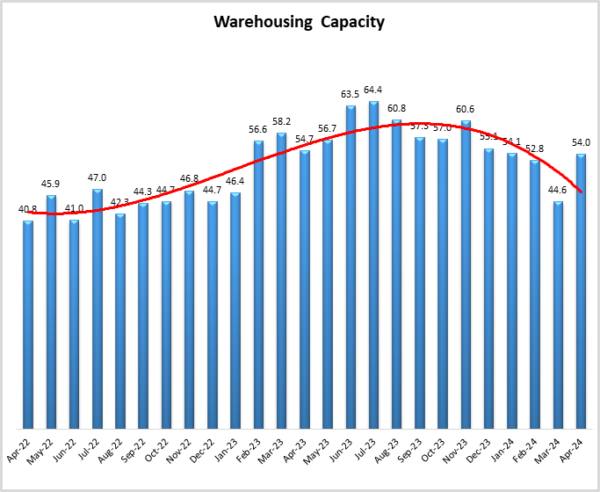
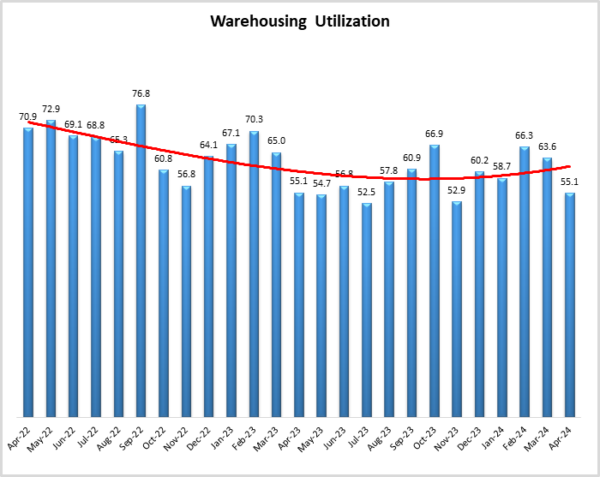
While there is still demonstrable strength, the warehousing market has clearly softened relative to the robust growth it experienced through 2022 and much of 2023. Warehousing Utilization read in at 55.1 in April which was down (-8.5) from March. In the first half of the month utilization actually contracted (48.7) before rebounding later in April (59.2). This mixed messaging was demonstrated in industry leader Prologis’ recent financial reporting. While they reported higher-than-expected revenues for Q1, they have lowered their guidance for the rest of the year, citing caution among would-be-leasers. They do note that demand is still high for large firms like Home Depot and Amazon – something that lines up with the significant disparity we see in Warehousing Capacity between large (47.8 – showing contraction) and small firms (59.4 – showing expansion). The reason for the slight slowdown in warehousing (which again remains strong overall) is that capacity has loosened up. After one month showing contraction, Warehousing Capacity was up (+9.4) to 54.0 in April which suggests a mild rate of expansion. This is consistent with a recent report from Cushman Wakefield showing that the average vacancy rate for warehousing in the U.S. is up to 5.8%[14].
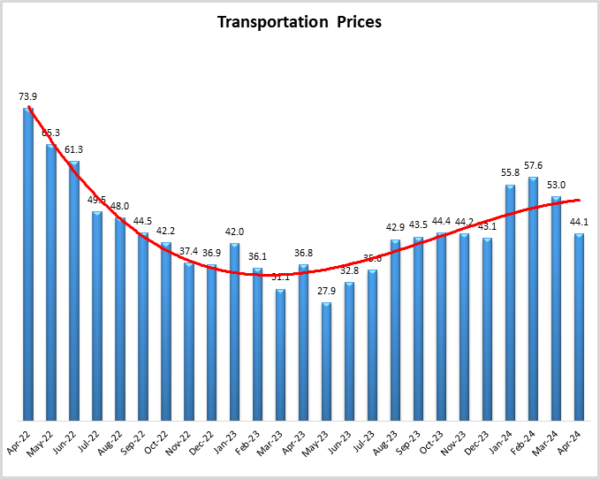
As is often the case, transportation is the most reactive to changes in the economy. After three consecutive months of expansion, Transportation Prices dropped (-8.9) back into contraction with a reading of 44.1. This could have at least partly due to the declining price of fuel. The cost of diesel fuel in the last week of April was $3.947 per gallon, coming in under $4.00 for the second consecutive week. This is down $0.071 from the same time a year ago, demonstrating continued softness in transportation[15]. It should be pointed out though that prices are likely to go up somewhat as summer approaches (which is closer than it might seem as 48 hours after the release of this report this author will be giving their last final of the semester at Colorado State University).
The domestic freight situation is directly impacted by the continued disruptions in international shipping. Another factor in constrained fuel costs is the lower price of crude as markets dialing back their expectations of a full-on shooting war between Israel and Iran. Diesel is down 16.2 cents/gallon from the week of February 12th when delays in the Suez Canal, along with the potential of a wider Middle East conflict, drove prices up 21 cents/gallon[16]. Air cargo demand increased by double digits in every month of Q1 2024. This increase is largely due to firms looking to avoid the long wait times for ocean cargo that have become common due to carriers sailing around the horn of Africa to avoid issues in the Red Sea. This increase has led air freight moving between Europe and the Middle East and South Asia to increase by 71% year-over-year[17]. Relatedly, ocean shipper Maersk reported a 19% dip in earnings in Q1 due to the longer sailings necessitated by the Red Sea blockages. While they do expect rates to come down later this year, that is only become they have a high number of new vessels being delivered which will increase capacity and put them in an even trickier position[18]. Some relief for maritime shippers and carriers may be on the way in the form of rain, specifically rain near the Panama Canal. After suffering its driest October in 73 years in 2023, rain has begun to fall in Panama again. This has allowed them to increase the number of sailings a day. Overall shipping is at 60% of where it was in 2022, while more compact container ships and product tankers are back up to 90% of normal[19]. This will be a godsend for East Coast ports, who have seen volumes fall with the slowdown at the canal. More volume on the East Coast will also allow for a rebalancing of trucking fleets, which have disproportionately moved towards the West Coast ports over the past few months.
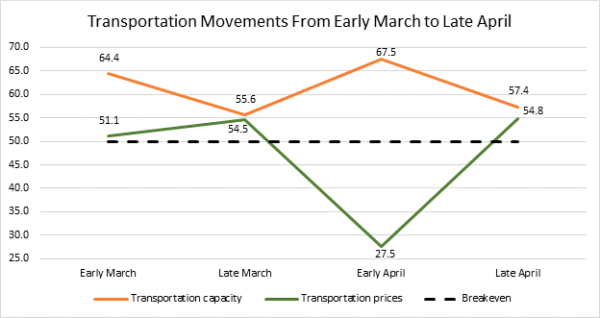
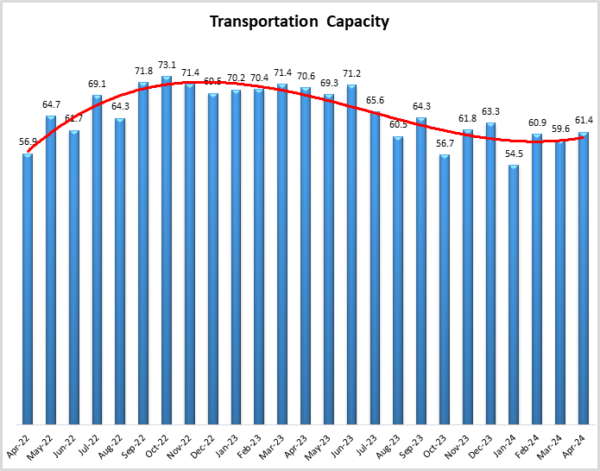
Transportation Capacity is up (+1.8) to 61.4 which is a robust rate of growth. We often contrast Transportation Capacity (orange line) with Transportation Prices (green line) as a measure of supply and demand mismatches in the economy. The dip in logistics activity in early April led to Transportation Capacity reading in 40.0 points higher than Transportation Prices, if it had held, this type of spread would indicate a serious freight recession. However, the late April turnaround closed this gap significantly, bringing the two lines within 2.6 points of one another.
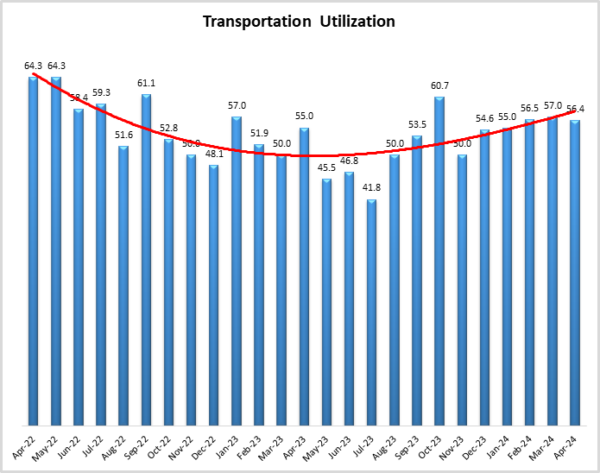
For us to be comfortable calling an end to the freight recession we would have to see several readings in a row in which prices grow faster than capacity. While we inched close in late April, we are still some distance away from moving back into a boom period. This is reflected in recent earnings reports from large carriers. Despite a 3% increase in volumes, intermodal carrier CSX reported a 9.5% decrease in year-over-year profits. This is due to weakness in the trucking market offsetting mild growth on the rail side[20]. Relatedly, the Intermodal Association of North America said that overall intermodal volumes were up 8.8% in Q1. However, this was largely due to an increase in imports carried by rail. Trucking volumes were down a staggering 24.8% over the same period. This is exemplified in J.B. Hunt’s recent Q1 earnings which came in at $127.5 million – down 35.5% year-over-year and due to a similar softness in their trucking segment[21]. Knight-Swift is attempting to take advantage of the weaker market by acquiring smaller LTL carriers that are struggling with the current low rates[22]. Conversely, Old Dominion reported a 2.5% increase up to 292.3 million in profits in Q1. CEO Marty Freeman believes that this, combined with positive movement in the PMI, suggests demand is improving[23]. Freeman’s predictions are consistent with respondent predictions that the transportation market will move back into a stronger state of growth within the next 12 months. A silver lining for carriers is that Transportation Utilization barely moved (-0.6) in April, reading in at 56.4 and indicating a steady rate of expansion.
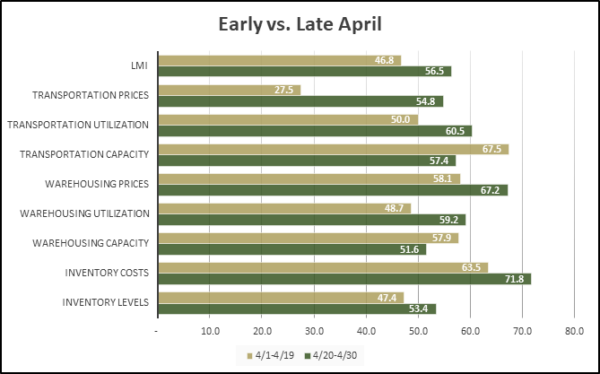
As mentioned above, in April we saw significant differences between responses from early (gold bars) and late (green bars) in the month. We saw slower rates of expansion for both Warehousing Capacity (-6.3) and Transportation Capacity (-10.1). This tightened capacity led to significantly faster rates of expansion for Warehousing Prices (+9.1), Transportation Utilization (+10.5) and Transportation Prices (an eye-popping +27.3). This is all driven by Inventory Levels flipping from contraction (47.4) to expansion (53.4). This is the mirror image of March, where Inventory Levels went from a fast buildup early (74.4) to much slower movements late (55.7). We noted last month that it would be interesting to see whether this trend continues and clearly it did. The raft of strong economic indicators that came out in late March and early April caused many analysts to reevaluate when interest rates might come down. This slowdown may have caused firms – particularly Upstream firms, to reconsider their short-term inventory plans. Whatever the case, things seemed to have turned around in late April, with the overall LMI moving from contraction (46.8) to expansion (56.5). Respondents are expecting the logistics industry to move back to a boom in the next 12 months. That comping to pass may depend on whether the trends of late April continue into the rest of Q2.
| Inv. Lev. | Inv. Costs | WH Cap. | WH Util. | WH Price | Trans Cap | Trans Util. | Trans Price | LMI | |
| 4/1-4/19 | 47.4 | 63.5 | 57.9 | 48.7 | 58.1 | 67.5 | 50.0 | 27.5 | 46.8 |
| 4/20-4/30 | 53.4 | 71.8 | 51.6 | 59.2 | 67.2 | 57.4 | 60.5 | 54.8 | 56.5 |
| Delta | 6.1 | 8.3 | 6.3 | 10.5 | 9.1 | 10.1 | 10.5 | 27.3 | 9.7 |
| Significant? | No | No | No | Marginal | Marginal | Yes | Yes | Yes | Yes |
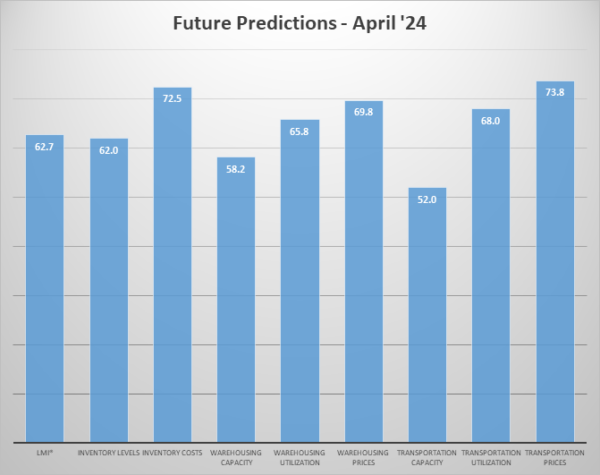
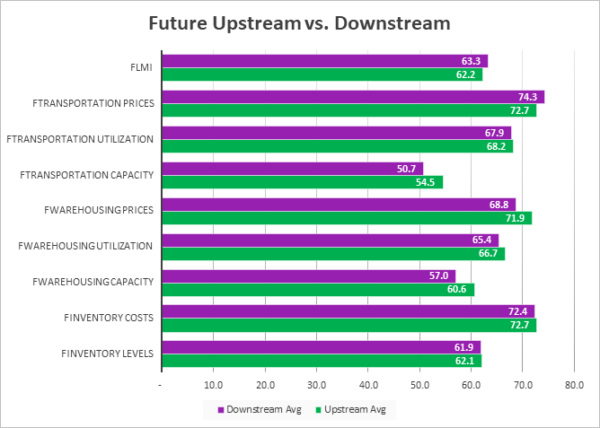
Respondents were asked to predict movement in the overall LMI and individual metrics 12 months from now. Respondents continue to be largely optimistic about the future of the logistics industry, predicting an overall growth rate of 62.7, which is down very slightly (-0.8) from March’s future prediction of 63.5 and very consistent with future predictions from February’s (61.8) and January (62.8). All of these predictions suggest that the logistics industry will grow at a healthy, sustainable pace throughout the rest of the year. An interesting contradiction in the predictions is that Inventory Levels are expected to grow at a robust level of 62.0, but at the same time capacity is expected to loosen up (58.2 for Warehousing Capacity and 52.0 for Transportation Capacity). This is a shift from March when both capacity metrics were predicted to contract slightly. Conversely, predictions for utilization and price metrics remain strong, with each of those metrics predicted to grow in the mid-60’s to low-70’s – all of which would represent healthy, sustainable growth in the logistics industry.
Future expectations are incredibly consistent across the supply chain, as we see virtually no difference in the predictions of our Upstream respondents (green bars) and their Downstream (purple bars). Somewhat uniquely, both groups of respondents predicted expansion across every metric over the next 12 months. Only Transportation Capacity comes close to a break-even level with a prediction of 50.7 from Downstream respondents – possibly signaling continued strength in consumer activity. Taken together, these readings suggest that growth will be evenly distributed across the supply chain over the next year. This is a marked shift from Q1 in which Upstream firms had consistently been expecting higher rates of growth. This may be a reflection of the trepidation regarding whether or not interest rates will come down in a significant way, allowing for greater capital investment, until much later this year.
| Futures | Inv. Lev. | Inv. Costs | WH Cap. | WH Util. | WH Price | Trans Cap. | Trans Util. | Trans Price | LMI |
| Upstream | 62.1 | 72.7 | 60.6 | 66.7 | 71.9 | 54.5 | 68.2 | 72.7 | 62.2 |
| Downstream | 61.9 | 72.4 | 57.0 | 65.4 | 68.8 | 50.7 | 67.9 | 74.3 | 63.3 |
| Delta | 0.2 | 0.3 | 3.6 | 1.3 | 3.1 | 3.8 | 0.3 | 1.5 | 1.1 |
| Significant? | No | No | No | No | No | No | No | No | No |
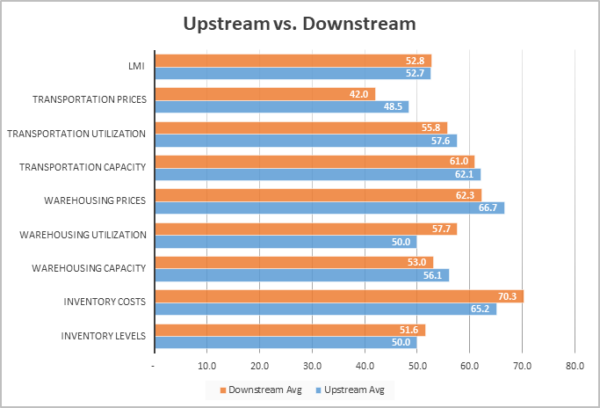
Just as there are no differences regarding future expectations, there are also no discernible differences in the current feedback from Upstream (blue bars) and Downstream (orange bars) respondents. This is a continuation of the cross-supply chain balance that we observed in both February and March and suggests that not only did Upstream firms “catch up” to their Downstream counterparts after almost a year of lagging, but that they have maintained it as well. There are a few notable, though statistically insignificant, differences between the two groups as Downstream firms are slightly busier for Transportation Prices (+6.5), Warehousing Utilization (+7.7) and Inventory Costs (+70.3). Because Inventory Levels are similar (50.0 Upstream and 51.6 Downstream), these differences are likely a reflection of the more expensive and physically constrained spaces that Downstream firms utilize to manage their inventories. The move towards marginal inventory expansion Downstream is consistent with the much-anticipated move back towards JIT and suggests that the spike of inventory growth in early March may have been an aberration.
| Inv. Lev. | Inv. Costs | WH Cap. | WH Util. | WH Price | Trans Cap | Trans Util. | Trans Price | LMI | |||||||||||
| Upstream | 50.0 | 65.2 | 56.1 | 50.0 | 66.7 | 62.1 | 57.6 | 48.5 | 52.7 | ||||||||||
| Downstream | 51.6 | 70.3 | 53.0 | 57.7 | 62.3 | 61.0 | 55.8 | 42.0 | 52.8 | ||||||||||
| Delta | 1.6 | 5.2 | 3.0 | 7.7 | 4.4 | 1.1 | 1.8 | 6.5 | 0.1 | ||||||||||
| Significant? | No | No | No | No | No | No | No | No | No |
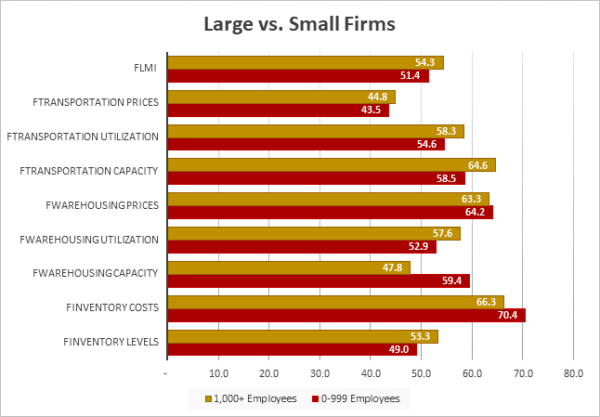
April’s responses suggested that, as is often the case, larger firms (those with 1,000 employees or more, represented by gold lines) saw greater activity than smaller firms (those with 0-999 employees, represented by maroon lines). Smaller firms reported slight contraction for Inventory Levels (49.0) while larger firms reported some expansion (53.3). this in turn led to contraction in available Warehousing Capacity for large firms (47.8), which was significantly less than the expansion seen by smaller firms (59.4). Interestingly, Transportation Capacity is the opposite, with smaller firms seeing slower growth (58.5 to 64.6).
| Employees | Inv. Lev. | Inv. Costs | WH Cap. | WH Util. | WH Price | Trans Cap. | Trans Util. | Trans Price |
LMI |
| 0-999 | 49.0% | 70.4% | 59.4% | 52.9% | 64.2% | 58.5% | 54.6% | 43.5% | 51.4% |
| 1,000+ | 53.3% | 66.3% | 47.8% | 57.6% | 63.3% | 64.6% | 58.3% | 44.8% | 54.3% |
| Delta | 4.3% | 4.1% | 11.6% | 4.7% | 0.8% | 6.1% | 3.7% | 1.3% | 2.9% |
| Significant? | No | No | Yes | No | No | No | No | No | No |
The index scores for each of the eight components of the Logistics Managers’ Index, as well as the overall index score, are presented in the table below. The rate of expansion for the overall index is down (-5.4) to 52.9. This slowed pace of growth is primarily driven by slowdowns in the expansion of Inventory Levels and Warehousing Utilization. After a one-month foray into contraction, Warehousing Capacity is back into expansionary territory, reflective of slower inventory movements. The one metric that is contracting is Transportation Prices, which had expanded in every month of 2024 until now. Whether these trends will continue going forward or are only due to the soft spot we hit in early April remains to be seen.
| LOGISTICS AT A GLANCE | |||||
| Index | April 2024 Index | March 2024 Index | Month-Over-Month Change | Projected Direction | Rate of Change |
| LMI® | 52.9 | 58.3 | -5.4 | Expanding |
Slower |
| Inventory Levels | 51.0 | 63.8 | -12.8 | Expanding | Slower |
| Inventory Costs | 68.5 | 66.8 | 1.6 | Expanding | Faster |
| Warehousing Capacity | 54.0 | 44.6 | 9.4 | Expanding | From Contraction |
| Warehousing Utilization | 55.1 | 63.6 | -8.5 | Expanding | Slower |
| Warehousing Prices | 63.8 | 66.3 | -2.5 | Expanding | Slower |
| Transportation Capacity | 61.4 | 59.6 | 1.8 | Expanding | Faster |
| Transportation Utilization | 56.4 | 57.0 | -0.6 | Expanding |
Slower |
| Transportation Prices | 44.1 | 53.0 | -8.9 | Contracting | From Expansion |
Historic Logistics Managers’ Index Scores
This period’s along with prior readings from the last two years of the LMI are presented table below:
| Month | LMI | Average for last 3 readings – 55.9
All-time Average – 62.1 High – 76.2 Low – 45.4 Std. Dev – 8.27
|
| Apr ‘24 | 52.9 | |
| Mar ‘24 | 58.3 | |
| Feb ‘24 | 56.6 | |
| Jan ‘24 | 55.6 | |
| Dec ‘23 | 50.6 | |
| Nov ‘23 | 49.4 | |
| Oct ‘23 | 56.5 | |
| Sep ‘23 | 52.4 | |
| Aug ‘23 | 51.2 | |
| July ‘23 | 45.4 | |
| June ‘23 | 45.6 | |
| May ‘23 | 47.3 | |
| Apr ‘23 | 50.9 | |
| Mar ‘23 | 51.1 | |
| Feb ‘23 | 54.7 | |
| Jan ‘23 | 57.6 | |
| Dec ‘22 | 54.6 | |
| Nov ‘22 | 53.6 | |
| Oct ‘22 | 57.5 | |
| Sep ‘22 | 61.4 | |
| Aug ‘22 | 59.7 | |
| July ‘22 | 60.7 | |
| June ‘22 | 65.0 | |
| May ‘22 | 67.1 | |
| Apr ‘22 | 69.7 |
LMI®
The overall index reads in at 52.9 in April, down (-5.4) from March’s 18-month high of 58.3. The slowdown in growth is largely due to slower inventory buildups cascading into excess capacity for both warehousing and transportation, as well as Transportation Prices moving to contraction. Despite the dip, the overall index is higher (+2.0) than it was this time a year ago when the index was on the verge of moving into contraction for three months. There is virtually no difference between Upstream (52.7) and Downstream (52.8) respondents, and only a mild difference between small (51.4) and large (54.3) firms. Where we do see a difference is between early (46.8) and late (56.5) April. This move from contraction to expansion was statistically significant. It is unclear why exactly there was such a marked shift, but one strong possibility is that the strong jobs report in the first week of April pushed firms to reevaluate when interest rates might come down and caused them to push their inventory plans back to later in the year. It will be interesting to see if this shifts next month following the “Goldilocks” job report that was released last Friday.
When asked to predict what conditions will be over the next 12 months respondents foresee a rate of expansion of 62.7, down slightly (-0.8) from March’s future prediction of 63.5. This is relatively consistent with the future predictions from February (61.8) and January (62.8). So, while the current situation has shifted, future expectations that we will see steady growth over the next 12 months have remained consistent. Upstream firms are predicting a minimally slower rate of growth than their Downstream counterparts (62.2 to 63.3).
Inventory Levels
The Inventory Level index read in at 51.0, down significantly (-12.7) from March’s reading of 63.8. The slowdown in inventory growth, particularly in the first half of the month, is the primary reason the overall index slowed down in April. That being said, we do still read growth for the fourth consecutive period, which is a shift from the end of 2023 where Inventory Levels contracted in 7 out of 8 months. Inventory Levels are 0.1 points higher than a year ago, and 21.3 points lower than two years ago that this time. Inventories held relatively stead across the supply chain, as Upstream respondents returned a value of 50.0, and Downstream respondents returned a similar value of 51.6. In the reverse of March when respondents from the first half of the month returned a value of 74.4, to 55.7 or respondents from the second half, in April respondents reported contraction at 47.4 early, but growth at 53.4 later on. This month, small firms reported slight contraction at 49.0, while larger firms reported a small increase at 53.3.
When asked to predict what conditions will be like 12 months from now, the average value is 62.0, up (+3.0) from March’s future prediction of 59.0, In a departure from the last two months, this prediction is consistent across the supply chain as Upstream (62.1) and Downstream (61.9) respondents are both anticipating steady growth over the next year.
Inventory Costs
Inventory costs read in at 68.5, up (+1.7) from March’s reading of 66.8. The increase in Inventory Costs come despite the slowdown of growth for Inventory Levels. This has been a common pattern in our index as despite Inventory Levels declining in 7 of the last 8 months of 2023, Inventory Costs did not contract in 2023 – and in fact, have never contracted in the history of the index (something that is likely tied to Warehousing Prices never contracting). The current value is 3.4 points higher than last year, and 19.2 points lower than two years ago. Downstream firms are feeling the increasing costs more acutely than their Upstream counterparts (71.8 to 63.5) which is likely due to the more expensive, urban warehouses that retailers tend to prefer. Mirroring the trend throughout this month’s report, early respondents reported slower rates of growth than later respondents (63.5 to 71.8). We also saw faster growth for smaller firms than larger firms (70.4 to 66.3) which is a change from last month and might reflect the relatively lower bargaining power and/or reduced economies of scale inherent to smaller firms.
Predictions for future Inventory Cost growth is 72.5, which is up (+4.6) from March’s prediction of 67.9 and would represent a significant rate of growth. This significant expansion is expected evenly across the supply chain, with Upstream (72.7) and Downstream (72.4) firms predicting nearly identical rates of growth.
Warehousing Capacity
The Warehousing Capacity index bounced back into expansionary territory (54.0) from a previously sharp decline, reflecting a 9.4-point increase from the reading last month, thus breaking the downward trend for the prior four months. This reading is down 0.7 points from the reading one year ago, and up 13.2 points from the reading two years ago. In addition, there was a 3.1-point split between Upstream (56.1) and Downstream (53.0) which was not statistically significant (p<.1). Comparing the differences between small and large firms we see that these values are 59.4 and 47.8, respectively. This 11.6-point split was statistically significant (p<.05).
When asked to predict what conditions will be like 12 months from now respondents expect Warehouse Capacity to expand at a rate of 58.2, this is a significant increase (+9.3) from March’s prediction of contraction at 48.9, but in line with February’s future prediction of 59.0. These future expectations are fairly consistent across Upstream (60.6) and Downstream (57.0) respondents.
Warehousing Utilization
The Warehousing Utilization index registered in at 59.1 points for the month of April 2024, reflecting a sizeable 8.5-point decrease from the month prior. This reading was unchanged from the reading one year ago, and down 15.8 points from the reading two years ago. In addition, there was a 7.7-point split between Upstream (50.0) and Downstream (57.7) which was not statistically significant (p>.1). Comparing the differences between small (<999 employees) and large (>999) employers we see that these values are 52.9 and 57.6, respectively. This 4.7-point split was not statistically significant (p>.1).
When asked to predict what conditions will be like 12 months from now respondents expect Warehouse Utilization to increase at a rate of 65.8, up (+4.5) from March’s future prediction of 61.3. As we saw with capacity, future Upstream expectations (66.7) are very consistent with those of their Downstream counterparts (65.4). Upstream expectations are consistent with March, but Downstream predictions have increased significantly from last month’s prediction of 53.6, potentially suggesting confidence in consumer spending through the rest of the year.
Warehousing Prices
The Warehousing Price index registered in at 63.8 points for the month of April 2024, which is down 2.5 points from the reading last month. This reading is down 6 points from the reading one year ago, and down a sizable 22.0 points from the reading two years ago. In addition, there was a 4.4-point split between Upstream (66.7) and Downstream (62.3) which was not statistically significant (p>.1 Comparing the differences between small (<999 employees) and large (>999) employers we see that these values are 64.2 and 63.3, respectively. This 0.9-point split was not statistically significant (p>.1).
When asked to predict what conditions will be like 12 months from now respondents expect Warehouse Prices to increase at a rate of 69.8, down (-4.9) from March’s reading of 74.5 (although like the other two warehousing metrics, it is in line with February’s prediction of 69.1). Similar to our other warehousing metrics, future Upstream expectations (71.9) are very similar to Downstream expectations (68.8).
Transportation Capacity
The Transportation Capacity Index registered 61.4 in April 2024. This constitutes an increase of 1.8 points from last month’s reading of 59.6. The move back into the 60’s indicates that despite some contraction, there is still simply too much excess capacity in the market for the freight recession to end. This is despite the consistently strong consumer spending we have seen through most of the 2020’s. At this point, it seems that the only things that could effectively drive this down are further exits or greater levels of capital investment and activity Upstream (which would likely be spurred by a change in the interest rates). The Upstream Transportation Capacity index is at 62.1, while the Downstream index is at 61.0, a difference that is not statistically significant.
The future Transportation Capacity index is up 2.5 points, now indicating 52.0, moving back above the critical threshold and indicating expectations of very slight expansion over the next 12 months. The Downstream future Transportation Capacity index is at 50.7 while the Upstream future Transportation Capacity index indicates 54.5. However, this difference is not statistically significant.
Transportation Utilization
The Transportation Utilization Index is little changed from last month, indicating 56.4 in April, which is down very slightly (-0.6) from March’s reading of 57.0. Of the three transportation metrics this has been easily the most consistent through 2024 as the readings have ranged from 55.0 on the low- to 57.0 on the high-end. This suggests that even with the fluctuations in Transportation Capacity, respondents are consistently seeing marginal increases in utilization. The fact the Transportation Utilization is not increasing as quickly as new Transportation Capacity comes online is part of the reason for the continuing mismatch in supply and demand in the freight market. The Downstream Transportation Utilization Index is now at 55.8, while the Upstream index is now at 57.6. However, this difference is not statistically significant either.
The future Transportation Utilization Index changed very little and continues to indicate expansion at 68.0 for the next 12 months. The Upstream Transportation Utilization index is at 68.2 while the Downstream index is at 67.9, with the difference being statistically not significant.
Transportation Prices
The Transportation Prices Index indicates 44.1 in April 2024, which corresponds to a large drop (-8.9) from March’s reading of 53.0. With this drop, the Transportation Prices moved into contraction territory for the first time in 2024. The last three months of expansion were the first ones following 18 consecutive months of contraction. As discussed above, there was a significant uptick in Transportation Prices from early (27.5) to late (54.8) April. Whether or not the freight recession ends during Q2 will depend largely on whether the rest of the Spring looks more like early or late April. The Downstream Transportation Prices index is now at 42.0, while the Upstream index is at 48.5, however the difference is not statistically significant. As such, it can be concluded that the downward pressure on Transportation Prices is felt across the supply chains.
The future index for Transportation Prices is now at 73.8 points and continues to indicate expectations of higher Transportation Prices in the next 12 months. The Downstream Transportation Prices index is at 74.3 while the Upstream Transportation Prices index is at 72.7. So, despite a slight drop seen in the future price index from the previous month, expectations of higher Transportation Prices over the next year are spread across the supply chain.